Introduction
Mastitis is one of the most important diseases affecting dairy cows (Grohn, et al., Reference Grohn, Gonzalez, Wilson, Hertl, Bennett, Schulte and Schukken2005), with an estimated incidence of 25% of cows calving in Ireland (Berry and Amer, Reference Berry and Amer2005). It has a significant economic impact resulting from the costs of prevention and treatment (Kaneene and Scott-Hurd, Reference Kaneene and Scott-Hurd1990), milk loss and increased culling (Grohn et al., Reference Grohn, Gonzalez, Wilson, Hertl, Bennett, Schulte and Schukken2005). In addition to profitability, mastitis is a serious impediment to dairy cow welfare, causing pain and distress (Eshraghi et al., Reference Eshraghi, Zeitlin, Fitzpatrick, Ternent and Logue1999). The economic and welfare costs mean that research on the risk factors associated with mastitis is essential.
Incidence rate of clinical mastitis (CM) is affected by risk of exposure to environmental pathogens (Barkema et al., Reference Barkema, Schukken, Lam, Beiboer, Benedictus and Brand1999b). Housing conditions, management style and the cleanliness of the animals are factors that influence contact with these pathogens (Osteras and Lund, Reference Osteras and Lund1988; Bartlett et al., Reference Bartlett, Miller, Lance and Heider1992a; Barkema et al., Reference Barkema, Schukken, Lam, Beiboer, Benedictus and Brand1999b). Bartlett et al. (Reference Bartlett, Miller, Lance and Heider1992b) found increased prevalence of infection from coliforms and environmental Streptococci with worsening sanitary conditions. Furthermore, intramammary environmental pathogens are significantly associated with udder hygiene scores (Schreiner and Ruegg, Reference Schreiner and Ruegg2003).
Somatic cell count (SCC) was identified as a useful indicator of both clinical and sub-clinical mastitis (Lund et al., Reference Lund, Miglior, Dekkers and Burnside1994; Poso and Mantysaari, Reference Poso and Mantysaari1996; Koivula et al., Reference Koivula, Mantysaari, Negussie and Serenius2005), and changes in SCC over a lactation may even predict animals that are at risk from specific pathogens (Haas et al., Reference de Haas, Barkema and Veerkamp2002). Furthermore, SCC and California mastitis test (CMT) values in early lactation can be used to detect cows with intramammary infection (IMI) (Sargeant et al., Reference Sargeant, Leslie, Shirley, Pulkrabek and Lim2001). Winter accommodation for dairy cows also has a significant effect on SCC, animals in loose housing systems having higher scores than tied cows (Bartlett et al., Reference Bartlett, Miller, Lance and Heider1992b). Schreiner and Ruegg (Reference Schreiner and Ruegg2003) found that linear SCC was also associated with leg hygiene score, and increased as udder hygiene score increased.
Alternatives to cubicle accommodation for dairy cattle are emerging (Barberg et al., Reference Barberg, Endres, Salfer and Reneau2007; Gazzola et al., 2007; O’Driscoll et al., Reference O’Driscoll, Boyle, French and Hanlon2008). A potentially viable system consists of group housing cows on an organic bedding substrate without physical constructions such as cubicles. One example of this is a bedded pack system, which is of growing interest to dairy producers in the US (Barberg et al., Reference Barberg, Endres, Salfer and Reneau2007). However, Barberg et al. (Reference Barberg, Endres, Salfer and Reneau2007) reported that excellent cow preparation for milking procedures and management of the pack were necessary to achieve low bulk tank SCC. In Ireland (Hickey et al., Reference Hickey, French and Grant2002; O’Driscoll et al., Reference O’Driscoll, Boyle, French, Meaney and Hanlon2006) and New Zealand (Fisher et al., Reference Fisher, Stewart, Verkerk, Morrow and Matthews2003; Tucker et al., Reference Tucker, Rogers, Verkerk, Kendall, Webster and Matthews2007) woodchip pads, or out-wintering pads (OWPs), are under investigation as an alternative winter confinement system for dairy cattle. However, Hourihan (Reference Hourihan2006) showed that woodchip pads become dirtier as stocking density and the number of weeks in use increase. This could have serious implications for the success of these systems for dairy cows, given the link between dirtiness and mastitis. Over half of all environmental pathogens acquired during the dry period persist to lactation (Todhunter et al., Reference Todhunter, Smith and Hogan1995). Hence udder health may be compromised both during the winter, which coincides with the dry period for spring-calving dairy cows, and during the following lactation when the cows are at pasture. Currently there is no published literature on the implications for dairy cow health of confinement on woodchip pads. This paper describes findings from a case study and an experimental study, both of which aimed to compare different OWP systems for dairy cows with conventional cubicle housing. The parameters investigated were the incidence of CM during the dry period and during the subsequent lactation, animal dirtiness during the dry period and SCC during the subsequent lactation.
Material and methods
The studies were conducted at Teagasc ‘Ballydague’ research farm, which is part of Moorepark Dairy Production Research Centre, between December 2004 and December 2005 (year 1) and December 2005 and December 2006 (year 2).
Year 1 – case study
Animals and treatments
In all, 147 pregnant dairy animals (Bos Taurus) (44 nuliparous and 103 multiparous cows) were blocked according to breed (Holstein-Friesian, Normande, Montbeliarde, Norwegian Red, Montbeliarde × Holstein-Friesian, Normande × Holstein-Friesian), parity (1.78 ± 1.58), expected calving date (21 February 2005 ± 25.5 days) and body condition score (BCS) (3.09 ± 0.29) into 49 groups. One animal from each group was then randomly assigned to one of the following treatment groups from 6 December 2004: (i) indoor cubicle housing (IC); (ii) an uncovered woodchip pad with a concrete feed face (uncovered OWP, UP); and (iii) a covered woodchip pad with a concrete feed face (covered OWP, CP). Thus, as there were 49 blocks, and one animal from each was assigned to each treatment, there were 49 animals per treatment.
Housing and management
The cows used in this study were managed using a pasture-based spring-calving system. Cows were taken from pasture at the end of the grazing season (early winter) and put onto the treatments described, which roughly covered the dry period. Indoors, the cubicles were bedded with rubber mats, and were provided at a cow-to-cubicle ratio of 1 : 1. They were of a ‘Super Dutch Comfort’ design (O’Connell et al., Reference O’Connell, Meaney and Giller1991) and were manually cleaned and treated with lime each day. An automatic scraper cleaned the solid concrete floor six times daily. The woodchip lying areas were constructed according to published guidelines (Hickey et al., Reference Hickey, French and Grant2002). Cows on UP had a woodchip space allowance of 12 m2 per head, while CP cows were provided with 6 m2 woodchip surface. The latter OWP was sheltered on two sides by erecting a 1.83 m-high semi-porous barrier (Nicofence®; R.J.M. Mooney & Son Ltd, Dublin, Ireland), and overhead by a green polythene tunnel. Cows in all three treatments self-fed silage from a concrete-floored feed face with 60 cm space per cow. Manure was cleaned from the feed face areas in UP and CP once a day by a tractor.
The woodchips were scored weekly using a published scoring system (Hickey et al., Reference Hickey, French and Grant2002). The scale ranged from 1 (clean woodchips) to 4 (thick faecal layer), using the technique described by O’Driscoll et al. (Reference O’Driscoll, Boyle, French and Hanlon2008). A score of 1 or 2 constituted an acceptable level of cleanliness. Pads were managed so that each cow had a clean lying area of 2.2 m2. When this level was breached, dirty woodchips were removed and replenished with clean woodchips. Pads were cleaned on 20 December 2004, 18 January 2005 and 5 February 2005.
Between 6 and 15 December 2004, lactating and non-lactating cows were kept within their respective treatments, but separated by an electric wire on the OWPs, and a gate in IC. All cows were dried off by 16 December 2004, and for the remainder of the experiment cows were managed as a single group within each treatment. The mean calving date was 23 February 2005. Approximately 6 days prior to its calving date (5.9 ± 4.41 days, mean ± s.d.) each cow was removed to a straw-bedded calving house. The correct stocking density for the remaining animals was maintained by adjustment of an electric wire or gate as appropriate. Post partum, cows remained with their calves until the next milking. Later they were returned to a different straw-bedded house for one night. Cows that calved prior to 14 February 2005 (n = 88) were returned to their treatments post calving, and separated from non-lactating animals by an electric wire or gate, as before. They remained here at night, and were at pasture by day, until 14 February, when they were at pasture day and night. Cows calving from 15 February onwards were at pasture by day and night. All cows were dried off by 30 November 2005.
During the winter housing period, fresh grass silage (dry matter (DM) 19.9%, crude protein (CP) 14.1%, dry matter digestibility (DMD) 72.7%, NDF 44.8%, ash 6.2%) was offered ad libitum daily in the morning at 1 kg above requirement in order to ensure animals were not restricted. Fresh water was available from self-filling troughs for each treatment. While at pasture, animals were managed as a single herd. The pasture consisted primarily of perennial ryegrass (Loilum penne). Cows were allocated fresh grass daily, and pre-grazing yield was maintained at between 1800 and 2200 kg DM/ha (>4 cm).
Year 2 – experimental study
Animals and treatments
In all, 96 pregnant dairy cows (Bos Taurus) (40 nuliparous and 56 multiparous) were blocked according to breed (Holstein-Friesian or Norwegian Red), parity (1.56 ± 1.785), expected calving date (22 February 2006 ± 20.1 days) and BCS (3.09 ± 0.29) into 12 groups of eight animals. One animal from each group was then randomly assigned to one of two replicates of the following treatments (i) IC, (ii) UP, (iii) CP, and an uncovered OWP with a self-feed silage pit (SP). Multiparous and primiparous animals were assigned to treatment on 17 November 2005 and 5 December 2005, respectively. Thus, as there were 12 blocks, and one animal from each block was assigned to each treatment replicate, there were 12 animals per treatment replicate.
Housing and management
Housing and management of IC and UP were as in year 1. However, animals accommodated in CP were allocated 12 m2 woodchip space allowance per head. Cows in SP had a woodchip space allowance of 14.52 m2 per head. This was equal to the 12 m2 woodchip and 2.52 m2 concrete feed area space allowance allocated in the UP and CP treatments. The concrete feeding areas of IC, UP and CP were cleaned six times daily by an automatic scraper. The feed faces in each SP replicate were 13.5 m in length. In order to prevent spoilage of the silage, it was necessary for 26 animals to feed from these areas. For this reason, 14 ‘filler’ animals were allocated to each of the SP replicates. OWP dirtiness was scored as described in year 1. The OWP’s were cleaned on 20 January 2006 and 3 March 2006.
All multiparous animals were dried off by 17 November 2005. Between 17 November 2005 and 5 December 2005, multiparous animals from both replicates of each treatment were confined in a single group, within their treatment. On 5 December 2005 they were split into their respective replicates, and the nuliparous animals were added. The mean calving date was 21 February 2006. Animals were removed for calving approximately 3 days prior to calving (3.2 ± 5.51 days) to a straw-bedded calving shed, and managed thereafter as in year 1. Cows that calved prior to 13 February 2006 (n = 40) were kept on an uncovered non-experimental OWP by night and were at pasture by day. All calved cows were at pasture by day and night from 14 February 2006 onwards. Animals were at pasture for the remainder of lactation. All cows were dried off by 19 December 2006.
During the winter housing period, fresh grass silage (DM 19.7%, CP 16.7%, DMD 77.0%, NDF 42.2%, ash 8.4%) and water was provided ad libitum, as in year 1. While at pasture, animals were managed as during year 1. Animals that were kept on the uncovered OWP immediately post partum were offered freshly cut grass ad libitum each morning.
Environmental measurements
Local rainfall and mean daily wind speed data were obtained from a weather station located at Moorepark Dairy Production Research Centre approximately 10 miles from the experimental site. Data were recorded by a trained technician between 26 November 2004 and 18 February 2005, and between 22 November 2005 and 30 January 2006, i.e. between the initial and last dirtiness scoring dates for each year. Ambient air temperature and relative humidity (RH) were recorded using Gemini Tinytag Extra Dataloggers, TGX-3580 (Gemini dataloggers (UK) Ltd, Chichester, West Sussex, UK) between 20 December 2004 and 3 February 2005, and between 3 January 2006 and 28 February 2006. One datalogger was placed each in IC, CP and UP, and data were recorded at 10-min intervals. Dataloggers were suspended 2 m above the ground level. In year 1, dataloggers were positioned at the rear mid-point of the CP and UP treatments, and at the mid-point of the feed face in IC. In year 2, dataloggers were positioned at the rear and midway between the two replicate groups in CP, and above and between the feed faces of the two replicate groups in IC. The UP datalogger was positioned midway between the UP and SP treatments.
Animal measurements
As we wished to study the long-term effects of OWPs on health, animal measurements were made both during the winter treatment period and when the cows were returned to pasture after the winter treatment period.
Animal dirtiness scoring
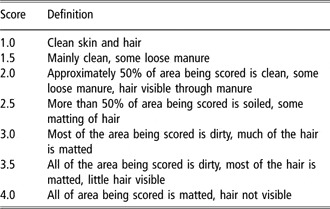
Animals were scored for dirtiness only during the winter treatment period. During year 1, animals were scored every 2 weeks (14 ± 0.6 days, mean ± s.d.), and during year 2 approximately every 2.5 weeks (17 ± 3.3 days). Previously published scoring systems use complex measurements (Hickey et al., Reference Hickey, French and Grant2002) or require the use of equipment while cattle are restrained (Zdanowicz et al., Reference Zdanowicz, Shelford, Tucker, Weary and von Keyserlingk2004; De Palo et al., Reference De Palo, Tateo, Zezza, Corrente and Centoducati2006). Due to the large number of animals in this study, and in order to avoid movement of the cows to a holding area, a scoring system was developed that facilitated rapid assessment of the hygiene of unrestrained cows. Prior to the experiment the scoring system was tested for intra-observer repeatability. An observer scored a set of cows (n = 30) twice in a random order. Cows were scored on the left side of the body, which was subdivided into five areas; front leg, rear leg, hindquarter, belly and udder, and each section scored using a scale from 1 to 4 in 0.5 score increments (Table 1). The sum of these scores constituted the overall dirtiness score for each animal (max = 20; min = 5).
Animal dirtiness scoring system

Composite sample somatic cell count
Cows were milked twice daily for the entire lactation after the treatment period, at approximately 0700 and 1530 h. Milk yield was measured at each milking for every cow using electronic milk meters. Clusters were removed automatically once milk flow fell below 0.2 kg/min. Individual cow milk samples were taken every other week (year 1; 10.8 ± 5.36 days (mean ± s.d.), year 2; 15.4 ± 5.84 days) at one morning and one evening milking, and SCC was determined using the Bentley Somacount 300 (Bentley Instruments Incorporated, Chaska, MN, USA). Milk samples were representative of the four quarters and the entire milking. The last sample to be included in analysis during year 1 was taken on 8 November 2005, and in year 2 on 12 December 2006. On average, 20.9 ± 5.42 samples were taken per animal during year 1, and 17.0 ± 3.69 during year 2.
Clinical mastitis
The udder was inspected daily during the winter accommodation period, and twice daily at milking once the cows had calved, for redness, soreness and/or inflammation as indicators of clinical mastitis (CM). On identification of CM a sample of milk from the affected quarter was taken aseptically and analysed for bacteriological analysis. These recorded cases are referred to as CM, and are based solely on the herdsman’s interpretation of CM (Pryce et al., Reference Pryce, Nielsen, Veerkamp and Simm1999).
Quarter milk samples
Quarter milk samples (QMS) were taken on three and four occasions during years 1 and 2 of the study, respectively, in order to estimate the levels of sub-clinical mastitis in animals from treatment. On each QMS test day, milk samples were collected aseptically from all udder quarters into individual sterile plastic containers after drawing foremilk. During year 1, QMS were taken from all cows at drying off, and approximately 3 weeks (24.4 ± 2.36 days) post partum, and analysed for microbiology and SCC. During year 2, cows had QMS taken at drying off (30 November 2005), approximately 3 weeks post partum (18.3 ± 3.52 days), and on 14 June 2006 (113 ± 23.0 days in milk). All samples were analysed for microbiology as well as SCC quantification. QMS were also collected 2.2 ± 1.98 and 1.8 ± 1.29 days (years 1 and 2, respectively) post calving, and assayed for CMT and microbiology. IMI was considered to have occurred if a positive bacteriological result occurred, and SCC was greater than 200 000. Sub-clinical mastitis was diagnosed at each QMS examination when SCC > 200 000 or CMT > 1 in a sample from at least one quarter, but no macroscopic changes in either the udder or milk were evident (Dohoo and Leslie, Reference Dohoo and Leslie1991). Additionally, any cases of CM at each inspection date were recorded.
Statistical analysis
All data were analysed using the Statistical Analyses System (SAS, v.9.1; SAS Institute, Inc., Cary, NC, USA). Mean daily rainfall and wind speed measurements during the experimental period were compared between years 1 and 2. Daily rainfall was log10-transformed in order to approach a normal distribution. Transformed data were analysed using analysis of variance (ANOVA) (Proc GLM); however, mean rainfall per day is reported using untransformed arithmetic mean and interquartile range. Temperature and RH recordings were compared between treatments and years using repeated measures ANOVA (Proc Mixed). Recordings between 3 January and 3 February each year were used, as it was only between these dates that data from both years were available. Mean values for each recording day were used in the analysis. Fixed effects included treatment, year and the interaction between the two. Date was the repeated variable, nested within year. An autoregressive covariance structure (AR(1)) provided the best model fit.
The dirtiness scoring system was tested for intra-observer reliability using weighted Cohen’s κ (Proc Freq).
For all other analyses, the animal was considered the experimental unit. Data were tested for normality prior to analysis, by examination of box and normal distribution plots. Dirtiness scores from both years were analysed using repeated measures ANOVA (Proc Mixed), in order to determine the effect of treatment over time within each winter accommodation period. For the case study, fixed effects were treatment, inspection day and the interaction between the two. Inspection day was the repeated variable. Cow was nested within treatment in year 1, and within treatment and replicate in year 2, and considered a random effect. For the experimental study a similar model was used, but cow was nested within replicate and treatment. In addition, the effect of replicate within treatment was examined. An autoregressive covariance structure (AR(1)) provided the best model fit for both years.
A log to the base 2 transformation of SCC to somatic cell score (SCS) was used to normalize the data distribution. SCSs were analysed separately for each year, using repeated measures ANOVA (Proc Mixed). Fixed effects were treatment, sampling day (lactation week), and the interaction between the two, breed, lactation number (first lactation or greater than first lactation) and whether the cow was milked while on treatment. Lactation week was the repeated variable. Cow was nested within treatment in year 1, and within replicate and treatment in year 2, and was considered a random effect. An autoregressive covariance structure (AR(1)) provided the best model fit.
Differences in least squares means in all models were investigated using the t-test following Tukeys adjustment for multiple comparisons. Model fit was determined in all analyses by choosing models with the minimum finite-sample-corrected Akaike Information Criteria.
Quarter sample data and incidence of CM were analysed using generalised-estimating equations (GEE) (Proc Genmod), due to the binomial nature of the data. The logit of the probability that a cow exhibited CM during the experimental period and subsequent lactation, had an IMI at a QMS inspection, or had sub-clinical mastitis at any of the quarter sampling inspections was investigated, and odds ratios (OR) and 95% CIwere reported. Differences in frequency of isolation of identified pathogens were also investigated in this way. Cow was included as a repeated effect. Each dependent variable had a separate model constructed. Treatment and test day were forced into the model as class variables. Parity and breed were also considered class variables and tested for significance and all relevant interactions were also investigated. Significance was based on GEE score.
Results
Environmental measurements
Mean daily rainfall between 26 November 2004 and 18 February 2005 was 2.7 mm (IQR: 0.1 to 3.2 mm). The total amount of rainfall during this period was 226 mm. In year 2, the mean daily rainfall was 2.1 mm (IQR: 0.0 to 2.2 mm), between 22 November 2005 and 30 January 2006, and the total amount was 144 mm. The difference in daily rainfall between the 2 years was not significant (P > 0.1). Mean daily wind speed was higher during year 1 than during year 2 (year 1 = 7.0 ± 0.33 m/s, year 2 = 5.31 ± 0.37 m/s; P < 0.01). There was no effect of year on RH, but there was an effect of treatment and also an interactive effect of treatment and year (P < 0.05). There was no difference between RH in IC (92.3 ± 1.42%) or in CP (91.6 ± 1.60%), but both were higher than UP (82.4 ± 1.42%; P < 0.001). However, RH did not change within individual treatments between year 1 and year 2 (data not shown, P > 0.1). There was no effect of treatment or interactive effect of treatment and year on temperature, but there was an effect of year, the temperature during year 1 (7.6 ± 0.29°C) being higher than during year 2 (6.4 ± 0.29°C; P < 0.01). However, although there was an overall effect of year, there was no significant difference between years within each treatment.
Animal dirtiness
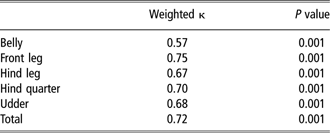
Results on the repeatability of the dirtiness scoring system are shown in Table 2.
Results of weighted Cohen’s κ analysis for intra-observer reliability of the dirtiness scoring system

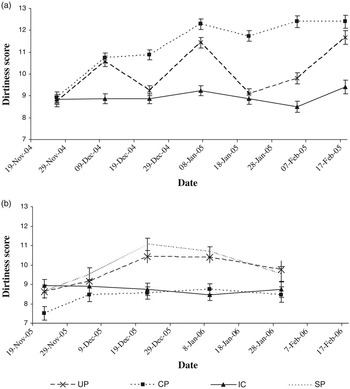
Animal dirtiness scores were recorded 5.8 ± 1.25 (mean ± s.e.) times, and 4.5 ± 0.50 times per cow in years 1 and 2, respectively. There was no difference between treatments at the initial examination in either year (P > 0.1; Figure 1). Dirtiness scores in IC did not change during the housing period in either year (P > 0.1).
Mean cow dirtiness score at each examination date in each treatment during years 1 (a) and 2 (b).

Overall, in year 1, dirtiness scores of cows in both the UP (stocking density 12 m2/head) (10.1 ± 0.18) and CP (stocking density 6 m2/head) (11.3 ± 0.18) treatments were higher than those of cows in IC (8.9 ± 0.18; P < 0.001). However, there were differences between the treatments in the changes over time. Scores recorded in cows on the CP treatment were consistently higher than those in IC (P < 0.001 on all examination dates) (Figure 1a). However, dirtiness scores of cows in UP were similar to those recorded in CP cows prior to the pads being cleaned (20 December and 18 January) but decreased to levels similar to those recorded in the IC treatment after the pads were cleaned (Figure 1a). In contrast, dirtiness scores of cows in CP did not decrease after cleaning, but cleaning caused them to increase at a slower rate, as evidenced by the absence of a difference in animal dirtiness scores between 10 and 23 December 2004, 7 and 21 January 2005 or 4 and 18 February 2005.
During year 2, cows in the CP and IC treatments had the lowest dirtiness scores (8.3 ± 0.27, 8.8 ± 0.28; P > 0.1). Cows on SP and UP had the highest scores (9.8 ± 0.27, 9.7 ± 0.28; P > 0.1). The difference between SP and both CP and IC was significant (P = 0.001, P < 0.05, respectively), as was the difference between CP and UP (P < 0.01). Furthermore, cows in IC tended to have lower scores than those in UP (P = 0.1).
Cows in CP had scores similar to cows in IC on all examination dates (P > 0.1), and there was no change in dirtiness scores of animals in these treatments throughout the housing period (P > 0.1, Figure 1b). In contrast, dirtiness scores of cows in UP and SP increased after the initial examination date (P < 0.05), until after the OWPs were cleaned on 20 January 2005 when dirtiness score decreased.
Somatic cell scores
During both years several lactation weeks were poorly represented by samples. In years 1 and 2, samples taken from cows that were more than 37 and 41 weeks into lactation, respectively, were removed from the analysis. In year 1, lactation weeks 1 and 2, and in year 2 lactation weeks 1, 8 and 10 were removed for the same reason. Thus in the final analysis, there were 20.3 ± 5.08 and 15.4 ± 3.17 samples per cow included from years 1 and 2, respectively.
There was no interactive effect of treatment and lactation week on SCS during either year (P > 0.1). During year 1, there was an effect of treatment on SCS (P < 0.05). Cows on CP had a higher SCS (16.2 ± 0.13) than IC cows (15.7 ± 0.13; P < 0.05). However, there was no difference between UP (16.0 ± 0.13) and either of the other treatments (P > 0.1). During year 2 there was no difference in SCS between any of the treatments (15.5 ± 0.22, 15.0 ± 0.24, 14.9 ± 0.24, 15.6 ± 0.23; IC, UP, SP, CP respectively; P > 0.1).
Clinical mastitis and quarter milk samples
In year 1, cows were dried off in groups (19 ± 11 cows per group) between 19 November 2004 and 16 December 2004 (mean date = 6 December 2004 ± 7.3 days). Four cases of CM (as diagnosed by the stockperson) were recorded in IC, two cases in CP and two in UP during the winter accommodation period. In all, three cases were recorded in IC, nine in CP and seven in UP post calving. However, treatment did not affect the proportion of animals that developed CM (P > 0.1, data not shown).
There was no difference in the proportion of animals from each treatment diagnosed with sub-clinical mastitis at any of the quarter sampling test dates (P > 0.1, data not shown). However, there was an effect of test day (P < 0.001). The proportion of animals that had at least one quarter affected with sub-clinical mastitis at drying off, calving and the 3 weeks post calving test was 84%, 55% and 46%, respectively. The odds of an animal having at least one affected quarter was lower at calving than at drying off (OR = 0.25, CI = 0.12 to 0.52, P < 0.001), and at 3 weeks post calving than at drying off (OR = 0.17, CI = 0.09 to 0.35, P < 0.001).
Treatment tended to have an effect on the proportion of animals that had an IMI (P = 0.08), with a higher proportion in CP than UP (OR = 2.0, CI = 0.99 to 4.04; P = 0.05). There also tended to be fewer cows in UP that had an IMI than in IC (OR = 0.5, CI = 0.23 to 1.04; P = 0.06). There was an effect of test day (P < 0.05), with a higher proportion of animals having an IMI isolated 3 weeks post calving than at drying off (OR = 1.95, CI = 1.10 to 3.49; P < 0.05). In these cases IMI refers to an intramammary infection associated with either contagious or environmental bacteria, or both.
One cow each from UP and CP had Streptococcus dysgalactiae, and one cow from IC had Actinomyces pyogenes isolated from a quarter sample at calving. There was no effect of treatment on the number of Streptococcus uberis isolates identified. These organisms are all environmental pathogens. The other two pathogens that were isolated over the course of the experiment were Staphylococcus aureus and non-haemolytic staphlococci, both of which are contagious mastitis-causing agents. There was no effect of treatment on the frequency that these pathogens were isolated. At drying off, S. aureus was identified in a quarter sample from seven cows from UP and IC and five cows from CP. At calving, this pathogen was isolated from six cows from UP and CP and 12 cows from IC. There was an effect of test day (P < 0.01), and at the extra examination all treatments had more S. aureus-infected milk samples than at drying off (OR = 2.18, CI = 1.23 to 3.85; P < 0.01). There was no effect of test day on the frequency of isolation of non-haemolytic staphlococci.
In year 2 animals were dried off on 17 November 2005. There was only one case of CM during the winter accommodation period, and this occurred in SP. During lactation there were 10 animals that had at least one instance of CM in CP, eight in IC, seven in UP and five in SP, but no treatment effect (P > 0.1).
There was no difference in the proportion of animals in each treatment diagnosed with SCM at drying off, at calving, 3 weeks post calving or on 14 June 2006 (P > 0.1, data not shown). However, there was an effect of time. The herd percentage of animals having at least one quarter affected at drying off, calving 3 weeks post calving and on 14 June was 64%, 57%, 32% and 25%, respectively. There was no difference between drying off and calving, but at both of the subsequent examinations there were fewer animals with sub-clinical mastitis than at drying off (P < 0.001). There was no effect of treatment or inspection on the proportion of animals that had IMI (P > 0.1 in all cases, data not shown).
One cow each from SP and CP had S. uberis and Escherichia coli (environmental pathogens) isolated from a quarter sample at calving. As in year 1, two other pathogens were isolated, S. aureus and non-haemolytic staphlococci. There was no effect of treatment on the frequency that these pathogens were isolated. At drying off, S. aureus was identified in a quarter sample from one cow from UP and IC, two cows from SP and three cows from CP. At calving, this pathogen was isolated from two cows from UP and IC and from one cow from SP and CP. However, there was an effect of test day (P < 0.001), and at the extra examination all treatments had more S. aureus-infected milk samples than at drying off (OR = 3.41, CI = 1.16 to 10.00; P < 0.05). More cows had S. aureus isolated from at least one quarter on 14 June (P < 0.01) than at drying off (OR = 3.72, CI = 1.38 to 10.05). There was no effect of test day on the frequency of isolation of non-haemolytic staphlococci.
Discussion
The dirtiness scoring system used in this experiment was developed in order to facilitate rapid assessment of the hygiene of unrestrained cows. As a κ value of greater than 0.7 is highly acceptable (Sim and Wright, Reference Sim and Wright2005), the system was considered sensitive and reliable enough to detect treatment differences.
Animal dirtiness scores in the cubicle house and in the uncovered OWP with the concrete feed area were similar in both the case study and the experimental study. Although ambient temperatures were lower in year 2 compared with year 1, there was no difference between years in both temperature and RH within any treatment. Thus environmental conditions were consistent enough not to have altered the lying behaviour (Overton et al., Reference Overton, Sischo, Temple and Moore2002). This could have impacted the dirtiness score by affecting the contact time between the animal’s coat and the woodchip.
During the experimental study, cows that had shelter on the OWP were cleaner than those in the two unsheltered OWP designs. Moreover, dirtiness scores of cows that were sheltered from the weather did not change significantly during the accommodation period regardless of whether they were indoors in cubicles or outdoors on a covered OWP. In contrast, dirtiness scores of cows on both unsheltered OWPs increased after the initial inspection and were higher than at the beginning of the trial at all but the last inspection, which was just after the OWP’s were cleaned. Hickey et al. (Reference Hickey, French and Grant2002) found no effect of shelter on animal hygiene, but cattle in that experiment were only sheltered by windbreaks and not overhead. Our results suggest that the amount of environmental moisture on the OWP (represented by daily rainfall) had the greatest impact on animal and bedding hygiene. Indeed, moist manure is more likely to adhere to an animals’ coat. In comparison to the uncovered OWP where cows were fed from a concrete feed face, the feeding area of the uncovered OWP with the SP was much dirtier, as it was not possible to remove soiled material on a regular basis. Nevertheless, there was no difference in animal dirtiness scores between both uncovered pad designs. This is probably due to cows in the self-feed system selecting areas away from silage to lie down.
During the case study, animals that were confined on the covered OWP had much higher dirtiness scores than cows in the cubicle house. However, there was no difference between these treatments during the experimental study. This can be explained by the fact that during the experimental study the stocking density in the covered OWP was much lower than during the case study. At high stocking densities there is a greater manure load per area of woodchip than at low stocking densities. Previous work with OWP systems for beef cattle also reported that animal hygiene score was reduced as stocking density increased (Hickey et al., Reference Hickey, French and Grant2002). Although that study found no health or welfare concerns for beef animals at the high stocking density, the potential for dairy cow welfare to be compromised is greater at high stocking densities, as compromised udder health is one of the main health problems of dairy cows (Grohn et al., Reference Grohn, Gonzalez, Wilson, Hertl, Bennett, Schulte and Schukken2005). Indeed, intramammary environmental pathogens are significantly associated with udder hygiene scores (Schreiner and Ruegg, Reference Schreiner and Ruegg2003). Hence it is not surprising that the high dirtiness scores of animals confined at the high stocking density in the covered OWP in the case study was reflected in a higher tendency for mastitis-causing agents to be isolated, and higher lactation SCC in these animals. In contrast, the lower stocking density in this OWP design during the experimental study resulted in good animal hygiene and similar udder health status to the other treatments.
In both years of the experiment, there was an increase in the number of cows with S. aureus isolated from at least one quarter sample at the post-calving examinations. This pathogen is contagious, as opposed to environmental, and is transmitted mainly at milking time (Harmon, Reference Harmon1994). This explains the rise post calving, and is not a reflection of poor hygiene during the winter confinement period.
After the OWP’s were cleaned and fresh woodchips applied, the dirtiness scores of cows confined to the two unsheltered OWP treatments decreased to a level similar to those recorded in cows confined indoors in cubicles. This could be an important management application, as movement of dirty animals to clean accommodation prior to calving can improve animal hygiene and reduce the risk of IMI during the subsequent lactation. However, in the case study, dirtiness score of animals confined at the higher stocking density did not decrease to the level of the animals indoors after cleaning of the OWP’s. This could have been because the woodchips became dirty again before the animals’ coats had a chance to become clean. Hourihan (Reference Hourihan2006) showed that animal dirtiness scores increased as OWP dirtiness score increased. The results from the case study indicate that 6 m2 per animal is too high for dry cows on OWP’s to maintain acceptable hygiene levels.
Results from both studies indicate that dairy cow hygiene on OWP’s is affected by both stocking density and shelter. However, it was only during the case study that animals confined in the covered OWP at a high stocking density developed more udder health problems, than animals kept in traditional indoor cubicle housing. Further investigation is warranted in order to determine the optimum stocking density. Although animals on uncovered OWP’s had higher dirtiness scores than cows indoors, this did not affect SCS or mastitis incidence post calving during either study. Therefore management of these OWP’s was sufficient so that milk quality and animal health were not compromised. Although further work is necessary to elucidate specific interactions between animal hygiene during the dry period and udder health, these findings have important implications for the management of dry cows on OWP’s.
Acknowledgements
The authors would like to thank Frank Buckley and Noel Byrne for their technical assistance and the Ballydague farm staff for their care of the experimental animals during the study. They especially thank Jane Hourihan for her help in data collection and technical advice on animal dirtiness scoring.