Implications
Survival analysis was applied for genetic analysis of ovulatory disorders in Austrian Fleckvieh cows. This method has theoretical advantages compared with the linear model because culled cows are considered more correctly. By comparing heritability estimates and ranking of sires, survival analysis gave similar results to the linear model approach.
Introduction
In Austria, a nation-wide health monitoring system for cattle was started in 2006 in which diagnoses from veterinarians are recorded (Egger-Danner et al., Reference Egger-Danner, Fuerst-Waltl, Holzhacker, Janacek, Lederer, Litzllachner, Mader, Mayerhofer, Miesenberger, Obritzhauser, Schoder and Wagner2007). The main objectives are to provide support for herd management and the prediction of breeding values for health traits.
So far, health traits are only routinely evaluated in the Scandinavian countries based on linear models (Interbull, 2010). For genetic evaluation, health traits are defined as binary traits, based on whether the cow had at least one veterinary treatment within a defined period of the lactation. To avoid possible bias due to culling of cows, often only records from early lactation (to 150 days after calving) are considered. However, some cows are culled very early in lactation. Culled cows did not have an equal risk of contracting the disease, because of a shorter period of exposure to the disease than cows with completed records. This can be expected to lead to biased prediction of breeding values in genetic evaluations; especially, sires that have a larger proportion of culled cows will be favored. Moreover, it would be desirable to include information about veterinary treatments that occur later in lactation. Survival analysis would be an alternative to overcome this problem, where time to first veterinary treatment or censoring is analyzed.
Genetic studies applying survival analysis for analysis of health traits are limited so far. Carlén et al. (Reference Carlén, Schneider and Strandberg2005) and Sæbø et al. (Reference Sæbø, Almøy, Heringstad, Klemetsdal and Aastveit2005) analyzed time to first mastitis treatment, whereas Hirst et al. (Reference Hirst, Murray, Ward and French2002) studied time to occurrence of lameness in dairy cattle.
The objectives of this study were to estimate heritabilities for ovulatory disorders by using linear models and survival analysis for two different time periods: from calving to 150 days after calving and from calving to 300 days after calving. Further, the impact of the methodology and length of time period on sire rankings for ovulatory disorders were evaluated.
Material and methods
Data
Health data from Fleckvieh cows were obtained from the Austrian project ‘Health monitoring in cattle’ in which diagnoses from veterinarians have been recorded since July 2006 (Egger-Danner et al., Reference Egger-Danner, Fuerst-Waltl, Holzhacker, Janacek, Lederer, Litzllachner, Mader, Mayerhofer, Miesenberger, Obritzhauser, Schoder and Wagner2007). Recording of health data on farms is currently voluntary. By February 2010, 54% of farmers participated of which 66% recorded health data (Egger-Danner et al., Reference Egger-Danner, Fuerst-Waltl, Obritzhauser, Koeck, Grassauer, Janacek, Litzllachner, Mayerhofer, Miesenberger, Schallerl, Schoder and Wagner2010). To ensure that all cows were from herds actively participating in the health-recording system, only herds with at least one recorded diagnosis (any disease) per 10 cows and year were considered. In addition, records from veterinarians with <500 diagnoses were removed.
Records from the first five lactations of Austrian Fleckvieh cows calving between 1 January 2007 and 3 February 2009 were included in this study. Age at first calving was restricted between 19 and 43 months and records of animals with a calving interval shorter than 300 days or longer than 800 days were excluded. Only one record per cow was considered (the first), irrespective of parity. The data set was further restricted to include only sires with at least 20 daughters, and herd–year–season classes had to contain at least three calving cows. After edits, the final data set included a total of 23 450 cows from 1944 herds.
The sire pedigree file had information on sires and maternal grandsires of the 274 bulls with daughters in the data set, traced back over seven generations. The resulting pedigree file contained 1037 males.
Trait definitions
Ovulatory disorders included veterinary treatments of silent heat/anestrus and cystic ovaries. A more general disease definition leads to higher frequencies and to a better data structure. Moreover, in a preceding study in Austrian Fleckvieh cows it was found that silent heat/anestrus and cystic ovaries seem to share some of the same genetic background (Koeck et al., Reference Koeck, Egger-Danner, Fuerst, Obritzhauser and Fuerst-Waltl2010).
Ovulatory disorders were analyzed in two time periods, either from calving to 150 days after calving or from calving to 300 days after calving.
For linear model analyses, ovulatory disorders were defined as a binary response based on whether the cow had at least one veterinary treatment in the time periods from calving to 150 days after calving and from calving to 300 days after calving. Culled cows were considered as healthy if they had no treatment for an ovulatory disorder.
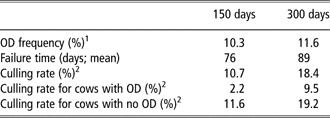
For survival analysis, a cow with a veterinary treatment for an ovulatory disorder was considered as uncensored, and failure time (time to first ovulatory disorder) was defined as the number of days from calving to the day of the first treatment for an ovulatory disorder. For a healthy cow, the observation was considered as right censored. For these cows, time was defined as the number of days from calving until (i) the day of culling or (ii) the last day of the time period analyzed (150 or 300 days after calving). Summary statistics are given in Table 1.
Summary statistic of ODs for time periods ending at 150 and 300 days after calving

OD = ovulatory disorders.
1Percentage of cows with at least one record of veterinary treatment of ODs in the period from calving to 150 days after calving and from calving to 300 days after calving.
2Culling rate = percentage of cows culled before the end of the period.
Statistical models
The linear sire model for each ovulatory disorder trait was:

where yijklm is the observation for ovulatory disorder trait (0 = healthy, 1 = diseased); AGEi is the fixed effect of age at calving–parity (i = 1,2,…,11); YSj is the fixed effect of year–season of calving (j = 1,2,…,9); hysk is a random effect for herd–year–season of calving (k = 1,2,…,5262);  is a random effect for sire (l = 1,2,…,1037); and eijklm is the random residual effect.
Four calving age classes were formed for each of the first two parities. Age at first calving was grouped into <27, 27 to 28, 29 to 30 and >30 months and age at second calving was classified into <40, 40 to 41, 42 to 44 and >44 months. For older cows, age–parity classes were parities 3, 4 and 5. Seasons were January to March, April to June, July to September and October to December.
Variance components were estimated using the AI-REML algorithm in the DMU package (Madsen and Jensen, Reference Madsen and Jensen2008).
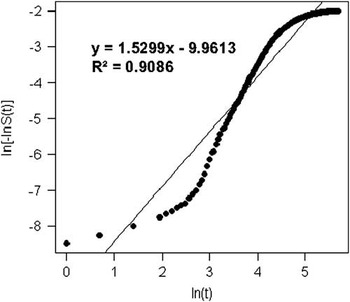
As a preliminary analysis for survival analysis, a Cox proportional hazard model was run, and the survivor function was estimated by the Kaplan–Meier method. The ln[-ln(Kaplan–Meier estimate)] was plotted against the natural logarithm of time to check whether data followed a Weibull distribution. If the Weibull assumption holds, a straight line should be obtained. As shown in Figure 1, the resulting relationship was not linear for the entire period. Thus, a semi-parametric Cox model was applied, which does not make any assumption about the distribution form of the baseline hazard. The following proportional hazard frailty model was used for the analysis of time to first ovulatory disorder:

where  is the hazard of a cow getting an ovulatory disorder;
 is the baseline hazard function. The other effects, all time independent, are as described above for linear model analysis. Effects of herd–year–season were assumed to follow a log-γ distribution. Sire effects were assumed to follow a multivariate normal distribution.
Graphical test of the Weibull assumption: linear regression of ln[-lnS(t)] on ln(t). S(t) = Kaplan–Meier estimates of the survivor function at time t ending at 300 days after calving.

Survival analysis was carried out using the ‘Survival Kit’ software, version 6.0 (Ducrocq et al., Reference Ducrocq, Sölkner and Mészáros2010).
Heritability estimates
For the linear sire model, the heritability was calculated as
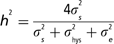
where  and
 are the estimated sire, herd–year–season and residual variances, respectively.
According to Yazdi et al. (Reference Yazdi, Visscher, Ducrocq and Thompson2002), the equivalent heritability ( ) for the survival analysis was defined as
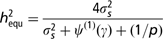
where  is the sire variance,
 is the tri-γ function, γ is the log-γ parameter of the distribution of herd–year–season effects and p is the proportion of uncensored records. This heritability expression can be used to compute progeny test reliabilities accounting for the incidence of the disease. It allows proper comparisons between heritabilities in linear and survival models.
Results and discussion
As shown in Table 1, the frequency of ovulatory disorders was 10.3% during the first 150 days of lactation with a mean failure time of 76 days. Observing the full lactation (from calving to 300 days after calving), the average frequency of ovulatory disorders increased slightly to 11.6%. The mean failure time was 89 days. Pösö and Mäntysaari (Reference Pösö and Mäntysaari1996) found similar frequencies for ovulatory disorders of 10.2%, 10.6% and 11.9% in first, second and third lactation Finnish Ayrshire cows, respectively. In contrast, Heringstad (Reference Heringstad2010) reported much lower frequencies of 0.5% and 3.1% for cystic ovaries and silent heat, respectively, in first lactation Norwegian Red cows.
For both time periods, the culling rate was lower for cows with an ovulatory disorder than for cows categorized as healthy (Table 1). It seems that the diagnosis of ovulatory disorders has a protective effect against culling. In addition, Rajala-Schultz and Gröhn (Reference Rajala-Schultz and Gröhn1999) found that cows with a veterinary treatment for anestrus or ovarian cysts were at lower risk of being culled, especially during the stage when the disorder was diagnosed. This is also reasonable, as farmers want to keep these cows. Cows that are already planned to be culled will not be treated.
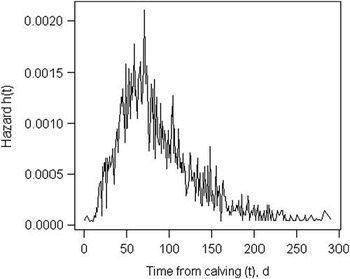
The observed hazard function derived from the Kaplan–Meier survivor curve is presented in Figure 2. The hazard of a veterinary treatment for ovulatory disorders was almost zero during the first 2 weeks after calving. Then, the hazard strongly increased during the next 8 weeks until it reached a maximum at 70 days. After a decrease for further 14 weeks, it stayed at a very low level after 170 days.
Observed hazard function (derived from the Kaplan–Meier estimate of the survivor curve) of cows from calving to first ovulatory disorder.

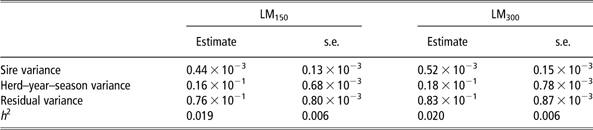
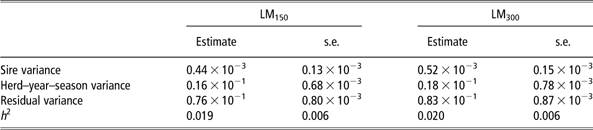
Estimates of variance components and heritabilities for ovulatory disorders from the linear model analyses are given in Table 2. Heritability estimates were 0.019 and 0.020 for time periods ending at 150 and 300 days after calving, respectively. These estimates are in agreement with previous studies. Pösö and Mäntysaari (Reference Pösö and Mäntysaari1996) and Koeck et al. (Reference Koeck, Egger-Danner, Fuerst, Obritzhauser and Fuerst-Waltl2010) reported heritability estimates in the range from 0.01 to 0.04 for fertility disorders using linear models.
Estimated variance components, heritability (h 2) and s.e. for ovulatory disorders from linear models for periods ending at 150 and 300 days after calving (LM150 and LM300, respectively)
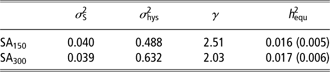
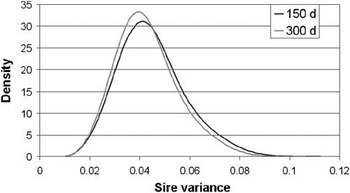
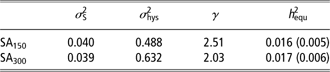
The corresponding results from the survival analysis are presented in Table 3. For time to first ovulatory disorder, heritabilities of 0.016 and 0.017 were estimated for time periods ending at 150 and 300 days after calving, respectively. As the proportions of uncensored records are accounted for in the heritability calculations, these estimates can be compared directly with the results from the linear model analyses. The marginal posterior distributions of the genetic variance are shown in Figure 3. For both traits, the approximate posterior densities of the sire variance were slightly skewed to the right. Other genetic studies applying survival analysis for fertility disorders were not available in the literature.
Estimated sire variance (σ 2S), herd–year–season variance (σ 2hys), parameter of the log-γ distribution of herd–year–season effects (γ) and equivalent heritability (h 2equ, s.d.) for ovulatory disorders from survival analysis for periods ending at 150 and 300 days after calving (SA150, SA300, respectively)
Gram–Charlier approximation of the marginal posterior density of the sire variance for ovulatory disorders for periods ending at 150 and 300 days after calving, respectively.

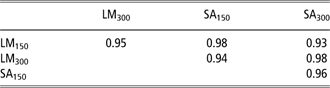
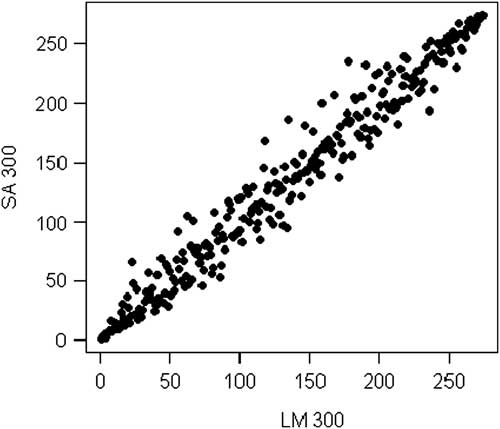
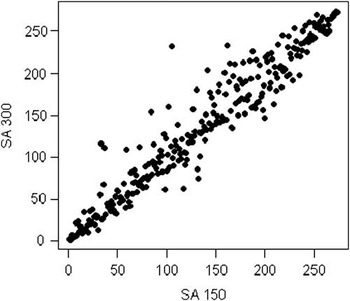
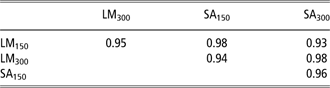
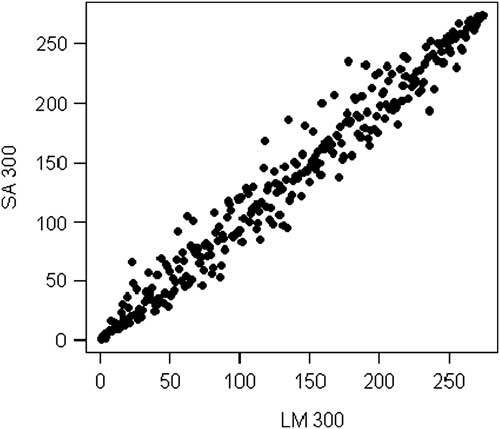
Table 4 shows rank correlations between sire evaluations from the different models (linear v. survival) and periods (150 v. 300 days). The correlations between sire estimated breeding value (EBV) obtained with linear model and survival analysis were 0.98, whereas correlations between different time periods were lower (0.95 and 0.96). As shown in Figure 4 for the period ending at 300 days after calving, linear models and survival analysis gave a similar ranking of sires. Changes in sire rankings due to the use of different periods were larger, especially at intermediate rank positions (Figure 5). These results show that length of time period has a larger effect on sire evaluations than the method used. In Swedish Holstein cows, Carlén et al. (Reference Carlén, Schneider and Strandberg2005) also compared ranking of sires obtained with survival analysis and linear models for genetic evaluation of clinical mastitis. Correlations between EBV were 0.93, 0.89 and 0.88 for first, second and third lactation cows, respectively. However, the results were not fully comparable as different length of time periods were considered for the linear model and survival analysis. In a following simulation study by Carlén et al. (Reference Carlén, Emanuelson and Strandberg2006), only little differences were observed between linear model and survival analysis for genetic evaluation of mastitis. Correlations between sire true breeding values for mastitis liability and predicted sire breeding values from linear models and survival analysis were all above 0.99 within the observation period, irrespective of progeny group size.
Rank (Spearman) correlations between random effects of sires (n = 274) for ovulatory disorders from linear models (LM150 and LM300) and survival analysis (SA150 and SA300) for periods ending at 150 and 300 days after calving
Plot of ranked sire solutions for ovulatory disorders from linear model (LM300)and survival analysis for the period ending at 300 days (SA300).
Plot of ranked sire solutions for ovulatory disorders from survival analysis for periods ending at 150 and 300 days after calving (SA150 and SA300, respectively).

Conclusions
Although in survival analysis-culled cows are treated properly, which reduces potential bias, sire rankings between linear models and survival analysis were highly correlated. Larger differences in sire rankings were observed by comparing different periods (150 or 300 days). The advantage of using only records up to 150 days of lactation is that breeding values would be available earlier. Moreover, the restricted period captured nearly 90% of all veterinary treatments for ovulatory disorders. Thus, for routine genetic evaluation a linear model using records up to 150 days of lactation would be sufficient.
Acknowledgements
The collaborative work of the project partners in Austria (Federation of Austrian Cattle Breeders including its member organizations of performance recording and breeding (Vienna, Austria), University of Natural Resources and Applied Life Sciences (Vienna, Austria), University of Veterinary Medicine (Vienna, Austria), Chamber of Agriculture (Vienna, Austria), Chamber of Veterinaries (Vienna, Austria), Coordination office of Animal Health Organizations (St. Pölten, Austria)) to establish a ‘Health monitoring system in cattle’ and all dairy farmers and veterinarians participating are gratefully acknowledged. This study was financed by the Austrian Federal Ministry of Agriculture, Forestry, Environment and Water Management (Vienna, Austria) and the Federation of Austrian Cattle Breeders (Vienna, Austria). Birgit Fuerst-Waltl and Gabor Mészáros were supported by the Austrian Science Fund (Vienna, Austria; Elise-Richter Program V43-B12 and P20552-B17).