Introduction
Chalcopyrite materials have attracted special attention in the field of opto-electronic applications due to their abundance, and low toxicity composition compared with other semiconducting materials. Semiconducting bulk chalcopyrite, CuFeS2, exhibits an indirect band gap of ~0.5–0.6 eV and tetragonal crystal structure,[Reference Kambara1] in which Cu and Fe ions bond tetrahedrally with sulfur (S).[Reference Conejeros, Alemany, Llunell, Moreira, Sánchez and Llanos2] Recent publications indicate that this chalcopyrite is promising for thermoelectric applications due primarily to low resistivity and thermal conductivity.[Reference Liang, Ma, Jiao, Pang and Feng3, Reference Li, Tan and Li4] Additionally, these narrow gap semiconductors are suitable for the development of counter electrodes,[Reference Wu, Zhou, Yang, Liao, Zhang and Li5] infrared (IR) detectors, and light-to-heat converters.[Reference Ghosh, Avellini, Petrelli, Kriegel, Gaspari, Almeida, Bertoni, Cavalli, Scotognella, Pellegrino and Manna6] Colloidal nanocrystals (NCs) of the CuFeS2 chalcopyrite materials are being investigated to exploit their unique properties such as quantum confinement, solution-processability, and facile synthesis methods. However, development and application of ternary and quaternary colloidal NCs have been challenging due to the required control over phase purity and the stability of the synthesized NC materials.[Reference Aldakov, Lefrancois and Reiss7] To make the material more device applicable, research has demonstrated various techniques for the fabrication of CuFeS2 chalcopyrite.
The common solution-based syntheses employed to prepare CuFeS2 chalcopyrite nanostructures are solvothermal[Reference Wang, Wang, Yue, Wang, Yan and Peng8] and hydrothermal[Reference Silvester, Healy, Grieser and Sexton9] methods. In addition, a mechanical alloying preparation method has also been reported for CuFeS2 materials.[Reference Li, Tan and Li4, Reference Pradhan, Ghosh and Samanta10] Wang et al. have synthesized shape-controlled CuFeS2 NCs with spherical and pyramidal morphology using a solution-based method, and have reported blue shifting features within the absorption spectrum for quantum-confined spherical CuFeS2 NCs as compared with their bulk counterpart.[Reference Wang, Bao and Gupta11] Kumar et al. have reported solution-based single step synthesis of polymorphs of CuFeS2 NCs using Cu(I) thiourea complex with Fe2(SO4)3 and FeCl3 separately in ethylene glycol,[Reference Kumar, Uma and Nagarajan12] however, they have not reported the electronic properties such as resistivity, carrier concentration, or mobility of these CuFeS2 chalcopyrite NCs. Investigation of the electronic properties allows for consideration of appropriate applications of these NCs in opto-electronic devices. Liang et al. have demonstrated that solution-synthesized CuFeS2 material exhibits ~77 times larger thermoelectric figure of merit (ZT) value compared with the bulk CuFeS2 chalcopyrite.[Reference Liang, Ma, Jiao, Pang and Feng3] As an alternative approach, Gabka et al. attempted to synthesize CuFeS2 NCs by injecting S-oleyalmine complex using the hot-injection method, but they were unsuccessful.[Reference Gabka, Bujak, Żukrowski, Zabost, Kotwica, Malinowska, Ostrowski, Wielgus, Lisowski and Sobczak13] Hot-injection is a common route for the synthesis of pure and composition-controlled alloyed iron pyrite NCs.[Reference Bhandari, Roland, Kinner, Cao, Choi, Jeong and Ellingson14, Reference Kinner, Bhandari, Bastola, Monahan, Haugen, Roland, Bigioni and Ellingson15] Very few publications are available pertaining to the hot-injection synthesis of CuFeS2 NCs.[Reference Ghosh, Avellini, Petrelli, Kriegel, Gaspari, Almeida, Bertoni, Cavalli, Scotognella, Pellegrino and Manna6, Reference Bhattacharyya and Pandey16] Previously, Ghosh et al. used only dodecanthiol (DDT) as the S source while Bhattacharyya et al. used DDT together with elemental sulfur powder as the S source.[Reference Ghosh, Avellini, Petrelli, Kriegel, Gaspari, Almeida, Bertoni, Cavalli, Scotognella, Pellegrino and Manna6, Reference Bhattacharyya and Pandey16] It should be noted that DDT is a toxic compound compared with elemental S powder. Another recent publication shows an application of colloidal CuFeS2 NCs as the counter electrodes in dye-sensitized solar cells.[Reference Wu, Zhou, Yang, Liao, Zhang and Li5] However, synthesis of phase pure CuFeS2 NCs using elemental sulfur powder as the S source is difficult due to the low reactivity of elemental S compared with other S sources such as DDT and bis (trimethylsilyl) sulfide ((tms)2S).
Colloidal NCs have wide-ranging applications in opto-electronics including photovoltaic (PV) absorbing layers or contact layers. Previously, solution-processed iron pyrite (FeS2) NC-based thin films have been successfully applied as the hole transport layers (HTLs) in cadmium telluride (CdTe) and perovskite solar cells (PKSCs).[Reference Bhandari, Koirala, Paudel, Khanal, Phillips, Yan, Collins, Heben and Ellingson17–Reference Bastola, Subedi, Bhandari and Ellingson20] The ideal HTLs for CdTe solar cells have high carrier concentration (≥ 1018 cm−3) and deep valence band (VB) level to match with CdTe to reduce overall contact resistance.[Reference Freeouf and Woodall21]
The apparent band gap of bulk chalcopyrite CuFeS2 (~0.6 eV)[Reference Kambara1] is small compared with other chalcopyrite semiconductors such as CuAlS2 (3.5 eV)[Reference Jaffe and Zunger22] and CuGaS2 (2.5 eV)[Reference Jaffe and Zunger22]. The study of opto-electronic properties shows that chalcopyrite CuFeS2 materials exhibit two intermediate bands (assigned as IB I and IB II), predominantly formed by vacant Fe 3d orbitals between the VB and the conduction band (CB).[Reference Ghosh, Avellini, Petrelli, Kriegel, Gaspari, Almeida, Bertoni, Cavalli, Scotognella, Pellegrino and Manna6, Reference Oguchi, Sato and Teranishi23] The mid-gap absorption is strong in the case of CuFeS2 due to the electronic transition from VB to the IB.[Reference Oguchi, Sato and Teranishi23, Reference Hamajima, Kambara, Gondaira and Oguchi24] Experimental studies of the absorption spectra of single crystal and thin film polycrystalline CuFeS2 have revealed three strong absorption bands at approximate photon energies of 1.0 eV (VB to IB I), 2.1 eV (VB to IB II), and 3.2 eV (VB to CB), in accord with theoretical predictions.[Reference Oguchi, Sato and Teranishi23, Reference Hamajima, Kambara, Gondaira and Oguchi24]
The electronic properties of CuFeS2 NCs indicate that these materials could be applied as the HTLs in energy harvesting applications. At the laboratory scale, Cu/Au is commonly used as a standard back contact in CdS/CdTe solar cells.[Reference Janik and Triboulet25] However, an HTL layer is desired in CdTe solar cells to improve transport of the photogenerated holes because CdTe's deep VB edge (~−5.9 eV)[Reference Freeouf and Woodall21] and work function (~5.4–5.7 eV) render an ohmic contact elusive. Instead, a Schottkey barrier forms at the interface between CdTe and Au (work function of Au is ~5.0 eV), and the presence of Cu narrows the barrier to facilitate hole transfer across. Any hole transport material applied to CdTe PV should be earth-abundant and of low toxicity to minimize the environmental impact and cost ($/Watt) of the solar cells, and hence the researchers are investigating the possible applications of earth-abundant materials as HTLs in energy harvesting applications. Further, the researchers have been exploring other materials to replace elemental Cu to prevent potential diffusion and degradation of the solar cells over a long period of time.
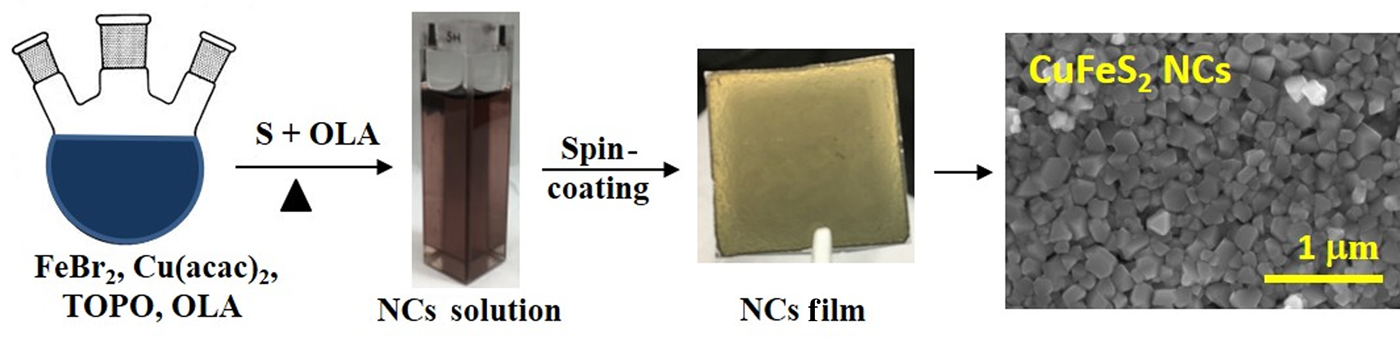
Here, we report the analysis of colloidal CuFeS2 NCs prepared by thermal injection synthesis based on iron (II) bromide (FeBr2), copper (II) acetylacetonate (Cu(acac)2), and elemental S powder (Scheme 1). The synthesized CuFeS2 NCs are characterized by X-ray diffraction (XRD), electron microscopy, Raman spectroscopy, and near IR to ultraviolet spectral range unpolarized transmittance. The CuFeS2 NCs grown by injecting S precursor at 240 °C are phase-pure, exhibiting tetragonal crystal structure in chalcopyrite phase with consistent elemental composition as confirmed by elemental energy dispersive X-ray spectroscopy (EDS) mapping and analysis. The temperature and time-dependence growth of these CuFeS2 NCs have been studied. Three electronic transitions at 0.652, 1.54, and 2.29 eV for CuFeS2 NC films are identified from the complex optical property spectra obtained by analysis of spectroscopic ellipsometry measurements. Additionally, the preliminary test of NC thin films as HTLs in CdTe solar cells shows promising results with the best device efficiency reaching ~12%.
Thiol-free Synthesis and Film Fabrication of Chalcopyrite (CuFeS2) Nanocrystals.

Experimental section
The chalcopyrite (CuFeS2) NCs were synthesized using a modified procedure reported previously for iron dichalcogonides NCs.[Reference Bhandari, Roland, Kinner, Cao, Choi, Jeong and Ellingson14, Reference Bastola, Bhandari, Matthews, Shrestha and Ellingson26] In a typical synthesis, 0.25 mmol (53 mg) iron (II) bromide, 0.25 mmol (65 mg) copper acetylacetonate Cu(acac)2, 3 mmol (1.16 g) TOPO, and 10 mL oleylamine (OLA) were taken in a three-neck flask, evacuated for about 30 min at 120 °C, and then the flask temperature was maintained at 170 °C for about 3 h in nitrogen environment using a standard Schlenk line system. The S precursor was prepared by dissolving 3 mmol (96 mg) elemental S powder in 5 mL OLA with sonication for ~15 min. The S precursor solution was injected into the three-neck flask at an elevated temperature ≥170 °C, and the NCs were grown for a different time under nitrogen environment. The reaction was quenched by removing the heating mantle, and the flask was allowed to cool down to the room temperature. The synthesized NCs were cleaned using standard suspension and precipitation method with chloroform and methanol 3 times. The NCs so obtained were stored in a glove box for further characterization. Further, nanocrystalline thin films were prepared using layer-by-layer drop-casting/spin-coating onto a soda lime glass substrate for characterization. For this, CuFeS2 NC solution was prepared in chloroform at a concentration of ~8 mg/mL. The detail of characterization and photovoltaic device fabrication are included in supporting information (SI).
Results and discussion
Phase analysis and surface morphology
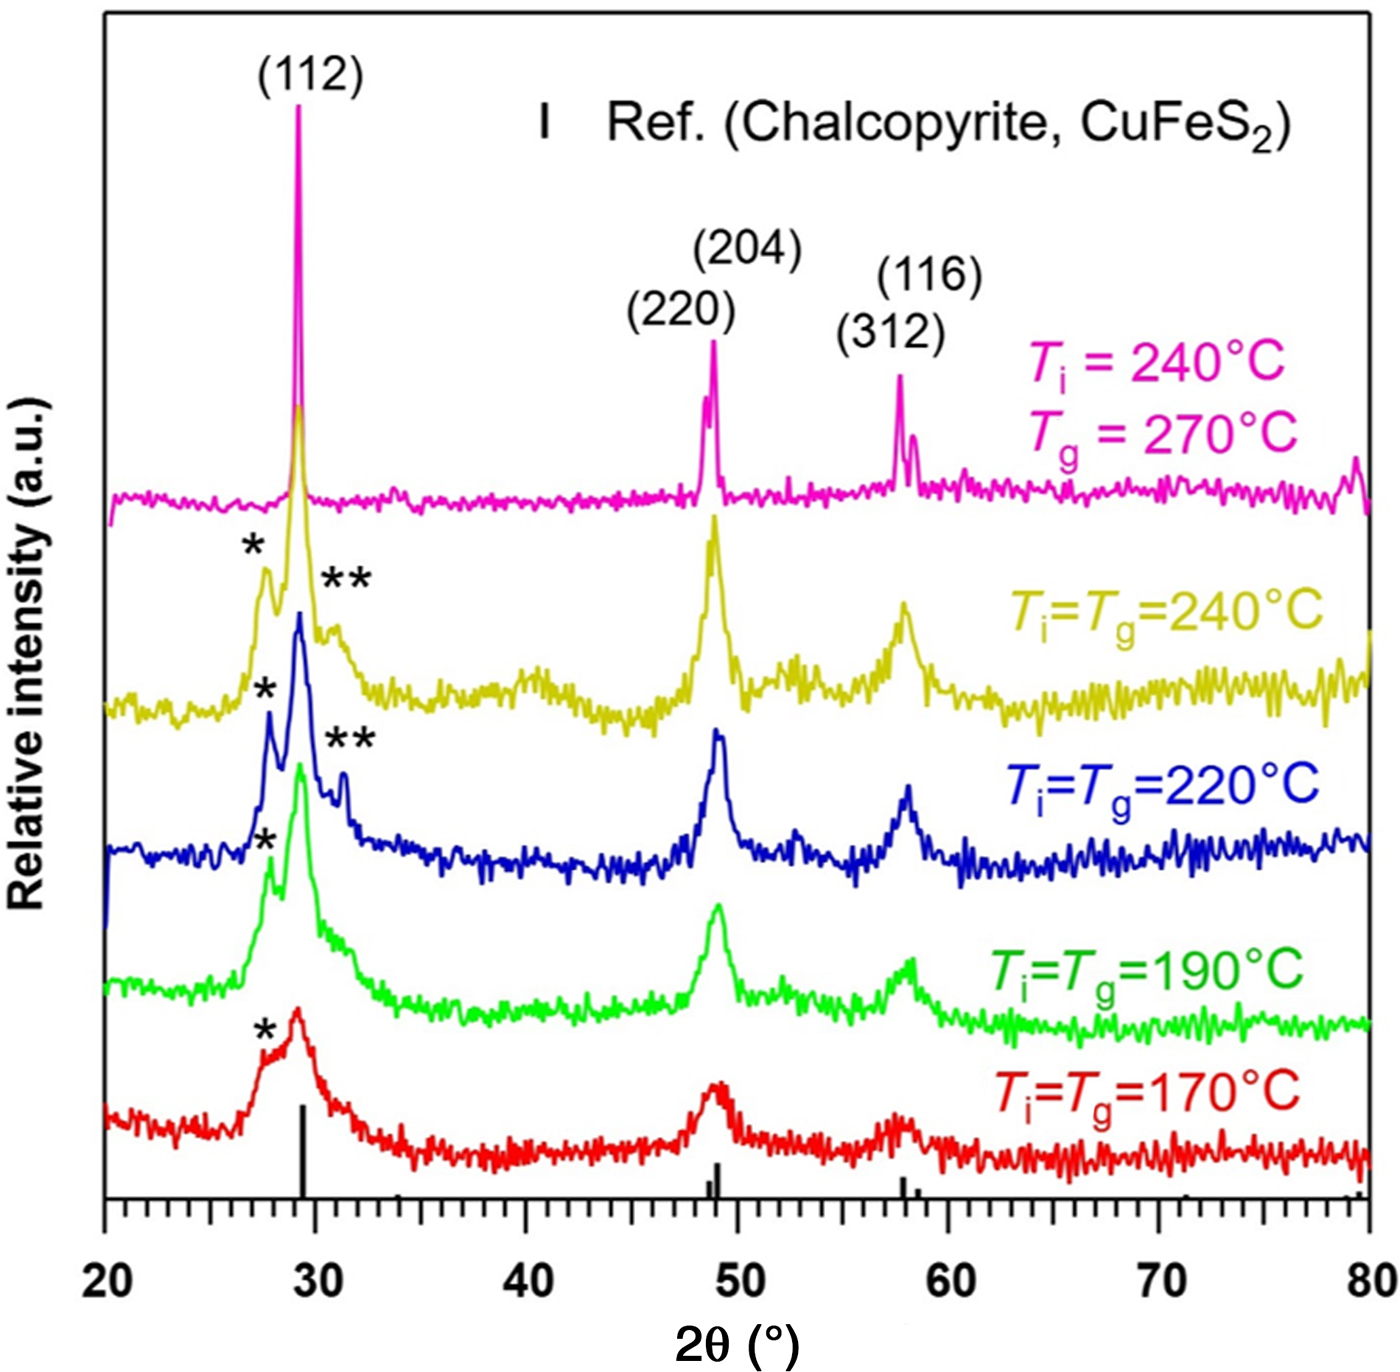
Phase structures of the CuFeS2 NCs were identified from XRD patterns as shown in Fig. 1. Initially, we started growing these NCs using a procedure identical to that used to prepare FeS2 NCs.[Reference Bhandari, Roland, Kinner, Cao, Choi, Jeong and Ellingson14] The S precursor was injected into the reaction flask containing Fe and Cu ions at 220 °C, and the NCs were allowed to grow at the same temperature for about 2 h. The XRD pattern of these NCs revealed additional peaks, marked by * and ** in Fig. 1, attributed to other phase materials in addition to the peaks of CuFeS2. The peak marked by * at 27.7° is assigned to covellite (CuS) particles produced during the synthesis of CuFeS2 NCs. The CuS peak is assigned based on the chemical composition and its diffraction pattern being close to the standard pattern of CuFeS2. Similarly, the peak marked by ** is assigned to mackinawite (FeS) crystallites. The covellite particle has hexagonal crystal structure while mackinawite has a tetragonal crystal structure.[Reference Hosseinpour, Alemi, Khandar, Zhao and Xie27, Reference Xing, Zhang, Cao, Zhao, Wang, Qin, Liu, Jiang and Meng28] The additional XRD peaks such as at 27.7° were observed when the S injection and growth temperatures were ≤240 °C. These additional peaks observed in the XRD pattern prevent the synthesis of phase pure CuFeS2 NCs using elemental S powder. Ultimately, the phase pure CuFeS2 NCs were synthesized when the S precursor was injected at 240 °C, and the NCs were grown at an elevated temperature of 270 °C for about 2 h. As the S precursor was injected at 240 °C, the temperature of reaction solution dropped to ~205 °C, and the temperature was immediately set to growth temperature 270 °C. This S injection and growth temperature produced phase pure NCs based on the XRD pattern which showed no discernible other phases or compositions. This statement regarding the phase purity of the synthesized NCs is supported by the intense and sharp peaks of the XRD pattern of CuFeS2 NCs presented in Fig. 1. These phase pure CuFeS2 NCs belong to tetragonal chalcopyrite phase with the XRD pattern matching exactly with the standard expectation for tetragonal CuFeS2 chalcopyrite material (#PDF 98-000-0156) (space group,  ${\rm I}{\bar 4}$2d) obtained from MDI JADE (Jade™ computer software from Materials Data Inc.). Based on our observation, when the injection and growth temperatures ≤240 °C, it is favorable to the formation of CuFeS2 NCs in addition to some traces of impurities. During the synthesis, the mole fraction for the elemental S powder was 6 times larger than the metal (Cu and Fe) sources which are essential to obtain the phase pure CuFeS2 NCs. This result agrees excellently with the XRD pattern of CuFeS2 material synthesized by solution-based and mechanical alloying method reported previously.[Reference Pradhan, Ghosh and Samanta10–Reference Kumar, Uma and Nagarajan12] In the tetragonal crystal system, the lattice parameters are a = b = 0.5289 nm, c = 0.1042 nm with all the three angles equal to 90°.[Reference Aldakov, Lefrancois and Reiss7]
x-ray diffraction (XRD) patterns of as-synthesized CuFeS2 nanocrystals (NCs) at various injection (T i) and growth (T g) temperatures. The XRD pattern matches well with the standard pattern of chalcopyrite (CuFeS2) obtained from MDI JADE software (#PDF 98-000-0156), confirming this material is tetragonal CuFeS2 chalcopyrite NCs.

The structure of CuFeS2 NCs synthesized by S precursor injection at 240 °C and grown at 270 °C for 5, 10, 15, 30, and 60 min are characterized by XRD patterns shown in Fig. S1. Here, we note that all the synthesis temperatures other than 270 °C were for 2 h. Based on these XRD patterns, NC batches grown longer than 10 min are phase pure tetragonal CuFeS2 NCs. For NCs with a growth time of 5 min, the products include a measurable quantity of covellite (CuS) particles as indicated by the small peak observed at ~27.7°; note that this XRD feature is similar to that observed for NCs in which the S precursor was injected at ≤240 °C. When the S precursor was injected, the reaction mixture temperature dropped to ~205 °C, and this temperature produced traces of covellite CuS in addition to CuFeS2. Based on the literature, 205 °C supports the formation of CuS particles[Reference Hosseinpour, Alemi, Khandar, Zhao and Xie27, Reference Saldanha, Brescia, Prato, Li, Povia, Manna and Lesnyak29] and the reaction mixture took ~5 min to reach 270° C. However, the evolution of the XRD pattern with growth time shows that the diffraction peak at ~27.7° disappeared, within the limit of XRD measurement, indicating that the impure phase particles such as CuS reacted with Fe/S complexes in the excess S environment to form the phase pure ternary CuFeS2 NCs. The crystallite size of the phase pure CuFeS2 material can be estimated using Debye-Scherrer analysis, based on the equation
 $$D_{\rm p} = \displaystyle{{K\lambda } \over {\beta {\rm cos}\theta }},$$
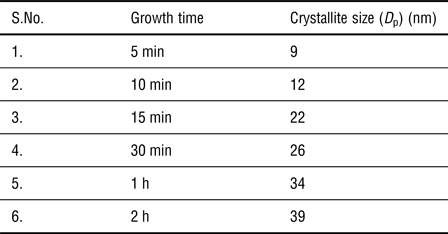
where D p is the crystallite size, K is the shape factor usually taken close to unity, β (in radian) is the broadening at half maximum or full width at half maximum (FWHM), and θ is the Bragg angle.[Reference Langford and Wilson30] Here, the value of K is taken 0.94, and wavelength (λ) is 1.54059 Å for Cu K α lines of the X-ray. The full width at half maxima (β) was calculated using OriginPro software (OriginLab, Northampton, MA) for the (112) Miller index peaks. An XRD broadening of 0.08° was subtracted from FWHM to calculate the crystallite size of the CuFeS2 chalcopyrite NCs. This XRD instrumental broadening for corresponding “2θ” was obtained from JADE software from a calibration profile of standard NIST 640e silicon sample. The crystallite sizes of CuFeS2 NCs obtained from Scherrer analyses is presented in Table I. The calculated value is rounded to the closest whole number in nanometer. These results indicate that the crystallite size of the CuFeS2 NCs depends upon the growth durations after injecting the S precursor during the synthesis.
Crystallite sizes (Scherrer-analysis) of CuFeS2 NCs synthesized with different growth durations.

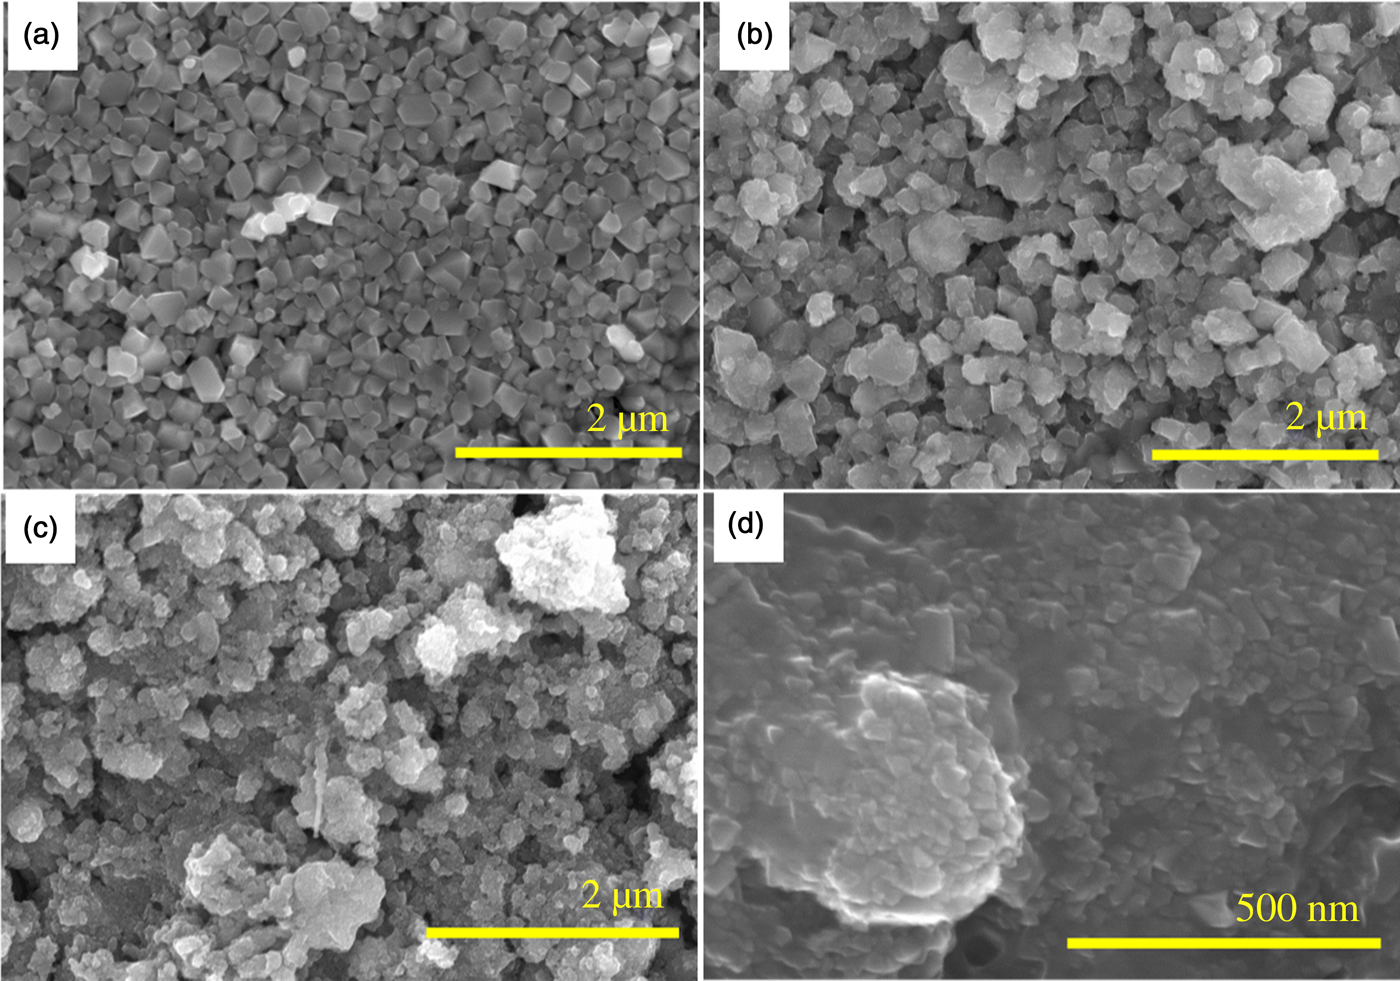
Figure 2 shows SEM results of as-synthesized CuFeS2 chalcopyrite NCs with growth times of 15 min, 30 min, 1 h, and 2 h. The as-synthesized NCs have irregular shapes, unlike most preparations of pyrite FeS2 NCs, which when synthesized by a similar procedure shows a consistent cubic shape.[Reference Bhandari, Roland, Kinner, Cao, Choi, Jeong and Ellingson14] Here, the particle sizes observed by SEM are larger than the crystallite size estimated by Debye-Scherrer equation indicating the crystallites agglomerate to form larger particles. Based on the measured diffractograms, these NC samples all possess tetragonal crystal structure in the chalcopyrite phase. The longest growth time correlates with larger CuFeS2 crystallite size[Reference Wang, Wang, Yue, Wang, Yan and Peng8] with visual evidence of tetragonal shapes with larger facets and longer clean edges as seen in Fig. 2. More SEM results with different resolutions are shown in Fig. S2 (in SI). As shown in Fig. 2, 15 min growth time yields smaller and less fully crystalline NCs than do the longer growth times. However, for 240 °C injection and 270 °C growth temperatures, the phase and compositional purity of the product NCs are not affected over this range of growth time from 15 min to 2 h (Fig. S1). The CuFeS2 NCs synthesized here have relatively larger particle sizes compared to the previous reports. For example, Wang et al. have reported the spherical and pyramidal shaped tetragonal crystal structure CuFeS2 chalcopyrite NCs with average sizes of 12 and 30 nm, respectively.[Reference Wang, Bao and Gupta11] Liang et al. have synthesized smaller CuFeS2 NCs with 6.6 nm average size.[Reference Liang, Ma, Jiao, Pang and Feng3]
Scanning electron micrographs of as-synthesized CuFeS2 chalcopyrite NCs with different growth durations (a) 2 h, (b)1 h, (c) 30 min, and (d) 15 min.

Further, to compare the surface morphology and size of the particles observed in SEM images, STEM images of CuFeS2 NCs prepared for two growth time (30 min and 1 h) were also obtained as shown in Fig. S3. The size of the CuFeS2 NCs prepared for a growth time of 30 min is ~20 nm, slightly smaller than crystallite sizes obtained from Scherrer analysis. Similarly, the average particle size prepared for 1 h growth time is ~50 nm. EDS and elemental mapping were used to determine the chemical composition as a function of growth time. EDS confirmed the presence of Cu, Fe, and S atoms in the NCs. The atomic percentages of different elements as a function of growth time are shown in Table SI. Elemental mapping for the 1 h grown CuFeS2 NC sample is shown in Fig. S4 and corresponding EDS data as a function of growth duration are in Fig. S5. From these results, CuFeS2 NCs are found to have slightly higher Cu concentration compared with Fe. The atomic ratio of Cu:Fe:S is close to 1:1:2 indicating tetragonal CuFeS2 chalcopyrite NCs (Table SI), and it agrees with previous results (Cu:Fe:S = 1:0.83:1.96) reported by Wu et al.[Reference Wu, Zhou, Yang, Liao, Zhang and Li5] In case of 30 min growth sample (T i = 240 °C, T g = 270 °C), the number of Cu and Fe atoms are relatively close (Table SI) to each other although all the NCs were prepared using an identical procedure except the growth time.
Unpolarized transmittance and Raman spectroscopy
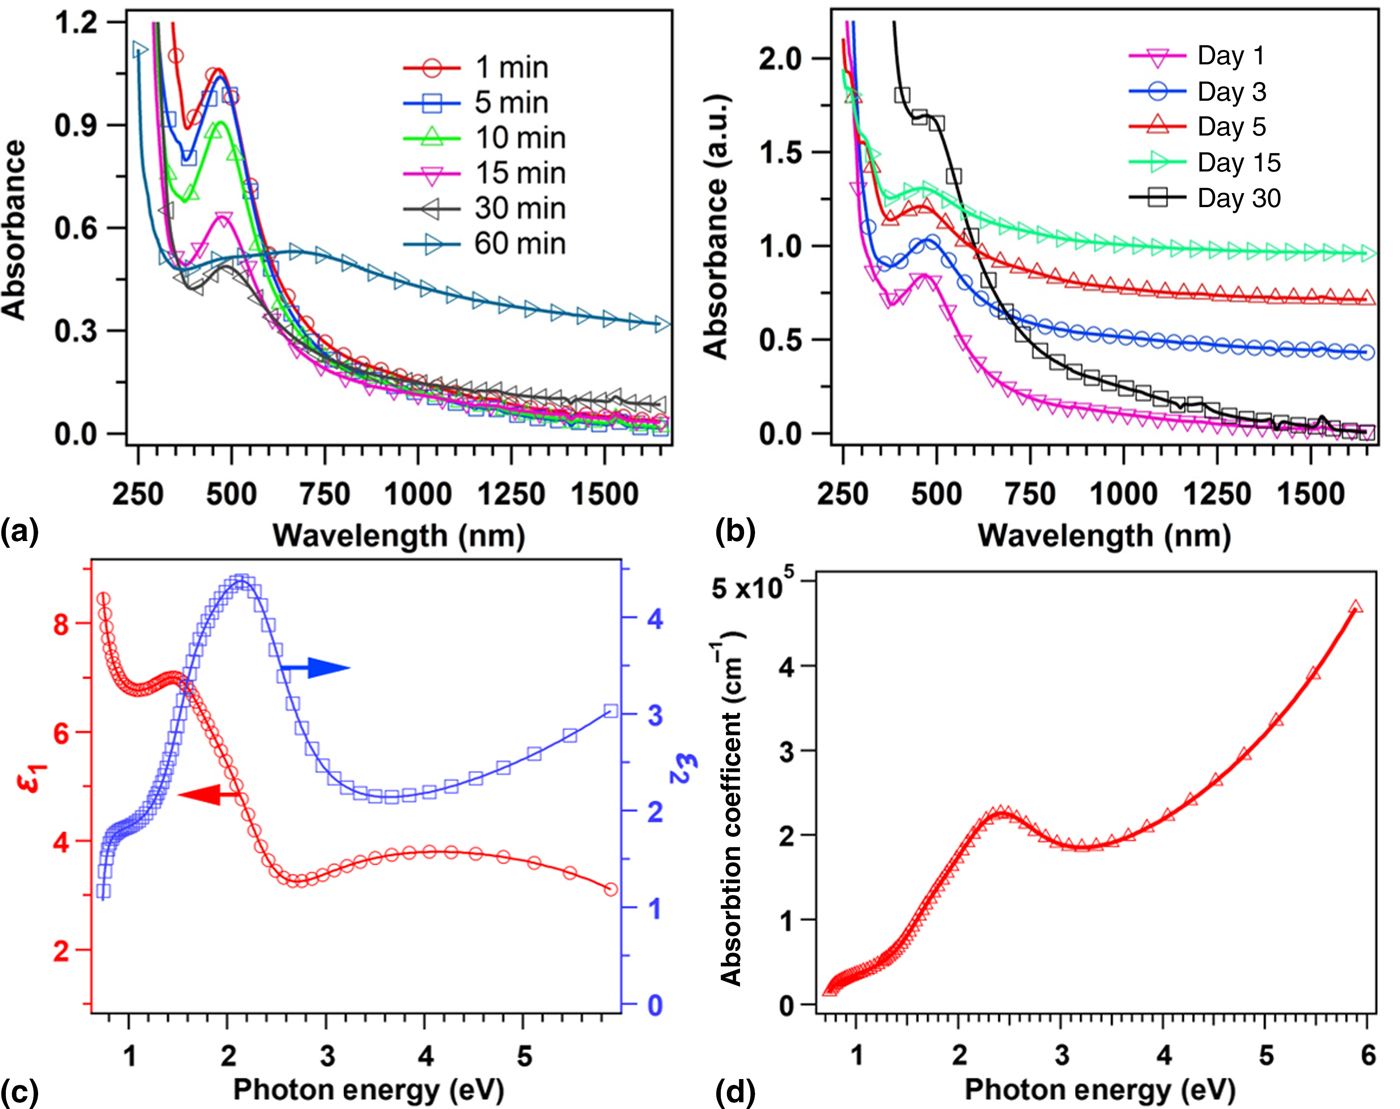
Unpolarized transmittance spectra of CuFeS2 NCs were measured using a Lambda 1050 spectrophotometer (Perkin Elmer) in chloroform solution, referenced to the neat solvent, in a 2 mm path length cuvette. Figure 3 shows the absorbance spectra determined by using Beer's Law from the unpolarized transmittance spectra collected from 250 to 1650 nm. The spectra were recorded for NC samples having growth times of 1, 5, 10, 15, 30, and 60 min, respectively. A strong absorption peak ~465 nm was observed for the NCs with growth time of 1 min. The UV-Vis spectra show that the absorption peak wavelength slightly increases with increasing growth time. The NCs grown for 30 min have the absorption peak at 490 nm, but 60 min grown NCs do not show this absorption peak. The absorption feature observed at ~490 nm matches closely with previous reports.[Reference Wu, Zhou, Yang, Liao, Zhang and Li5, Reference Ghosh, Avellini, Petrelli, Kriegel, Gaspari, Almeida, Bertoni, Cavalli, Scotognella, Pellegrino and Manna6, Reference Gabka, Bujak, Żukrowski, Zabost, Kotwica, Malinowska, Ostrowski, Wielgus, Lisowski and Sobczak13] A typical absorption spectrum in the range of 400–2500 nm for 1 h grown CuFeS2 NCs solution is shown in Fig. S6 (SI).
Optical properties of CuFeS2 nanocrystals (a) absorbance spectra of as-synthesized CuFeS2 NCs dispersed in chloroform in 2 mm optical path length cuvette as a function of growth time (b) stability test in 30 days (c) real and imaginary dielectric constants (ε) with photon energy for 15 min grown NCs at 270 °C, and (d) absorption coefficient (α) evaluated from spectra in k using spectroscopic ellipsometry.

Based on the literature, other materials showing absorption peaks in the 290 to 600 nm regions include CuO with an absorption peak at ~290 nm and CuS with an absorption peak at ~ 430 nm.[Reference El-Trass, ElShamy, El-Mehasseb and El-Kemary31] Further, Cu2−xS nanoparticles (NPs) show a broad IR absorption feature ascribed to a localized surface plasmon resonance.[Reference Saldanha, Brescia, Prato, Li, Povia, Manna and Lesnyak29] FeO NPs reported by Liu et al. do not have any absorption peaks in the region <600 nm.[Reference Liu, Cai and Zeng32] Just prior to initiating the CuFeS2 synthesis, reactants were evacuated at 120 °C to remove oxygen and water, and the synthesis was carried out in a high purity nitrogen environment to avoid any reaction with atmospheric oxygen. Further, the XRD patterns of CuFeS2 NCs grown for longer than 10 min at temperature 270 °C is phase-pure tetragonal CuFeS2 NCs with no other observable impurities (Fig. S1). However, the NCs grown for 5 min at the same temperature may include traces of CuS as evident from the diffraction pattern (Fig. S1) at ~27.7° (vide supra). Wiltrout et al. have reported an absorption peak at ~600 nm arising from bornite (Cu5FeS4) NPs, but our XRD studies do not show the presence of Cu5FeS4 or any other cubic phases.[Reference Wiltrout, Freymeyer, Machani, Rossi and Plass33] Thus, we assign the absorption peaks in the 465–490 nm range to pure tetragonal CuFeS2 NCs.
Previously, many authors have reported blue shifting of the band gap of the CuFeS2 NCs compared with its bulk counterpart (~0.6 eV), which they attributed to quantum confinement.[Reference Liang, Ma, Jiao, Pang and Feng3, Reference Wu, Zhou, Yang, Liao, Zhang and Li5, Reference Wang, Bao and Gupta11] Some authors have correlated an absorption feature observed in chalcopyrite NCs at ~498 nm with a possible surface plasmon resonance.[Reference Gabka, Bujak, Żukrowski, Zabost, Kotwica, Malinowska, Ostrowski, Wielgus, Lisowski and Sobczak13] Our spectra show a very narrow red shift (~25 nm) when increasing the NC growth time from 1 min to 30 min at 270 °C. The small red shift observed from 465 to 490 nm may be attributed to the weak quantum confinement or the surface effects of CuFeS2 NCs. The change in band gap of these CuFeS2 NCs with growth time is quite different from other quantum confined NCs such as PbS and CdSe. For example, in the case of PbS quantum dots, the absorption peaks shift rapidly from 970 to 1740 nm (1.28 to 0.71 eV) within the growth time of 1–20 min.[Reference Moreels, Lambert, Smeets, De Muynck, Nollet, Martins, Vanhaecke, Vantomme, Delerue, Allan and Hens34] The band gap of CuFeS2 NCs cannot be tuned by quantum confinement as widely as that of PbS, since the Bohr exciton radius of CuFeS2 NCs should be similar to that of iron pyrite (1.3 nm)[Reference Li, Doblinger, Vaneski, Rogach, Jackel and Feldmann35] and CuInS2 (4.1 nm)[Reference Castro, Bailey, Raffaelle, Banger and Hepp36], but much smaller than PbS (18 nm)[Reference Moreels, Lambert, Smeets, De Muynck, Nollet, Martins, Vanhaecke, Vantomme, Delerue, Allan and Hens34]. Since the size of the NCs prepared here are larger than the Bohr exciton radius, strong quantum confinement is neither present nor expected.
The electronic structure for bulk chalcopyrite CuFeS2 has been discussed in available literature.[Reference Kambara1, Reference Oguchi, Sato and Teranishi23, Reference Hamajima, Kambara, Gondaira and Oguchi24, Reference Xu and Schoonen37] The theoretical calculation shows an indirect band gap of 0.63 eV in between VB and IB-I, and the width of IB band is ~1.10 eV.[Reference Ghosh, Avellini, Petrelli, Kriegel, Gaspari, Almeida, Bertoni, Cavalli, Scotognella, Pellegrino and Manna6] The small band gap of this bulk chalcopyrite arises due to the electronic transition from VB to IB-I predominantly formed by empty Fe 3d orbitals.[Reference Hamajima, Kambara, Gondaira and Oguchi24] The suppression of the absorption feature at ~490 nm for larger NCs fabricated at longer growth time may be due to several reasons including scattering by larger particles, defect states or unpassivated dangling bonds on the surface. Further study will be required to understand the influence of CuFeS2 NC size on defect densities and optical properties. Thus, based on this observation, we conclude that the absorption peaks observed in the spectral range of 465–490 nm (2.66 to 2.53 eV) is not due to the quantum confinement effect; instead it arises from an electronic transition from the VB to the IB-II located within the fundamental band gap (3.1 eV)[Reference Hamajima, Kambara, Gondaira and Oguchi24] of CuFeS2 NCs which is the characteristics of CuFeS2 materials. Further, the complex optical properties of these CuFeS2 NCs were studied using spectroscopic ellipsometry technique in the range of 0.735 to 5.887 eV which is discussed in the section “Optical Properties Using Spectroscopic Ellipsometry”.
The stability of these colloidal CuFeS2 NCs is tracked via absorbance spectra of NCs solution dispersed in chloroform, kept in a vial (solution and in air) and stored in ambient environment. The absorbance spectra for 15 min grown CuFeS2 NCs measured at different intervals of time (day 1, day 3 etc) after preparation is presented in Fig. 3(b). From day 1 to day 30, no significant changes in the absorption feature of these NCs are observed indicating that these NCs are quite stable in ambient conditions. The NCs concentration in solution may be slightly different in each measurement giving rise to decreased peak intensity, and some agglomeration of NCs is expected over the time. Further, the XRD pattern of CuFeS2 NC films stored in an ambient environment and measured after 30 days of preparation matches with the standard XRD pattern of chalcopyrite CuFeS2 (#PDF 98-000-0156) with no other phases materials (Fig. S7). The XRD patterns along with consistently shaped absorbance spectra indicate that these NCs are stable in air.
The active vibrational modes present in the NCs were determined from Raman spectroscopy measurement using a HeNe laser of 632.8 nm wavelength (Fig. S8). The measured Raman spectrum matches quite closely with the spectra reported previously for the bulk CuFeS2 excited with a 514.5 nm laser.[Reference Chunrui, Shaolin, Junqing and Kaibin38] For as-synthesized NCs, active peaks at positions 290, 351, and 470 cm−1 were observed. Based on the literature of similar observations[Reference Kumar, Uma and Nagarajan12, Reference Chunrui, Shaolin, Junqing and Kaibin38], the active peaks at 290, 351, and 470 cm−1 are assigned to be A1, B1, and E phonon modes. The active peak at 290 cm−1 is the strongest as evident from the spectrum for the A1 modes of vibration. Thus, based on XRD pattern, elemental composition, and Raman active modes of vibration, chalcopyrite CuFeS2 NCs synthesized here are phase pure with tetragonal crystal structure.
Optical properties using spectroscopic ellipsometry
Complex optical properties of the CuFeS2 NC thin film can be described by the complex dielectric function, ε(E) = ε 1(E) + i ε 2 (E), or the complex refractive index, N(E) = n(E) + ik (E) = ε 1/2 (E), spectra as obtained from spectroscopic ellipsometry measurement and analysis (see SI) where ε 1 = real part of dielectric constant, ε 2=imaginary part of dielectric constant, n = refractive index, k = extinction coefficient, and E = photon energy, respectively. These complex quantities, ε(E) and N(E), are also called optical constant which determines reflection and absorption of media when light travel. The spectra in ε and the structural parameters, the surface roughness, and NC film thickness are extracted by fitting the experimental ellipsometric spectra to a model consisting of semi-infinite soda lime glass substrate/NC film/surface layer/air ambient. Spectra in ε for the NC film are parameterized by using multiple critical point parabolic band (CPPB) oscillators[Reference Subedi, Bhandari, Ellingson and Podraza39] each of which is described by
 $$\varepsilon (E) = \varepsilon _\infty + \sum\limits_n {A_n{\rm e}^{i\varphi _n}{\left( {\displaystyle{{\Gamma _n} \over {2E_n - 2E - i{\it \Gamma} _n}}} \right)}^{\mu _n}} $$
This CPPB oscillator model describes the optical constant of the material at the interband critical point (CP). For each CPPB oscillator, A n is the amplitude, Γ n is the broadening, E n is the critical point energy, μ n is the exponent, and ϕ n is the phase projection factor. Excitonic transitions (μ n = 1) are assumed similar to those used to describe FeS2 NCs.[Reference Subedi, Bhandari, Ellingson and Podraza39] To account the dispersion outside our measured spectral range a constant additive term to ε 1 denoted by ε ∞ is also included in parameterization. Spectra in ε describing the surface layer of film are modeled using the Bruggeman effective medium approximation[Reference Bruggeman40] consisting of 0.834 ± 0.004 of the volume fraction to be identical to CuFeS2 NCs layer and the remainder void. In addition to the parameters describing spectra in ε, the NCs film thickness (d b) and surface layer thicknesses (d s) are also free parameters in the least squares regression fit. The thicknesses as obtained from the parametric model are d b = 962 ± 4 nm and d s = 251 ± 2 nm, respectively. The surface layer can be interpreted as a combination of roughness and lower packing density of NCs near the top of the deposited film. The high value of d s corresponds to the sample non-uniformity of the film near the surface and/or grading in NCs packing density. The fitted values with error bars are reported in Table SII (SI) with mean square error (σ) = 3.5 × 10⁻³. There are three interband transitions represented by the resonance energies of CPPB oscillators at 0.652 ± 0.003, 1.54 ± 0.03, and 2.29 ± 0.01 eV, respectively, along with an additional oscillator needed to account for higher energy transitions outside the measured spectral range. Spectra in ε and N are shown in Fig. 3(c) and Fig. S9 (in SI), respectively. From spectra in N, the absorption coefficient, α = 4 π k (λ)/λ is evaluated which is shown in Fig. 3(d). The CP near 0.65 eV corresponds to the difference in energy between the VB and IB-I which is consistent with the absorption edge at 0.6 eV reported by Teranishi et al.[Reference Teranishi and Sato41] Origin of CPs near 1.54 and 2.29 eV are may be due to transition from VB to Fe 3d orbitals. The transition energies for single crystal CuFeS2 according to Oguchi et al.[Reference Oguchi, Sato and Teranishi23] are 1.0 and 2.1 eV, respectively. In comparison, our CPs are blue-shifted relative to a single crystal. The nature of both spectra in ε and α are similar to that of single crystal CuFeS2[Reference Oguchi, Sato and Teranishi23] but with features lower in magnitude. The critical point energies of these NCs are also red-shifted relative to iron pyrite NCs.[Reference Subedi, Bhandari, Ellingson and Podraza39]
Electronic and Hole Transport Properties
The electronic properties of a material determine the possible application of the material in the opto-electronic devices. The average sheet-resistance of the solution-processed CuFeS2 NC thin films is 7.3 (±3.7) × 104 Ω □−1 as provided by 4-point probe measurement with an average resistivity of 0.16 (±0.06) Ω cm. Also, these NC films have p-type conductivity as determined by thermal-probe measurement. The CuFeS2 NPs synthesized previously by Liang et al. also shows p-type conductivity with a resistivity of 1.21 Ω cm, and carrier concentration of the order 1018 cm−3.[Reference Liang, Ma, Jiao, Pang and Feng3] In our case, the lower resistivity may be due to the larger particle size of CuFeS2 NCs compared with Liang et al. (6.4 nm). Previously, solution-processed FeS2 NCs, synthesized by hot-injection route, with resistivity ~10–20 Ω cm and carrier concentration ~1018 cm−3 have been applied as low barrier interface layer in CdTe and PKSCs.[Reference Bhandari, Koirala, Paudel, Khanal, Phillips, Yan, Collins, Heben and Ellingson17, Reference Huckaba, Sanghyun, Grancini, Bastola, Taek, Younghui, Bhandari, Ballif, Ellingson and Nazeeruddin18] Here, these CuFeS2 NC films have lower resistivity compared with FeS2 NC films and comparable carrier concentration, and hence we were interested to study the hole transport properties of these materials in CdTe solar cells.
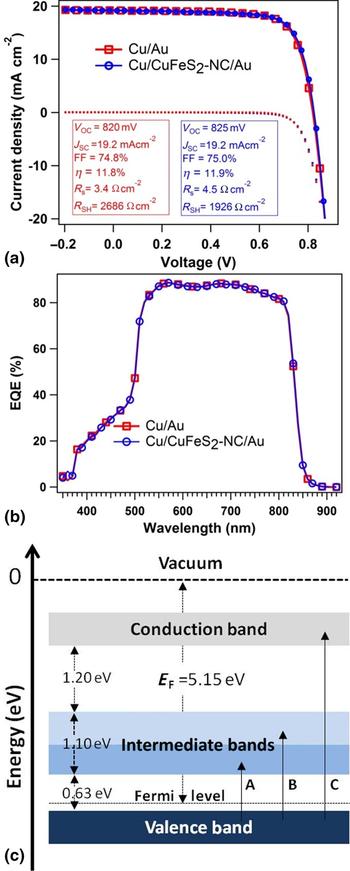
Figure 4 displays the device characteristics of the CdS/CdTe solar cells with two back contacts: Cu/Au and Cu/CuFeS2-NC/Au. The CuFeS2 layer of thickness ~1 µm was prepared using a NCs with growth time of 2 h at 270 °C. A schematic device structure is shown in Fig. S10 (SI). J-V characteristics measured under simulated AM1.5G irradiance for best devices are shown in Fig. 4(a) for both Cu/Au and Cu/CuFeS2-NC/Au back contacts. A summary of device parameters for 20 CdTe solar cells with Cu/Au and Cu/CuFeS2-NC/Au back contacts is presented in Table SIII. By introducing CuFeS2 as an interface layer, a slight improvement on open-circuit voltage and fill factor was observed in addition to an increased series resistance of the device compared with the standard Cu/Au. The introduction of the CuFeS2 back contact interface layer resulted in an overall power conversion efficiency that was slightly improved than observed for the Cu/Au back contact design. As a recommended standard practice, the current density (J) as determined by J-V measurement was verified by EQE measurement [Fig. 4(b)].
Performance characteristics of the best CdTe devices attained with and without the CuFeS2 NC hole transport layer (a) current-density versus voltage (J-V) curves and (b) external quantum efficiency (EQE) spectra, and (c) schematic diagram for an electronic structure of bulk chalcopyrite (CuFeS2) materials.

Figure 4(c) displays the schematic diagram for an electronic structure of bulk chalcopyrite CuFeS2 materials which have IBs formed mainly due to the Fe 3d orbitals in between the VB and CB. The electronic transitions, A and B in Fig. 4(c), <3.1 eV are due to transitions from VB to the IBs.[Reference Oguchi, Sato and Teranishi23, Reference Hamajima, Kambara, Gondaira and Oguchi24] The previous report has assigned the Fermi level at 5.15 eV below the vacuum level for chalcopyrite (CuFeS2) materials.[Reference Xu and Schoonen37] It may require further studies to understand the band offset mismatch in the case of CuFeS2 NC-film and CdTe interface. Using the CuFeS2-NC film as an interface layer, we found a slight improvement in the V OC and FF with respect to Cu/Au back contact, but a slight decrease in J SC. The decrease in J SC is compensated by V OC and FF to yield similar device performance in both cases. The additional effect due to the CuFeS2 interface layer we observed is the increase in the series resistance of the solar cells, and it may require further treatment to increase the conductivity of the NC interface layer. Two possible reasons for the non-ideal interface layer performance of the CuFeS2 NC HTL are (i) the large distribution of particle sizes, and (ii) weak adhesion of the HTL film to CdTe. Currently, we are working to control the NC size distribution, to improve the interface between CdTe and the CuFeS2 NC-film, and to study the hole transport properties of these CuFeS2 NCs in other PV devices. Based on our preliminary results of using CuFeS2 NCs as HTLs in CdTe devices, these NCs may find similar applications in other material systems and device structures.
Conclusions
We have successfully synthesized phase pure and stable chalcopyrite CuFeS2 NCs using a thermal-injection colloidal route. In the synthesis process, the elemental sulfur powder was used as the S source. The nucleation temperature and growth duration of the NCs play critical roles in the synthesis of phase pure and stable ternary CuFeS2 NCs. These NCs possess tetragonal crystal structure in chalcopyrite phase. A strong absorption peak at ~465 nm was observed for 1 min grown NCs, which shifted to 490 nm after 30 min, and it disappeared for 1 h grown CuFeS2 NCs. From spectra in ε, interband transitions are identified at 0.652 ± 0.003, 1.54 ± 0.03, and 2.29 ± 0.01 eV, which are attributed to transitions from the VB to IBs formed by Fe 3d orbitals. The average sheet resistance of CuFeS2 NC films was found to be 7.3 (±3.7) × 104 Ω □−1 with an average resistivity of 0.16 (±0.06) Ω cm. Our preliminary results demonstrate the potential application of CuFeS2 NC-based thin films as the HTL in thin film solar cells.
Supplementary material
The supplementary material for this article can be found at https://doi.org/10.1557/mrc.2018.117.
Acknowledgments
The authors gratefully acknowledge funding from the US National Science Foundation Sustainable Energy Pathways program for funding under Grant CHE-1230246, the U.S. Air Force Research Laboratory, Space Vehicles Directorate (contract # FA9453-11-C-0253), the Ohio Department of Development Ohio Research Scholar Program Northwest Ohio Innovators in Thin Film Photovoltaics Grant No. TECH 09-025, and startup funds provided by the University of Toledo.