I. INTRODUCTION
The spherical indentation test data is obtained by continuously measuring the applied load F and penetration depth h of a stiff spherical indenter of radius R in the surface of the tested material. Concerning metallic alloys, recent studies have shown that the data from a single spherical indentation test has the potential to evaluate a unique solution for the Young modulus as well as for the two parameters of the Hollomon hardening law, especially if sufficiently deep normalized penetration h/R is achieved in the case of materials that are difficult to differentiate.Reference Cheng and Cheng1, Reference Chen, Ogasawara, Zhaov and Chiba2 The spherical indentation test has been widely used to evaluate the mechanical properties of bulk materials,Reference Kucharski and Mröz3–Reference Ogasawara, Chiba and Chen14 treated surfaces, and coatingsReference Nayebi, Bartier, Mauvoisin and El Abdi15–Reference Nayebi, El Abdi, Bartier and Mauvoisin17 by computer-assisted inverse analysis. Some studies have also considered anisotropic materials and proposed to use the geometry of the residual imprint as additional information for computer-assisted inverse analysis.Reference Bocciarelli, Bolzon and Maier18, Reference Yonezu, Yoneda, Hirakata, Sakihara and Minoshima19
The main advantages of the indentation test compared, for instance, to the tensile test, are the local probing of mechanical characteristics and the few restrictions on the sample shape and size. However, most of the theoretical and numerical models proposed so far consider infinite sample dimensions compared to the indenter radius, which implies no influence on the indentation response. Few studies on metallic sheets also consider the thickness to be high enough to have no influence.Reference Chung, Lee, Kim, Kim, Park, Kwon and Chung20 Only few studies have considered the influence of sample thickness on indentation response. For example, YangReference Yang21 studied the indentation problem of impressing a rigid flat-ended cylindrical indenter onto an elastic layer deposited on a rigid substrate. By using an integral transform method, it was shown that the specimen thickness especially for thin films may not be negligible when the ratio of contact radius to the specimen thickness is larger than 1. Largeau et al.Reference Largeau, Patriarche, Rivière, Rivière and Le Bourhis22 and Patriarche et al.Reference Patriarche, Largeau, Rivière and Le Bourhis23 studied the plastic deformation of thin semiconductors samples by a Vickers indenter. The study of indentation revealed that contact behavior is changed when the thickness of the sample is of the same magnitude as the plastic zone dimension.Reference Largeau, Patriarche, Rivière, Rivière and Le Bourhis22 Once plastic flow throughout the thin semiconductors samples occurs, pile-ups progressively vanish when the load applied to the indenter increases.Reference Largeau, Patriarche, Rivière, Rivière and Le Bourhis22, Reference Patriarche, Largeau, Rivière and Le Bourhis23 In the present study, the influence of the sample thickness is also investigated. This work aims at an increased understanding of how the indentation test can be applied to thin metallic sheets in the automotive industry.
In Section II, the studied material, samples, and indentation device specificities as well as the proposed solution of the Université de Rennes 1 that consists of using a spherical anvil instead of a classical flat anvil in the case of thin samples which exhibit a slight curvature are described. In Section III, the numerical model and resulting observations are presented. In Section IV, experimental results are presented. Section V provides a summary of the present work as well as prospects for further work.
II. MATERIAL AND EXPERIMENTAL DEVICE DESCRIPTION
A. Material, sample preparation, and characterization
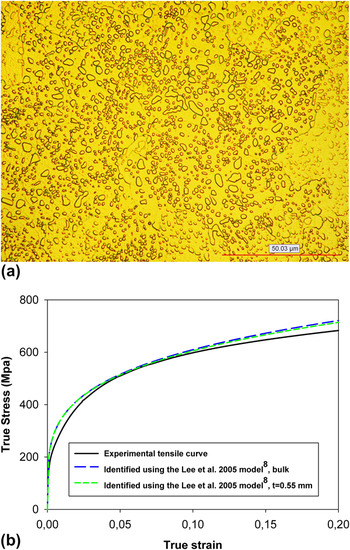
The sample selected for this study is a spheroidized AISI 1095 steel. This nonalloyed steel contains approximately 1% carbon. The standard spheroidizing annealing was carried out prior to delivery to our laboratory. This type of steel was selected to obtain a fine and homogeneous microstructure and thus a good reproducibility of the indentation tests. Figure 1(a) shows an optical micrograph of the AISI 1095 steel and reveals a homogeneous distribution of spheroidized cementite particles in a ferritic matrix.
(a) Optical micrograph and (b) stress–strain relationships of the studied AISI 1095 steel obtained by tensile test and identified from indentation by the Lee et al. 2005 model.Reference Lee, Lee and Pharr5

Tensile tests were performed on samples issued from the same rod as the indentation samples. The test led to the stress–strain curve shown Fig. 1(b).
Indentation samples were cut out of the same rod and were rectified to the thicknesses 10, 1.9, 1.5, 1.0, and 0.55 mm. Then, the specimens were carefully polished using fine emery papers (up to 1200 grit) and diamond suspensions (6 and 3 μm) to avoid uncertainties due to roughness.
B. Indentation device specificities
The indentation tests were conducted with a bulk tungsten carbide (WC) indenter that is axisymmetric but not perfectly spherical. Its mean radius is 0.5 mm. The indentation load was led up to 200 N with a constant loading rate of 2 μm/s. The indentation depth was measured by a set of three sensors at a distance of 10 mm from the indentation axis.
1. Bulk indentation
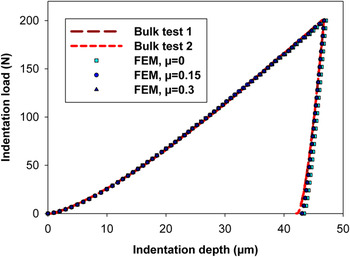
Indentation tests performed on a bulk 10-mm-thick AISI 1095 sample show a very good reproducibility, as shown in Fig. 2. An in-house calibration procedure for the indenter was applied, and the Hollomon power law parameters were evaluated using the model proposed in 2005 by Lee et al.Reference Lee, Lee and Pharr5 The results presented in Fig. 1(b) show a good agreement between the experimental and the evaluated hardening curve. The finite element method results are discussed in Section III.
Experimental and numerical indentation curves on bulk AISI 1095 steel.

2. Spherical anvil
It is expected, as will be presented in Section IV, that reproducibility can be affected by the unavoidable curvature of thin samples. Instead of a classical flat anvil, our proposition is the use a spherical anvil whose radius must be smaller than the sample curvature, but high enough not to influence the indentation results. For this purpose, a bulk cylindrical WC anvil with a rounded tip of high radius was used. Since the base radius is small compared to the tip radius, it is difficult to measure the tip radius optically. Therefore, we used elastic contact equations to evaluate the tip radius R. Indentations were performed on a high yield stress steel bulk sample, and the resulting elastic contact curve was used to evaluate the tip radius R. We used the Hertz contact solutionReference Hertz24 which provides the relation between the load F and the mutual approach h of two points far from the contact zone in two infinite half-spaces, i.e.,
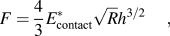
where  is the reduced elastic modulus of the contact expressed as

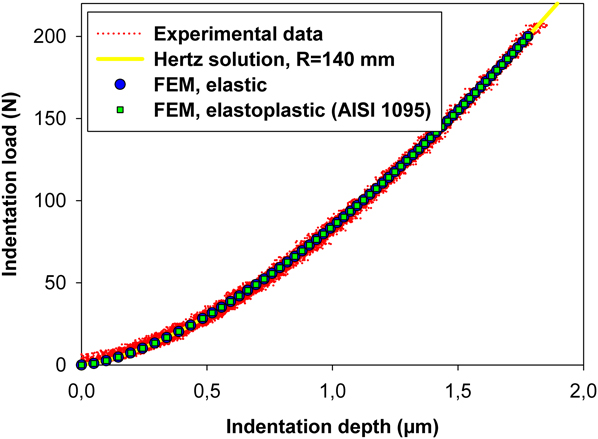
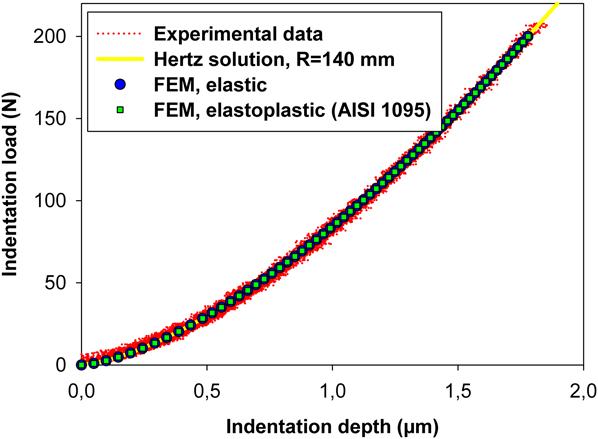
Using a Young’s modulus of 210 GPa for steel and 600 GPa for tungsten carbide and a Poisson’s ratio of 0.3 for steel and 0.22 for tungsten carbide, the experimental curve was found to be representative of the behavior of a 140-mm-radius sphere, as shown in Fig. 3. This radius value is thus considered in the present study for the spherical anvil. Numerical results are discussed in Section III.
Experimental and numerical indentation curves with the spherical anvil used as an indenter.
III. NUMERICAL AND THEORETICAL ANALYSIS
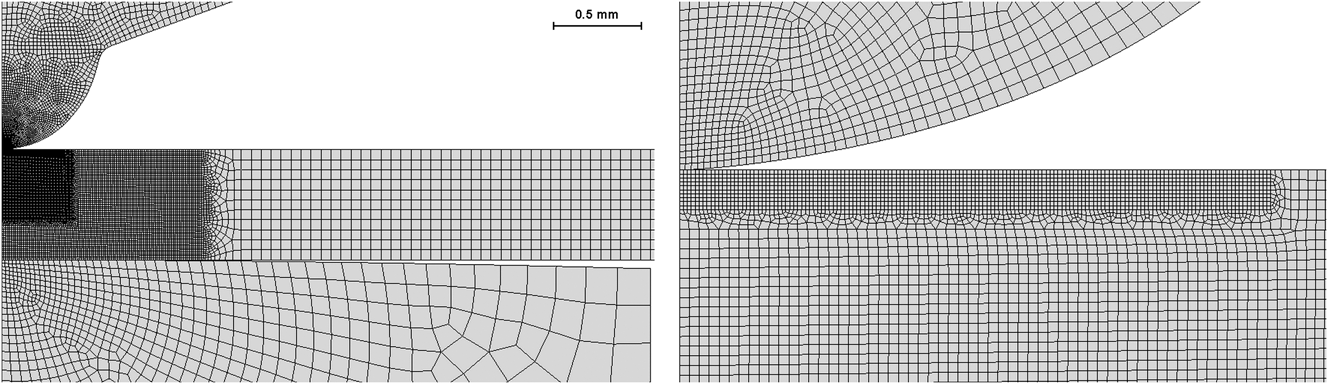
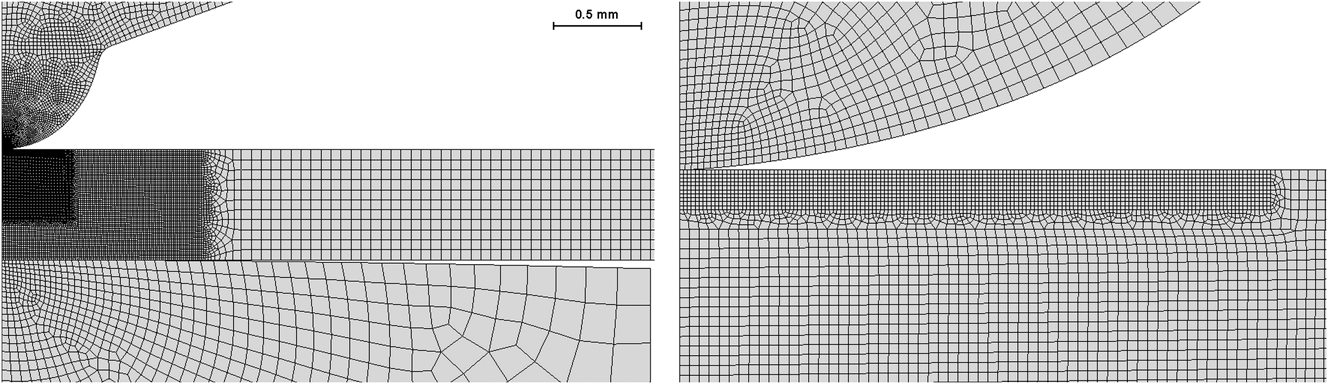
The ABAQUS/Standard finite element code was used for the simulations in axisymmetric mode. The geometries of the three bulk tungsten carbide tools, i.e., the indenter of 0.5 mm mean radius and either the flat anvil or the spherical anvil of radius 140 mm were accurately reproduced. Simulations were carried out for the four different thicknesses. All mesh elements are axisymmetric four-node fully integrated elements. The element density distribution was built to obtain a compromise between accuracy in the contact and plastic zones, and computing time, as shown in Fig. 4.
Detail of the mesh in the contact zone.
The sample material was assumed to obey isotropic linear elastic behavior with a Young’s modulus of 210 GPa and a Poisson’s ratio of 0.3. The plastic behavior was assumed isotropic, and the chosen yield criterion was von Mises. The isotropic hardening curve was taken to be the experimental tensile curve from which the elastic deformation was removed, and the yield stress was determined using the standard 0.2% deformation criterion. The tungsten carbide Young’s modulus was set to 600 GPa and its Poisson’s ratio to 0.22.
A penalty contact algorithm was used. Numerical simulations were performed on an infinite half space using friction coefficient values of 0,Reference Cao and Lu4, Reference Lee, Kim and Lee6 0.15,Reference Chen, Ogasawara, Zhaov and Chiba2, Reference Zhao, Ogasawara, Chiba and Chen8, Reference Cao, Qian and Huber9, Reference Jiang, Zhang, Feng and Liang13, Reference Ogasawara, Chiba and Chen14 and 0.3Reference Lee, Kim and Lee6 to assess its influence. The resulting curves are shown in Fig. 2. The curve resulting from frictionless contact is slightly softer than those corresponding to friction coefficient values of 0.15 and 0.3, which are very similar. Numerical curves show very good agreement with the experimental curves on a bulk sample if a friction value is taken into account. Thus, the medium value 0.15 was used in the following simulations. This value is frequently used for the simulation of indentation between steel and tungsten carbide during deep indentation.Reference Chen, Ogasawara, Zhaov and Chiba2, Reference Zhao, Ogasawara, Chiba and Chen8, Reference Cao, Qian and Huber9, Reference Jiang, Zhang, Feng and Liang13, Reference Ogasawara, Chiba and Chen14 The indentation of an infinite half space by the spherical anvil was also simulated using a friction coefficient of 0.15, leading to the results shown in Fig. 3. The results are in very good agreement with the experimental result as well as the theoretical result. In the case of the elastoplastic simulation, the indentation curve is little affected by the slight plasticity occurring in the AISI 1095 steel due to the low contact pressure.
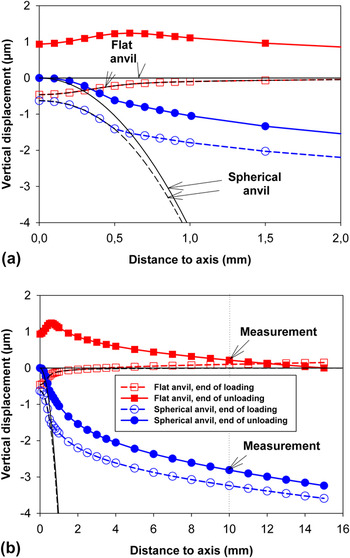
Before analyzing the indentation curves, it is worth noticing the particular behavior of the sample and the experimental device in the case of the lowest thickness, i.e., 0.55 mm. In Fig. 5, the upper surface of both anvils and the lower surface of the sample are drawn at maximum load and at the end of unloading, which provides the reference geometry of the tools. In the case of a flat anvil, the sample is pushed down on the indentation axis due to the anvil deformation and its outer region is raised at highest load, which inevitably affects the penetration measurement done at a distance of 10 mm from the axis. After unloading, the sample keeps an irreversible shape leading to a gap between its lower surface and the anvil. In the case of a spherical anvil, the lower surface of the sample fits to the shape of the deformed anvil and a sample curvature is observed at highest load. After unloading, the global deformed shape is kept, i.e., a residual imprint and a residual curvature of the sample remain.
Lower contact surface profiles at (a) low and (b) large scale.

Due to the curvature of the sample when a spherical anvil is used, we decided to apply a second set of sensors underneath the sample. This was intended to provide results which are independent of the sample curvature. However, the measurement became dependent on the mutual penetration of the sample and the spherical anvil. This issue is considered thereafter.
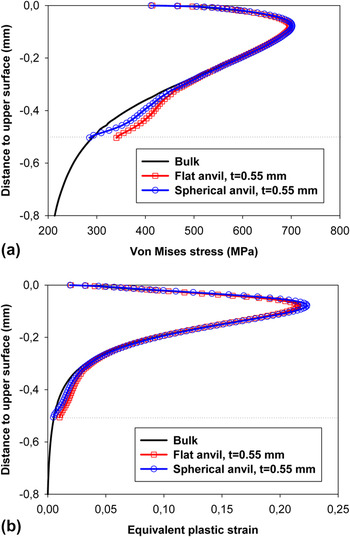
Another aspect to take into account is the material response in the case of the thinnest sample. The von Mises stress and equivalent plastic strain values on the indentation axis at maximum load are plotted in Figs. 6(a) and 6(b) for the cases of bulk indentation and indentation on a 0.55-mm-thick sample on either a flat or a spherical anvil.
(a) Von Mises and (b) equivalent plastic strain on the indentation axis at maximum load.

The values are quite similar, but a slight deviation from the bulk reference solution can be observed close to the lower surface of the thin sample. This deviation is greater in the case of a flat anvil than in the case of a spherical anvil. In both cases, von Mises stress and equivalent plastic strain values near the lower surface of the thin sample are higher than those occurring in a bulk sample at an equal distance to the upper surface. This can be due to the fact that part of the deformation would have been elastically accommodated in the case of a bulk sample, which would have led to lower stress and equivalent plastic strain values.
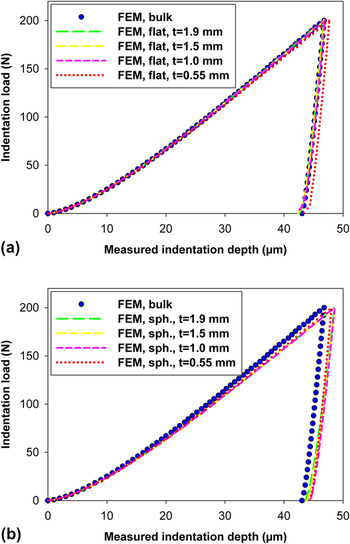
With these observations in mind, i.e., the particular behavior of the experimental device, sample, and material in the case of a thin sample, let us now consider the numerical indentation curves, which are compared to the numerical bulk indentation curve in Fig. 7.
Numerical curves for (a) flat and (b) spherical anvils.

In the case of a flat anvil, no strong influence of thickness is noticed until a very low value, i.e., 0.55 mm, is reached. The corresponding curve is softer. Part of this difference can be due to the deformation of the anvil which, even though stiffer than steel, is in contact with the specimen over a small area and the rising of the measured point at 10 mm from the indentation axis. Both sources lead to an overestimation of the penetration depth into the sample. Another source can of course be due to the material that, as presented in Fig. 6, exhibits more plastic strain, thus a softer resistance to indentation when the sample thickness is low. The unloading curve remains unchanged, except at the very end of unloading when the effect of the gap mentioned in Fig. 5 can be seen.
In the case of a spherical anvil, all curves exhibit a softer response to indentation than the bulk indentation response. This is mainly due to the mutual penetration of the spherical anvil and the sample. Note that all loading curves except the one corresponding to the 0.55-mm-thick sample are very similar. Concerning the unloading curve, it is noticeable that the initial slope is different from the one observed in the case of bulk indentation and that it depends on the sample thickness.
A great advantage of the spherical contact geometry is the availability of theoretical solutions. As presented in Section II, the contact behavior of the spherical anvil can be modeled by the Hertz contact solution using a 140-mm tip radius. Therefore, the contact radius a can be expressed as
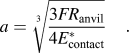
And the contribution of the spherical anvil to the mutual penetration can be expressed as
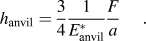
The particularity of the curve corresponding to the thinnest sample may be due to the fact that the sample cannot be considered as an infinite half space. Therefore, in a first approach, we propose to use a “truncated” form of the Hertz displacement field on the axis of indentation by integrating the deformation field down to the thickness t of the sample, assuming that the Hertz stress field is still valid:
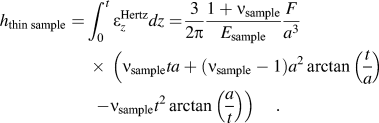
The mutual approach of a point in the spherical anvil far from the contact and a point at the original sample surface is then taken as the sum of  and
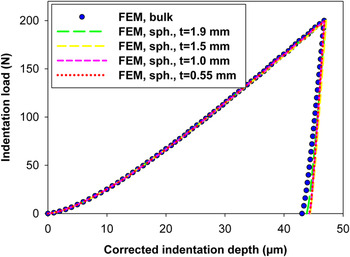
 . This value is removed from the measured displacement, and the results are shown in Fig. 8.
Numerical curves on the spherical anvil using the proposed analytical correction.

The corrected loading curves are very similar to the bulk indentation curve, even for the case of the thinnest sample. The reason for this good correction may be the fact that, once again according to Hertz’s theory, maximum stress is at a depth of 0.48a for this material and reaches 0.23 mm at maximum load, which is far from the sample thickness. The very slightly lower indentation load at highest indentation depths may once again be linked to the softer response of thin samples due to higher plastic strain. Concerning the unloading curves, the correction does not provide the bulk indentation behavior and the slope is still dependent on the sample thickness. This can be attributed to the residual imprint on the lower surface of the sample, as shown in Fig. 5.
IV. EXPERIMENTAL RESULTS
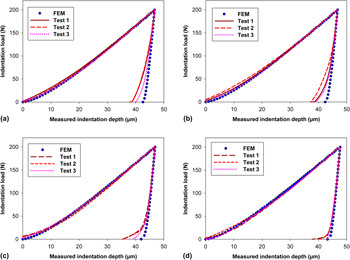
Figure 9 shows the experimental results obtained on the flat anvil at various sample thicknesses compared to the corresponding numerical solutions. To observe the differences between the unloading curves, numerical and experimental curves are superimposed at maximal load.
Experimental curves on the flat anvil for sample thicknesses (a) 1.9 mm, (b) 1.5 mm, (c) 1.0 mm, and (d) 0.55 mm.

It is clear that, compared to the reproducibility of the curves obtained on a bulk sample presented in Fig. 2, the experimental curves on a flat anvil exhibit a reproducibility problem, which is highlighted by the observation of the unloading curves. However, quite moderate reproducibility problem may be due to the fact that the samples were initially rectified with great care. If this reproducibility problem is due to the sample curvature, the less pronounced reproducibility problem in the case of a thin sample may be due to the lower stiffness of the sample at equal curvature.
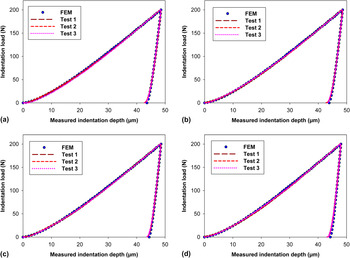
Figure 10 shows the experimental results obtained on the spherical anvil at various sample thicknesses compared to the corresponding numerical solutions.
Experimental curves on the spherical anvil for sample thicknesses (a) 1.9 mm, (b) 1.5 mm, (c) 1.0 mm, and (d) 0.55 mm.

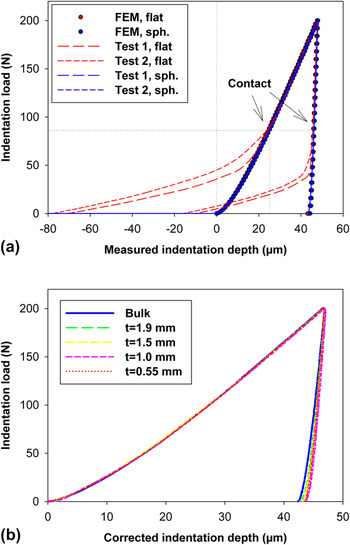
The results show a very good reproducibility as well as a very good agreement with the numerical solutions. This observation leads to the conclusion that the use of a spherical anvil provides results that are independent of the sample curvature. To confirm this conclusion, a 0.55-mm-thick sample was slightly bent to present a curvature radius still higher than 140 mm, defect which is not noticeable by eye. Indentation tests were performed on the flat and the spherical anvils. The results are presented in Fig. 11(a).
(a) Experimental curves on the bent sample and (b) experimental curves using a spherical anvil and the proposed analytical correction.

The results show a very clear dependence on the sample curvature in the case of a flat anvil. The beginning of the curves is strongly affected until contact with the anvil on the indentation axis is established, whereupon the indentation behavior is representative of the material. The unloading curves show the same dependency. In the case of a spherical anvil, the results are in no way affected. These observations lead to the conclusion that the use of a spherical anvil is a reliable solution in the case of slightly bent samples.
The Hertz transformation proposed in Section III is applied to the experimental curves obtained with the use of a spherical anvil, and the results are presented and compared to the bulk sample curve in Fig. 11(b). Observations are the same as for the numerical study. The corrected curves are very similar to the bulk sample curve, although slightly softer at highest load. The unloading curves show the same difference supposedly due to the residual imprint on the lower surface, as shown in Fig. 5. Once again, the Lee and Pharr modelReference Lee, Lee and Pharr5 is applied and provides the results in Fig. 1(b), that, as expected, are very close to the curve evaluated from the bulk sample curve.
V. CONCLUSION
In this work, the influence of sample thickness and sample curvature on the instrumented indentation response was investigated. An AISI 1095 steel was characterized by tensile test. Spherical indentation tests were performed on a bulk 10-mm-thick sample with an indenter of approximate radius 0.5 mm up to a load of 200N to confirm the reproducibility and reliability of the results. The proposed spherical anvil radius was evaluated using theoretical elastic contact solutions.
Numerical simulations and experimental tests were performed on bulk, 1.9 mm, 1.5 mm, 1.0 mm and 0.55 mm thick samples. Numerical results show that the sample thickness has an influence on the indentation device behavior as well as on the sample and material response. Unlike the case of a flat anvil, an analytical elastic contact solution is available in the case of a spherical anvil and can help largely recover the results obtained on a bulk sample. Experimental results show the strong influence of a slight sample curvature on the indentation curves obtained with a flat anvil. In the case of a spherical anvil, as long as the sample curvature radius is higher than the anvil radius, the indentation curves are not affected.
These observations lead to the conclusion that the use of a spherical anvil and adequate theoretical corrections are a relevant solution for the instrumented indentation of thin samples, especially if a sample curvature is expected, such as in the case of thin metallic sheets used in the automotive industry.