Introduction
Homocysteine is a sulphur-containing non-essential amino acid, which plays an important role in cerebral metabolism. Homocysteine levels are inversely related to folate and B12 concentrations due to the role these vitamins play in homocysteine metabolism. Homocysteine has neurotoxic effects through a variety of potential mechanisms (Sachdev, Reference Sachdev2005; Obeid and Herrmann, Reference Obeid and Herrmann2006) including excitotoxicity, vascular changes and accelerating Alzheimer pathology. High levels of homocysteine have been found to be a risk factor for dementia (Seshadri et al., Reference Seshadri2002; Ravaglia et al., Reference Ravaglia2007). In studies of community-dwelling older individuals, increased homocysteine has been associated with prevalence of white matter lesions in most studies (Vermeer et al., Reference Vermeer2002; den Heijer et al., Reference den Heijer2003; Sachdev et al., Reference Sachdev2004), though not all (Longstreth et al., Reference Longstreth2004). Presence of cerebral atrophy has also been observed in some (den Heijer et al., Reference den Heijer2003; Whalley et al., Reference Whalley2003) but not all studies (Longstreth et al., Reference Longstreth2004; Sachdev et al., Reference Sachdev2004). An association between raised homocysteine and hippocampal atrophy has also been reported (Williams et al., Reference Williams, Pereira, Budge and Bradley2002; den Heijer et al., Reference den Heijer2003). The reported associations with whole brain volume have all been done through cross-sectional studies, mostly assessed through visual ratings which are less sensitive than volumetric or longitudinal studies.
The aim of this work was to examine the relationship between homocysteine and brain atrophy over a two-year period in a group of community-dwelling individuals with hypertension. In a separate publication we show in our subjects a significant association between longitudinal rate of whole brain atrophy and homocysteine level (Narayan et al., submitted). In this paper we examine the data to determine if there is a specific association between homocysteine and the location of atrophy. We hypothesized that because white matter is more vulnerable than gray matter to ischemia and hypoxia, white matter would be more vulnerable to the excitatory and vascular damage produced by homocysteine and that homocysteine would be more closely related to white rather than gray matter atrophy. In addition, we wished to see if our data confirmed the previous associations between homocysteine and hippocampal atrophy.
Methods
Hypertensive individuals were recruited to the Newcastle MRI substudy from one research center participating in the larger international Study on COgnition and Prognosis in the Elderly (SCOPE) (Saxby et al., Reference Saxby, Harrington, Wesnes, McKeith and Ford2008). At entry to the main SCOPE trial, participants were aged 70–89 years, with systolic blood pressure (SBP) 160–179 mmHg and/or diastolic (DBP) 90–99 mmHg, untreated or thiazide-treated. Individuals were cognitively screened at entry to the trial, and those with possible dementia as defined by a Mini-mental State Examination (MMSE) score <24 and/or who reported significant cognitive decline were not eligible. Those with MMSE in the range 24–27 were assessed using the Clinical Dementia Rating (CDR) scale and the Informant Questionnaire on Cognitive Decline in the Elderly (IQCODE) to exclude cognitive decline. The SCOPE study in total lasted four years. At the time of first MRI scan, hypertensive participants had been receiving treatment for an average of 24 months (range 13–34 months). The second MRI scan was 710 days (range 694–721) after the first MRI scan (i.e. 4 years after the start of the SCOPE study, and just before the end of the treatment). Blood samples were obtained at the end of the trial, an average of two weeks after the last MRI. Treatment was according to the published SCOPE protocol (Hansson et al., Reference Hansson1999): essentially, participants were randomized, double-blind, to treatment with the angiotensin receptor blocker, candesartan cilexetil, or placebo. Open label hydrochlorothiazide and additional antihypertensive therapy were permitted to achieve the target BP of <160/90 mmHg. Subsequently, in 1999, target BP was changed to 150/90 mmHg at the Newcastle site in accordance with British Hypertension Society guidelines. Blood pressure measurements were taken with three readings in the seated position after five minutes rest, with the mean of the second and third reading used. Blood pressure was measured at six-monthly intervals, and we calculated the average of the BP readings between the two MRI scans.
Participants were invited to attend for MRI by telephone interview after screening for absolute contra-indications such as pacemaker or intraorbital foreign body. All 114 participants gave informed, written consent. Ethical approval was granted by the Newcastle Joint Ethics Committee. The participants all consented to and had a successful initial MRI scan. Repeat MRI scans were obtained from 97 people. Reasons for not repeating the MRI scan included refusal (n = 10), moved out of the area (n = 1), pacemaker fitted (n = 1) and death (n = 5).
Homocysteine and related biochemical determinants
At the end-trial visit, blood samples were drawn for total plasma homocysteine, vitamin B12 and folic acid. Non-fasting blood samples were obtained ensuring that the patients had not been in the lying/recumbent posture for an hour prior to this (Rasmussen and Møllerer, Reference Rasmussen, Møllerer, Carmel and Jacobsen2001). The samples were collected in vacuotainers containing EDTA, put on ice immediately and centrifuged within 30 minutes at 4 °Celsius to remove the cells from plasma. For the homocysteine assay, aliquots of the separated plasma were stored at −80 °C. Total plasma homocysteine was assayed using the Abbot IMx Homocysteine assay system (Abbott Laboratories, Chicago), based upon fluorescence polarization immunoassay (FPIA) technology. This method has 95% limits of agreement of −0.97 to 2.30, an intralaboratory imprecision of less than 5% and showed linearity throughout the 6 to 50 μmol/l range. Plasma folate and B12 were measured by Abbott AxSYM analyzer. The coefficient of variation for folate assay was <10% for all levels. The B12 assay was by means of a micro particle based enzyme immunoassay, with a coefficient of variation of <5% for medium or high levels, and <10% for levels of <100 ng/l. (Pernet et al., Reference Pernet, Lasnier and Vaubourdolle2000; Lonati et al., Reference Lonati2004). Normal ranges of these in our laboratory are: Serum folate 3.3–13.0 ug/L; Creatinine 55–110 μmol/L; Homocysteine 5.4–11.5 μmol/L.
MRI acquisition
All scans were performed on a 1.5 T GE Signa scanner (General Electric, Milwaukee, WI, USA). T1-weighted FSPGR (Fast Spoiled Gradient Recall) images were acquired in the coronal plane (TR = 12.4 ms, TE = 4.2 ms, TI = 650 ms, 256 × 256 matrix, slice thickness = 1.7 mm, flip angle = 15°) yielding 124 slices through the brain. FLAIR (Fluid Attenuated Inversion Recovery, TR = 10000 ms, TE = 142 ms, TI = 2100 ms, slice thickness = 5 mm with 2 mm interslice gap, 19 slices) and T2-weighted (TR = 3420 ms, TE = 97.7 ms, slice thickness = 5 mm with a 2 mm interslice gap, 19 slices) were acquired in the axial plane. Participants were imaged twice with MRI scans two years apart (MRI-a and MRI-b), as part of a longitudinal study. The first scan (MRI-a) was performed approximately two years after entry into the main SCOPE trial. The same radiographer was used throughout, and images were aligned on each subject so as to be parallel with a line joining the inferior-most portion of the anterior splenium and posterior genu of the corpus callosum.
MRI analysis
Baseline and repeat MR images were processed using SPM5 (www.fil.ion.ucl.ac.uk/spm) with MATLAB 7.1 (The MathWorks, Inc. Natick, MA, U.S.A). Default settings were used to segment images into gray and white matter and spatially transform all images to the space defined by the Montréal Neurological Institute (MNI). The gray and white matter maps produced represent the estimated probability of gray and white matter respectively in each voxel. Maps of gray and white matter loss were generated by subtracting the repeat probability maps from the baseline ones. To quantify the overall change separately in gray and white matter, masks were first generated from each of the baseline gray and white matter maps using a threshold of 0.5 to identify all probable gray and white voxels, and then the mean of the subtracted image within this mask calculated for both gray and white matter. Brain tissue loss is thus represented by positive values of these variables. Thus, if pa(gm)i is the probability of gray matter at pixel i at baseline and pb(gm)i the probability in the same pixel at repeat, then the total change in gray matter is given by the sum:

Rate of change of gray and white matter was calculated by dividing by the time (in years) between MRI scans and multiplying by 100 to give a percentage (of gray and white matter respectively).
Reliability of VBM for measuring white and gray matter volume changes was investigated by Shuter et al. (Reference Shuter, Yeh, Graham, Au and Wang2008) who found that (in the absence of signal-to-noise ratio (SNR) changes in the scanner) there was no change in measured gray or white volume over a period of two months, and that the SD of the difference measurement was ~1.5% of brain volume. We verified on five randomly selected subjects that the image SNR did not significantly change between first (mean 29.5, SD 5.3) and second scan (mean 30.5, SD 6.6). The SD of the gray and white matter difference measurement reported by Shuter et al. (Reference Shuter, Yeh, Graham, Au and Wang2008) is in agreement with our values.
Hippocampal volumes were measured from the baseline images using an automated segmentation technique (Firbank et al., Reference Firbank, Barber, Burton and O'Brien2008). Change in hippocampal gray matter was measured in a similar fashion to the whole brain gray matter change. The mask in this case was the same for all subjects – a region covering both hippocampi in MNI space (Firbank et al., Reference Firbank, Barber, Burton and O'Brien2008).
The change values for GM, WM and hippocampus were all calculated in MNI space, and are thus corrected for cranial size. To adjust the baseline volumes of gray and white matter for head size, volumes were divided by the intracranial volume as estimated using the BET software (part of FSL, http://www.fmrib.ox.ac.uk/fsl). Volumes of white matter lesions (WML) were measured from the FLAIR images using in-house semi-automated software as described previously (Firbank et al., Reference Firbank, Wiseman, Burton, Saxby, O'Brien and Ford2007).
Of the 97 who attended a second MRI scan, one subject did not have homocysteine measurements, five had motion artefacts, one had unsatisfactory brain segmentation and ten were missing scans due to technical problems, leaving 80 subjects in the analysis. Of the 193 subjects with homocysteine measurements, there were no differences between those with vs without MRI in age, sex, MMSE or years of education. There were also no significant differences between those from whom successful repeat MRI scans were obtained and those from whom they were not.
Statistical analysis
We used the Kolmogorov-Smirnoff test to check for normality. Of the MRI variables, WML volumes were not normally distributed (p < 0.001) but all others (GM/WM/hippocampus volumes) were. In the whole sample, B12 (p = 0.001), homocysteine (p = 0.006) and creatinine (p = 0.005) were not normally distributed, whereas folate was. In order to obtain variables with a normal distribution, log values of B12, creatinine, and homocysteine and WML volumes were calculated. After log transformation, no variables were significantly non-normal. Pearson correlation coefficients were calculated between age and biochemical concentrations and MRI volumes and atrophy rates. We used partial correlation to investigate the association between MRI and homocysteine after controlling for confounding variables. Semi-partial (part) r values are quoted. All p values are two tailed.
SPM5 was used to perform voxel-wise statistics to examine the relationship between the gray and white matter (baseline – repeat) difference maps and homocysteine, with additional regression variables of subject age and folate levels. In addition, baseline (log) WML volume was included in the white matter regression. Parametric maps were thresholded at p = 0.001 uncorrected, and significance values are presented for clusters after controlling for multiple comparisons.
Results
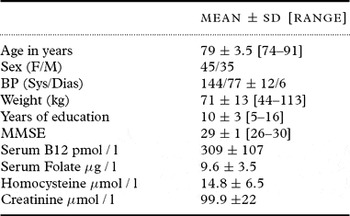
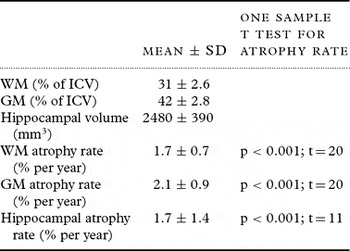
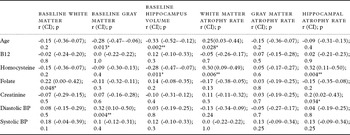
Subject demographics are shown in Table 1, and Table 2 shows the imaging parameters for the whole group. The MMSE was measured also at study end, and there was no significant change (paired t test t = 0.9; p = 0.4). All of the atrophy rates were significantly greater than zero. As Table 3 shows, homocysteine strongly correlated with white matter atrophy (p = 0.006) and hippocampal atrophy (p = 0.004). It also correlated with baseline volume of the hippocampus (p = 0.011), but not gray or white matter volumes. Vitamin B12 levels did not show a correlation with MRI volumes or atrophy rates, and folate levels showed only a marginal correlation with baseline WM volume and creatinine with hippocampal atrophy rate. Average diastolic BP correlated with baseline GM volume, but otherwise BP did not relate to atrophy rate. In a semi-partial correlation, controlling for age, WML volumes and average BP, homocysteine still showed a significant relationship with WM atrophy rate (r = 0.29; p = 0.010), hippocampal volume (r = −0.23; p = 0.035) and hippocampal atrophy rate (r = 0.32; p = 0.004). Adding folate, B12 and creatinine to the model, homocysteine was still significantly related to white matter atrophy rate (r = 0.27; p = 0.016), and hippocampal atrophy rate (r = 0.22; p = 0.047); however, hippocampal volume was no longer significant (r = −0.19; p = 0.09).
Demographic characteristics of subjects

BP = blood pressure; MMSE = Mini-mental State Examination
Age and serum assays are at study end point. Weight and MMSE are at study start. BP is average between MRI scans.
Imaging characteristics

WM = white matter. GM = gray matter. ICV = intracranial volume.
Correlations between baseline and atrophy rate of gray and white matter and hippocampus, and age, B12, folate, homocysteine and average BP between MRI scans. B12 and homocysteine are log values

Pearson r values are shown with 95% confidence intervals.
*p < 0.05; **p < 0.01
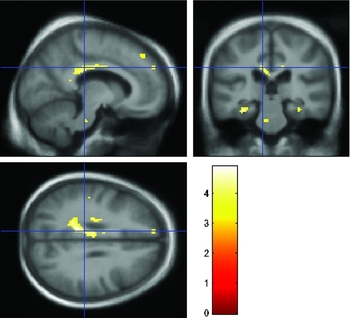
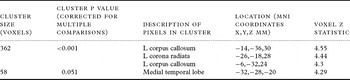
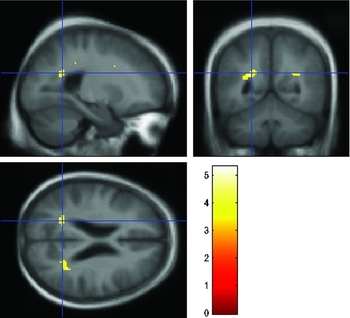
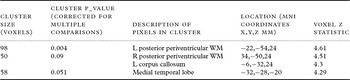
We also used SPM to investigate the location of correlations between homocysteine and gray and white matter loss. Figure 1 and Table 4 show regions where WM atrophy rate correlates with homocysteine, after controlling for age, baseline WML volume and folate levels. Controlling in addtion for B12 and creatinine, the clusters in the corpus callosum and corona radiata were still significant, whereas the medial temporal lobe cluster was not. Figure 2 and Table 5 show regions where WM loss correlates with baseline WML volume. As can be seen, this is in a different region to the homocysteine correlation and concentrated in a common location for WML.
Voxels where white matter atrophy rate shows significant correlation with homocysteine levels after controlling for age, baseline WML volume and folate. Cross-hair location −9 mm, −29 mm, 29 mm. Overlaid on an average T1 weighted brain image.

Significant clusters in SPM analysis of WM loss correlating with HCys, controlling for age, baseline WML volume and folate levels

Voxels where white matter atrophy rate shows significant correlation with baseline WML volume after controlling for age, baseline homocysteine and folate. Overlaid on an average T1 weighted brain image. Cross-hair location −22–54, 24 mm.

Significant clusters in SPM analysis where WM loss correlates with baseline WML volume, controlling for age, folate and Homocysteine

There were no significant clusters where GM loss correlated with homocysteine after controlling for age and folate; however, we investigated change in the hippocampi using a small volume correction (10 mm radius centered on the head of each hippocampus) and found a significant cluster on both hippocampi – see Table 6. When covarying in addition for B12 and creatinine, the right hippocampus cluster is still significant with a small volume correction.
Significant clusters in the SPM analysis where GM loss correlates with homocysteine, controlling for age and folate. Small volume correction (10 mm radius) centered on each hippocampal head

Discussion
We found a strong relationship between homocysteine levels and both white matter and hippocampal rates of atrophy over two years. There was no significant relationship with whole gray matter loss. These findings add weight to previous cross-sectional studies of whole brain and hippocampal volumes.
The white matter loss occurred away from typical locations for WML, and separate from regions of white matter loss correlating with baseline WML. This suggests, in this group at least, that the homocysteine-related atrophy of the white matter is not mediated through WML. This was also observed in the Rotterdam study (den Heijer et al., Reference den Heijer2003) where the relationship between homocysteine and atrophy was not fully explained by WML, and the Framingham study (Seshadri et al., Reference Seshadri2008), which found an association between homocysteine and silent brain infarcts, but not WML. This lack of association may be due to WML not being of purely vascular disease origin, with pathological correlates including fluid accumulation and demyelination. (Fazekas et al., Reference Fazekas1993)
Previous studies have shown an association between high homocysteine levels and hippocampal atrophy, both in normal populations (den Heijer et al., Reference den Heijer2003; Williams et al., Reference Williams, Pereira, Budge and Bradley2002) and in Alzheimer's disease (Clarke et al., Reference Clarke, Smith, Jobst, Refsum, Sutton and Ueland1998). The hippocampus is particularly vulnerable to ischemic injury (Back et al., Reference Back, Hemmen and Schüler2004) and is affected early in the course of Alzheimer's disease, and high homocysteine levels have been associated with phosphorylated tau accumulation (Popp et al., Reference Popp2009). Our findings that homocysteine levels were associated both with baseline and longitudinal atrophy of the hippocampus supports this evidence, pointing to a role of homocysteine in the development of AD.
In line with a number of cross-sectional studies, we did not find a relationship between baseline gray or white matter volume and homocysteine. This is probably due to the number of other determinants of brain volume such as early nutrition and genetic factors (Peper et al., Reference Peper, Brouwer, Boomsma, Kahn and Pol2007) and shows the increased sensitivity of longitudinal studies.
The uniform appearance of white matter on T1 weighted images means that it is not possible to locate atrophy exactly, since atrophy in the center of the white matter will show up as an enlargement of the nearest ventricle. Although gray matter atrophy might also be depicted as ventricular enlargement, it seems likely that the significant relationship is with white matter, since the homocysteine had a significant correlation with the global WM atrophy rate but not GM.
A potential weakness of this study is that homocysteine levels were only measured at the end of the study. However, previous longitudinal studies have found homocysteine levels to be relatively constant over two years (Clarke et al., Reference Clarke, Smith, Jobst, Refsum, Sutton and Ueland1998) and it is unlikely in this population without significant cognitive impairment that the changes in atrophy could have led to cognitive or behavioral changes that modified dietary folate intake. Prospective longitudinal studies of homocsyteine and brain atrophy or cognitive decline would provide useful additional data to establish the causal relationships. Hypothyroidism has been associated both with raised homocysteine levels (Ozmen et al., Reference Ozmen, Ozmen, Parildar, Mutaf, Turgan and Bayindir2006) and cognitive decline (Hogervorst et al., Reference Hogervorst, Huppert, Matthews and Brayne2008), and may possibly have been a confounding factor. Unfortunately we did not measure thyroid stimulating hormone (TSH) levels.
In conclusion, we have shown that rates of atrophy of white matter and hippocampus are related to high levels of homocysteine, independent of vitamin B levels or subject age. This adds to the research showing the neurotoxic effects of homocysteine.
Conflicts of interest
None
Description of authors’ roles
M. J. Firbank analyzed the data and wrote the paper. S.K. Narayan and B. K. Saxby assisted in analysis of the data and writing the paper. G. A. Ford designed the study, and supervised the data collection. J. T. O'Brien designed the study and supervised the data analysis.
Acknowledgments
Dr. Sunil Narayan was funded by the British Council through the Commonwealth Split-site Doctoral Scholarship Scheme. We thank the Astra Research Foundation U.K. and AstraZeneca International for financial support of these studies. This work was supported by the U.K. NIHR Biomedical Research Centre for Ageing and Age-related Disease award to the Newcastle upon Tyne Hospitals NHS Foundation Trust. We gratefully thank Monica Hasrani and Gerry Stansby for providing the homocysteine assays, and Becky Wiseman for assistance in recruitment and patient assessment.