I. INTRODUCTION
There exist more than 70% elements in the periodic table, signifying that plenty of metal oxides with various functionalities could be fabricated.Reference Liu, Zhang, Kim and Park1 One-dimensional (1D) metal oxide nanomaterials including nanowires (NWs) have attracted extensive attention in the past decades because of their superior physical/chemical properties which depend strongly on the diameters, lengths, morphologies, and structures.Reference Li, Yang, Feng, Yuan and Su2,Reference Arafat, Dinan, Akbar and Haseeb3 At the nanoscale, the large specific surface areas and high aspect ratios of NWs will lead to a variety of novel performances compared with those of bulk materials. Therefore, it is of great significance to efficiently control the synthesis processes and thus to fabricate NWs with desired diameters, lengths, morphologies, and structures.Reference Devan, Patil, Lin and Ma4 As a result, various physical and/or chemical strategies have been adopted for the fabrication of 1D metal oxide nanostructures.Reference Filipič and Cvelbar5,Reference Zhang, Zhang, Xu, Yang, Huang, Nie, Liu and Yang6 Up to now, it still remains a great challenge to explore the related mechanisms, which hindered the controllable growth of CuO NWs with required performances and applications.Reference Cao, Jia, Zheng, Zhao, Liu, Li, Zhao, Hu, Gu and Wang7
As a typical p-type semiconductor with a narrow band gap,Reference Filipič and Cvelbar5 1D cupric oxide (CuO, the higher oxide of copper) NWs exhibit excellent properties which guarantee their extensive applications in various fields, such as ion battery,Reference Liu, Cao, Zheng, Sheng, Li, Wu, Liu and Wang8,Reference Tan, Wu, Yuan, Chen, Zhao, Yao, Qian, Liu, Ye, Shahbazian-Yassar, Lu and Amine9 solar energy,Reference Anandan, Wen and Yang10 field emission,Reference Hsieh, Chen, Lin and Shih11 catalyst,Reference Feng and Zheng12 and sensor.Reference Liu, Yang, Chen and Jia13,Reference Zappa, Comini, Zamani, Arbiol, Morante and Sberveglieri14 Recently, Sheng et al.Reference Sheng, Zheng, Jia, Li, Cao, Wu, Han, Liu, Zhao and Wang15 reported extremely high mechanical strength and anelasticity in 1D CuO bicrystals. Consequently, various strategies have been applied for the synthesis of 1D CuO NWs, like hydrothermal method,Reference Cao, Hu, Wang, Guo, Guo and Wang16,Reference Shrestha, Sorensen and Klabunde17 solid-state conversion,Reference Liu, Zhang, Kang, Wu and Wang18,Reference Fan, Liu, Du, Lu, Pang and Gao19 chemical precipitation,Reference Wang, Wang, Shi and Liang20,Reference Ethiraj and Kang21 electrochemical process,Reference Toboonsung and Singjai22,Reference Mukherjee, Show, Maji, Madhu, Bhar, Mitra, Khan and Mondal23 and thermal oxidation.Reference Cao, Jia, Zheng, Zhao, Liu, Li, Zhao, Hu, Gu and Wang7,Reference Jiang, Herricks and Xia24 Among these synthesis approaches, thermal oxidation is the most widely used method due to its simplicity, low-cost, high crystallinity, convenience for morphology control, and suitability for industrial production.Reference Zhang, Zhang, Xu, Yang, Huang, Nie, Liu and Yang6
The growth processes of CuO NWs via thermal oxidation of copper have attracted remarkable attention, and the number density, diameter, and aspect ratio of CuO NWs have been extensively studied under different growth parameters, i.e., annealing temperature, annealing time, and gaseous environment. Various growth mechanisms, such as vapor liquid solid (VLS) and vapor solid (VS) processes,Reference Jiang, Herricks and Xia24 self-catalyzed growth,Reference Hsieh, Chen, Lin and Shih25 stress-induced growth,Reference Kumar, Srivastava, Tiwari and Nandedkar26 and stress grain boundary (GB) diffusion,Reference Gonçalves, Campos, Ferlauto and Lacerda27 have been proposed since Jiang et al.Reference Jiang, Herricks and Xia24 synthesized scalable CuO NWs via thermal oxidation of copper substrates. However, the mechanisms still remain controversial when explaining the various microstructures of NWs, the temperature-dependent growth, and the influence of oxygen flow rates. Subsequently, Cao et al.Reference Cao, Jia, Zheng, Zhao, Liu, Li, Zhao, Hu, Gu and Wang7 investigated the influence of oxygen flow rates on CuO NW growth and demonstrated a novel oxygen concentration gradient model which seems to be relevant to the growth mechanism.
Understanding the mechanisms is crucial to optimize the growth conditions and thus to achieve the desired sizes, morphologies, and structures of CuO NWs. However, the growth processes and the corresponding mechanisms reported in literature studies are somewhat divergent and equivocal.Reference Zhang, Zhang, Xu, Yang, Huang, Nie, Liu and Yang6 There are several reviews in regard to the growth of CuO NWs via thermal oxidation of copper. For example, Mimura et al.Reference Mimura, Lim, Isshiki, Zhu and Jiang28 reviewed the oxidation kinetics of copper at 350–1050 °C, Filipič et al.Reference Filipič and Cvelbar5 concluded the growth methods of CuO NWs, and Zhang et al.Reference Zhang, Zhang, Xu, Yang, Huang, Nie, Liu and Yang6 presented a comprehensive review on the synthesis, characterizations, growth mechanisms, properties, and applications of various CuO nanostructures. But they did not focus on the deep understanding of the CuO NW growth mechanism via thermal oxidation, which needs systematic analysis. Recently, Cao et al.Reference Cao, Jia, Zheng, Zhao, Liu, Li, Zhao, Hu, Gu and Wang7 proposed a novel “oxygen concentration gradient” growth mechanism, which might also be very inspiring for the fabrication of other nanostructures in gaseous atmosphere.
Additionally, plenty of metals are susceptible to oxidation, which has impeded the wide applications and also caused huge wastes/costs due to the corrosion of metals in oxidizing atmosphere.Reference Zhang29–Reference Yu, Zhang and Han31 Therefore, many attempts (both experimentalReference Zheng, Wu, Sheng, Liu, Liu, Cao, Zhou, Zhao, Zhao and Wang32–Reference Wang, Fan, Zhou and Thompson34 and theoreticalReference Bungaro, Noguera, Ballone and Kress35,Reference Francis and Taylor36 ) have been done to explore the oxidation (or metal oxide growth) mechanisms. Generally, the metal oxidation process can be divided into three stages: dissociation of absorbed oxygen, oxide nucleation, and bulk oxide formation.Reference Francis and Taylor36,Reference Zhou, Luo, Li, Ciston, Stach and Yang37 It is worth noting that the coverage of bulk oxide on the surface can serve as a passivating layer against further oxidationReference Atkinson and Taylor38 because metal and/or oxygen ions should cross the oxide film to continue the oxidation.Reference Francis and Taylor36,Reference Lawless39,Reference Atkinson40 As a result, the growth of oxide which is, however, ignored by most researchers compared with extensive investigations of the early stages of oxidation (from oxygen dissociation to oxide nucleation),Reference Bungaro, Noguera, Ballone and Kress35,Reference Francis and Taylor36,Reference Schröder, Fasel and Kiejna41 is also of great significance for improving the resistance to oxidation.
In this context, a review focusing on the growth/oxidation mechanisms is desperately demanded to facilitate the basic understandings and developments of thermal oxidation growth. This review aims to offer a critical discussion about the growth behaviors and mechanisms of CuO NWs via thermal oxidation of copper substrates. First, the effects of growth parameters on the synthesis of CuO NWs are briefly introduced for basic understanding. Subsequently, the corresponding growth mechanisms are explored based on various experimental results, especially for the newly suggested “oxygen concentration gradient” growth model. This work could not only contribute to the controllable fabrication of CuO NWs and their related applications but also facilitate the basic understandings of growth mechanisms via thermal oxidation.
II. GROWTH OF CuO NWS UNDER DIFFERENT CONDITIONS
The synthesis technologies of nanomaterials with various applications have been widely explored because of their fundamental importance to the nanostructures and properties. Particularly, for 1D nanomaterials, the structural parameters including the diameter, length, morphology, crystallinity, and domain structure, which determine the practical properties, could be modulated by the fabrication technologies. As a result, plenty of studies have been done to optimize the growth of 1D CuO nanomaterials for better control of the nanostructures. For instance, Wang et al.Reference Wang, Wang, Shi and Liang20 synthesized ultralong CuO NWs with very small diameters (less than 15 nm) by precipitation of Cu(OH)2 NWs at room temperature. The sub-15 nm ultralong CuO NWs exhibited strong quantum size confinement and enhanced photocatalytic activity. Nevertheless, the fabrication of CuO NWs by thermal oxidation is outstanding compared with other methods (e.g., chemical precipitation, solid-state thermal conversion, and electrical–chemical and hydrothermal methods) due to its profound advantages, such as low-cost, simplicity, high crystallinity, and suitability for large-scale production.Reference Zhang, Zhang, Xu, Yang, Huang, Nie, Liu and Yang6 In this section, the growth of CuO NWs via thermal oxidation of the copper substrate is presented, and the dependences of the NW size, morphology, and structure on synthesis parameters (annealing temperature and time, gaseous ambient, and Cu substrate) are discussed.
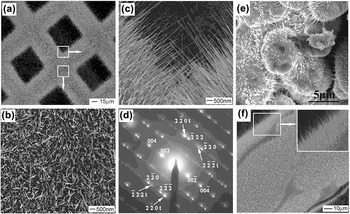
The growth of CuO whiskers via thermal oxidation of copper can date back to the 1950s when Tylecote investigated the oxidation of copper at temperatures from 200 to 800 °C.Reference Tylecote42 However, little attention has been paid to this growth method until 2002 when Jiang et al.Reference Jiang, Herricks and Xia24 fabricated scalable CuO NWs merely by heating copper substrates at elevated temperatures in air atmosphere. As shown with the scanning electron microscopy (SEM) images and the selected area electron diffraction (SAED) pattern in Figs. 1(a)–1(d), the NWs exhibit very high number density, uniform diameters, high aspect ratio, and very good crystallinity. Generally, the CuO NWs can be fabricated simply by annealing Cu substrates for several minutes to dozens of hours, in the temperature range from 400 to 700 °C under air atmosphere.Reference Jiang, Herricks and Xia24 The shape of copper substrates could be powderReference Yang, Guo, Zhou, Zou and Liang43 [Fig. 1(e)], wireReference Jiang, Herricks and Xia24,Reference Vanithakumari, Shinde and Nanda44 [Fig. 1(f)], gridReference Liu, Cao, Zheng, Sheng, Li, Wu, Liu and Wang8,Reference Jiang, Herricks and Xia24,Reference Sheng, Zheng, Cao, Wu, Li, Liu, Zhao and Wang45 [Fig. 1(a)], or foilReference Sheng, Zheng, Jia, Li, Cao, Wu, Han, Liu, Zhao and Wang15,Reference Gonçalves, Campos, Ferlauto and Lacerda27 (Fig. 2), which shows no obvious impact on the growth of CuO NWs and thus makes it more convenient for the synthesis of CuO NWs. Moreover, Zhang et al.Reference Zhang, Rossi, Tenailleau, Alphonse and Chane-Ching46 deposited a layer of copper film on the silicon substrate and also synthesized large scale and aligned CuO NWs via thermal oxidation. Afterward, Hsu et al.Reference Hsu, Tsai and Hsueh47 assembled humidity and ethanol sensors of CuO NWs grown on the copper-coated silicon arrays. These results indicate a flexible assembly of CuO NWs into microdevices and potential applications in the micro/nano-electromechanical systems.
SEM images of CuO NWs fabricated with copper grids in air at 500 °C for (a–c) 4 h and (d) corresponding SAED patternReference Jiang, Herricks and Xia24; SEM images of CuO NWs grown on (e) Cu powder particlesReference Yang, Guo, Zhou, Zou and Liang43 and (f) Cu wires.Reference Jiang, Herricks and Xia24 Reprinted with permission from Ref. Reference Jiang, Herricks and Xia24 (American Chemical Society) and Ref. Reference Yang, Guo, Zhou, Zou and Liang43 (Elsevier).

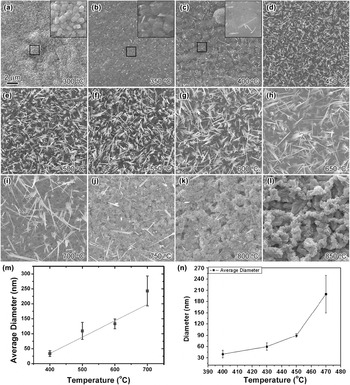
(a–l) SEM images of Cu substrate surfaces after annealed at various temperatures for 1 h under air ambient.Reference Cao, Jia, Zheng, Zhao, Liu, Li, Zhao, Hu, Gu and Wang7 Average diameters of CuO NWs as a function of various annealing temperatures: (m) Linear relationshipReference Gonçalves, Campos, Ferlauto and Lacerda27; (n) Parabolic relationship.Reference Zhong, Zeng, Liu, Yu, Zhong and Qiu48 Reprinted with permission from Ref. Reference Cao, Jia, Zheng, Zhao, Liu, Li, Zhao, Hu, Gu and Wang7 (American Physical Society), Ref. Reference Gonçalves, Campos, Ferlauto and Lacerda27 (AIP Publishing), and Ref. Reference Zhong, Zeng, Liu, Yu, Zhong and Qiu48 (Elsevier).

Recently, Cao et al.Reference Cao, Jia, Zheng, Zhao, Liu, Li, Zhao, Hu, Gu and Wang7 investigated the growth of CuO NWs under different annealing temperatures (from 300 to 850 °C), and one can see that the following [Figs. 2(a)–2(l)]: (i) scalable CuO NWs are created merely within the temperature range of 400–700 °C, while the growth will be suppressed at lower (<400 °C) or higher (>700 °C) temperaturesReference Jiang, Herricks and Xia24,Reference Kumar, Srivastava, Tiwari and Nandedkar26,Reference Gonçalves, Campos, Ferlauto and Lacerda27 ; (ii) the number density of CuO NWs is much higher at intermediate temperatures (500–600 °C)Reference Kumar, Srivastava, Tiwari and Nandedkar26,Reference Gonçalves, Campos, Ferlauto and Lacerda27 ; (iii) the diameters of CuO NWs become larger with the increase of annealing temperatures.Reference Gonçalves, Campos, Ferlauto and Lacerda27,Reference Zhong, Zeng, Liu, Yu, Zhong and Qiu48 Similarly, Gonçalves et al.Reference Gonçalves, Campos, Ferlauto and Lacerda27 demonstrated an approximately linear relationship (d ∝ T) between diameter (d) and temperature (T), while a parabolic relationship (d ∝ T 2) fits better within a smaller temperature range,Reference Zhong, Zeng, Liu, Yu, Zhong and Qiu48 as shown in Figs. 2(m) and 2(n), respectively. In spite of the different fitting equations, it is widely accepted that the diameters of CuO NWs increase with higher growth temperatures, and thus the diameters can be easily controlled. Nevertheless, more detailed work should be done in future to figure out the exact relationship between annealing temperatures and CuO NW diameters for a better understanding and controlling of the NW growth.
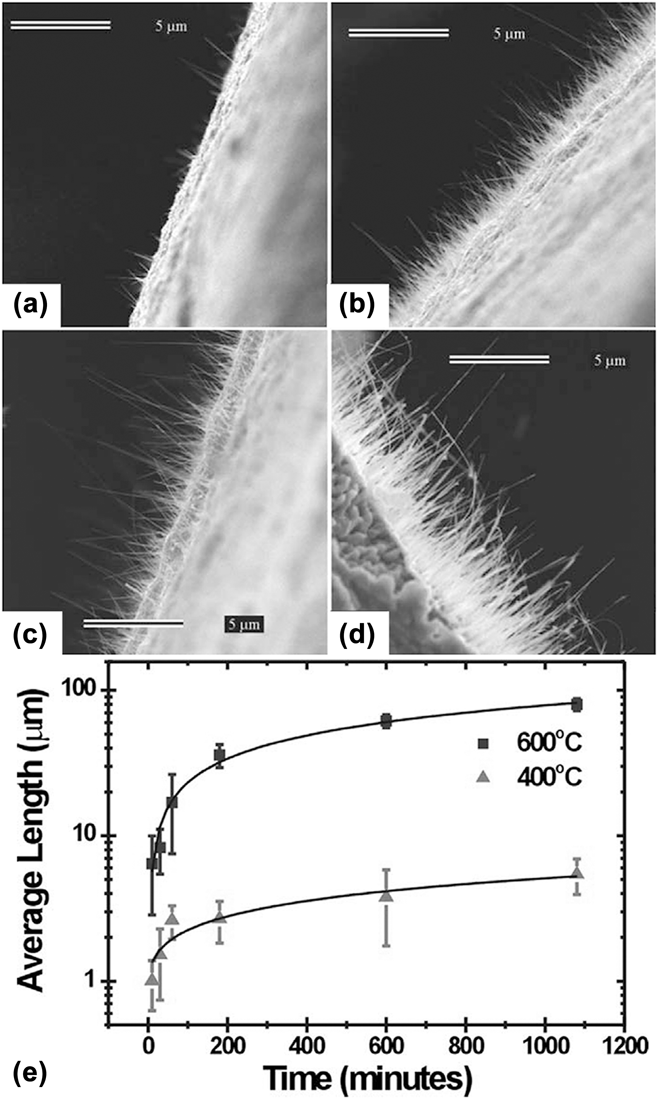
The influence of annealing time on CuO NW growth has also been extensively investigated and well establishedReference Kumar, Srivastava, Tiwari and Nandedkar26,Reference Gonçalves, Campos, Ferlauto and Lacerda27,Reference Kaur, Muthe, Despande, Choudhury, Singh, Verma, Gupta and Yakhmi49 : (i) the CuO NW number density increases with prolonged annealing time; (ii) the CuO NWs become longer as they keep growing, while (iii) the diameter stays almost unchanged under different annealing times. As presented in Fig. 3,Reference Gonçalves, Campos, Ferlauto and Lacerda27 it is obvious that both the number density and length of CuO NWs increase with longer oxidation time [Figs. 3(a)–3(d)] and the relationship between average length (l) and the annealing time (t) can be fitted using a parabolic function [ $l \propto \sqrt t$, Fig. 3(e)]. It is worth noting that the CuO NWs grow faster at higher temperature [Fig. 3(e), and one can see that the lengths of CuO NWs grown at 600 °C are much greater than those of 400 °C]. Kumar et al.Reference Kumar, Srivastava, Tiwari and Nandedkar26 also found that the length increased with the extension of growth time. As a result, the diameter, aspect ratio (l/d), and number density of CuO NWs can be effectively controlled with the annealing time and temperature.
(a–d) SEM images corresponding to 10 min, 1 h, 3 h, and 10 h, respectively. (e) Average lengths of CuO NWs as a function of annealing time at 400 °C (triangle) and 600 °C (square), which could be fitted using a parabolic function.Reference Gonçalves, Campos, Ferlauto and Lacerda27 Reprinted with permission from Ref. Reference Gonçalves, Campos, Ferlauto and Lacerda27 (AIP Publishing).

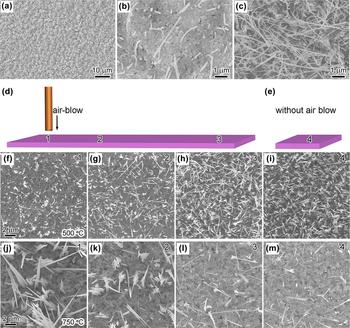
In addition to annealing temperature and time, ambient atmosphere is another important factor for the growth of CuO NWs by thermal oxidation. For example, Xu et al.Reference Xu, Woo and Shi50 studied the CuO NW growth under various gaseous environments [at 400 °C for 4 h, Figs. 4(a)–4(c)] and found that the density of NWs created under pure oxygen atmosphere was much higher than that grown in air environment [Figs. 4(b) and 4(c)], while few NWs were formed in nitrogen [Fig. 4(a)]. Besides, the diameters of CuO NWs grown in pure oxygen are obviously smaller than those grown in air. Meanwhile, Kumar et al.Reference Kumar, Srivastava, Tiwari and Nandedkar26 investigated the effects of oxygen flow rates on CuO NW growth at constant annealing temperature (500 °C) and time (30 min). They found that the growth of CuO NWs was suppressed under a very low oxygen flow rate (35 mL/min) compared with the growth in air ambient due to the lack of oxygen to sustain the oxidation. Then the number density became much higher when the flow rate increased to 150 mL/min. However, after further increasing the flow rate to 300 mL/min, the growth was suppressed again and few CuO NWs are produced with a flow rate of 500 mL/minReference Kumar, Srivastava, Tiwari and Nandedkar26 Based on an intuitive understanding, increasing oxygen supply should lead to a promotion of CuO NW growth because the formation of CuO requires both copper and oxygen, as proved by Xu et al [Figs. 4(a)–4(c)]. However, Kumar et al.Reference Kumar, Srivastava, Tiwari and Nandedkar26 revealed an interesting result, i.e., excessive oxygen supply may suppress the growth of CuO NWs.
SEM images of CuO NWs formed at 400 °C for 4 h, under different atmospheresReference Xu, Woo and Shi50: (a) No NWs in nitrogen; (b) Low number density in air; (c) High number density in pure oxygen. (d and e) Schematic illustration presenting the Cu foil (pink plate) annealed with and without extra air supply; (f–h) and (j–l) are SEM images of CuO NWs fabricated at 500 °C and 750 °C, respectively, obtained from positions “1–3” (suffering the extra air supply which decreases gradually from “region 1” toward “region 3”) with extra air supply in (d); (i and m) SEM images without extra air supply (region “4”), as presented in (e).Reference Cao, Jia, Zheng, Zhao, Liu, Li, Zhao, Hu, Gu and Wang7 Reprinted with permission from Ref. Reference Xu, Woo and Shi50 (Elsevier) and Ref. Reference Cao, Jia, Zheng, Zhao, Liu, Li, Zhao, Hu, Gu and Wang7 (American Physical Society).

As a result, Cao et al.Reference Cao, Jia, Zheng, Zhao, Liu, Li, Zhao, Hu, Gu and Wang7 investigated the influences of oxygen/air supply under different annealing temperatures and found that the number density is lowest at “region 1” [Fig. 4(f), suffering the extra air supply] and increases gradually toward “region 3” [Figs. 4(g) and 4(h), with less influence from the air flow] at lower temperature (500 °C), while at higher temperature (750 °C), the number density decreases gradually from region “1” to “3” [Figs. 4(j)–4(l)]. After systematically studying the influence of air supply (oxygen supply) on CuO NW growth at various temperatures (see the supporting information in Ref. Reference Cao, Jia, Zheng, Zhao, Liu, Li, Zhao, Hu, Gu and Wang7), it can be concluded that extra air supply would suppress and assist NW growth at lower (<700 °C) and higher (≥700 °C) temperatures, respectively. Finally, the NW growth temperature is extended to 800 °C with extra air supply, and remarkable two-dimensional CuO nanosheets are fabricated for the first time via direct thermal oxidation, as exhibited in Figs. 5(a) and 5(b). These results are in accordance with the reports from the work of Kumar et al.,Reference Kumar, Srivastava, Tiwari and Nandedkar26 and it can be inferred that the impacts of oxygen supply (or oxygen flow rate) are related to the annealing temperatures.
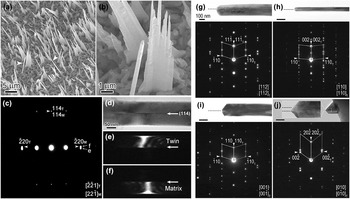
(a and b) SEM images of the CuO NWs and nanosheets fabricated at 800 °C with extra air flow rate of 50 ± 5 sccm.Reference Cao, Jia, Zheng, Zhao, Liu, Li, Zhao, Hu, Gu and Wang7 (c–f) Corresponding SAED pattern, bright and dark field (B/DF) images of a NW grown at 800 °C.Reference Cao, Jia, Zheng, Zhao, Liu, Li, Zhao, Hu, Gu and Wang7 (g–j) BF images and corresponding SAED patterns revealing four twin structures.Reference Sheng, Zheng, Jia, Li, Cao, Wu, Han, Liu, Zhao and Wang15 Reprinted with permission from Ref. Reference Cao, Jia, Zheng, Zhao, Liu, Li, Zhao, Hu, Gu and Wang7 (American Physical Society) and Ref. Reference Sheng, Zheng, Jia, Li, Cao, Wu, Han, Liu, Zhao and Wang15 (IUCr, https://doi.org/10.1107/S1600576716001461).

The diameters of CuO NWs are in the range of tens to hundreds of nanometers and the length can reach several tens of micrometers, which mainly depend on the annealing temperature and time, respectively. Interestingly, even under the same growth conditions, the shape of CuO NWs could be cylindrical with uniform diameters or cone-shapedReference Kaur, Muthe, Despande, Choudhury, Singh, Verma, Gupta and Yakhmi49 which gets thinner toward the tip, as indicated with two white arrowheads in Fig. 5(a), respectively. Moreover, except for single crystals, the NWs exhibit various bicrystalline structures.Reference Tu, Chang, Wang, Fang, Huang, Li, Chang, Lu, Chen, Wang, Tzeng and Liu51 As revealed in Figs. 5(c)–5(f), there exists a (114) twinning structure in the NWs grown at 800 °C. Besides, Sheng et al.Reference Sheng, Zheng, Jia, Li, Cao, Wu, Han, Liu, Zhao and Wang15 investigated the microstructure of CuO NWs fabricated at 400 °C for 3–5 h under air environment and found four different twinning structures [Figs. 5(g)–5(j)], as well as single crystalline NWs. Generally, the twin boundaries locate at the center of CuO NWs and run through the NWs along axial direction. Experimental results indicate that the shapes/morphologies and microstructures of NWs are not directly dependent on the annealing parameters, which will be discussed later in Sec. III.
Lastly, but equally important, the grain size in the copper substrate also plays an important role in CuO NW growth. For example, Han et al.Reference Han, Lu, Zhang, Yang, Wang and Lu52 compared the growth behavior of nanocrystalline and coarse-grain copper substrates and found that the growth of CuO NWs was enhanced when annealing the nanocrystalline Cu substrate. Specifically, CuO NWs with much higher number density and aspect ratio (longer and thinner NWs) were obtained from the nanocrystalline Cu substrate, while there was no obvious change in the crystalline structures.Reference Hansen, Chan, Lu, Lu and Chen53 Besides, other factors (such as surface morphologyReference Yuan and Zhou54 and microshapeReference Shao, Deng, Chen and Xu55 of the Cu substrate, and external electric fieldReference Li, Zhang, Yuan, Liao and Pan56), which may affect the CuO NW nucleation or Cu ion diffusion, could also have remarkable influences on the growth of CuO NWs. However, these factors are more difficult to control and not generally considered for CuO NW synthesis compared with other parameters (i.e., the annealing temperature, time, atmosphere, and Cu grain size). Therefore, for simplicity, they are not described in detail in this part and will be introduced again for the discussion of CuO NW growth mechanisms in Sec. III.
Additionally, the existence of other oxidizing gases (e.g., CO2 or H2OReference Wang and Cho57) in the ambient atmosphere could also have impacts on the NW growth, and there exists other similar strategies based on oxidation processes to create CuO NWs from Cu substrates, such as flame synthesis,Reference Rao and Zheng58 electric current heating,Reference Simas, Albert, Hua, Ying, Victor, Jani, Elena, Sofia, Alexander and Esko59 and oxygen plasma oxidation.Reference Filipič, Baranov, Mozetič and Cvelbar60,Reference Altaweel, Filipič, Gries and Belmonte61 For example, Simas et al.Reference Simas, Albert, Hua, Ying, Victor, Jani, Elena, Sofia, Alexander and Esko59 synthesized various metal oxide NWs (i.e., CuO, Fe2O3, V2O5, and ZnO) based on the electrical heating of pure metals in air atmosphere, and scalable NWs with a length of 1–5 μm and diameters from 10 to 50 nm were fabricated within 3 min. Although different gaseous conditions and heating strategies may have unique impacts on NW growth, this review is focused on the growth of CuO NWs by annealing copper substrates under air/oxygen atmosphere and thus provides critical discussion on the related NW growth mechanisms.
III. CuO NW GROWTH MECHANISMS
Despite the extensive investigation of the growth behaviors of CuO NWs, the related mechanisms still remain controversial, which hindered the modulation of CuO nanostructures during the NW generation processes. The Cu ion vapor could be neglected because the NW growth temperatures (e.g., 400 °C) are much lower than the corresponding melting temperatures (above 1000 °C). As a result, more attention has been paid to the solid-state diffusion of Cu ions from inside toward surface of the copper substrate, while the oxygen in gaseous ambient did not attract equal attention although oxygen supply is also vital for CuO NW growth. In this section, different CuO NW growth mechanisms are discussed and concluded in the order roughly according to historical research progresses.
A. VLS and VS
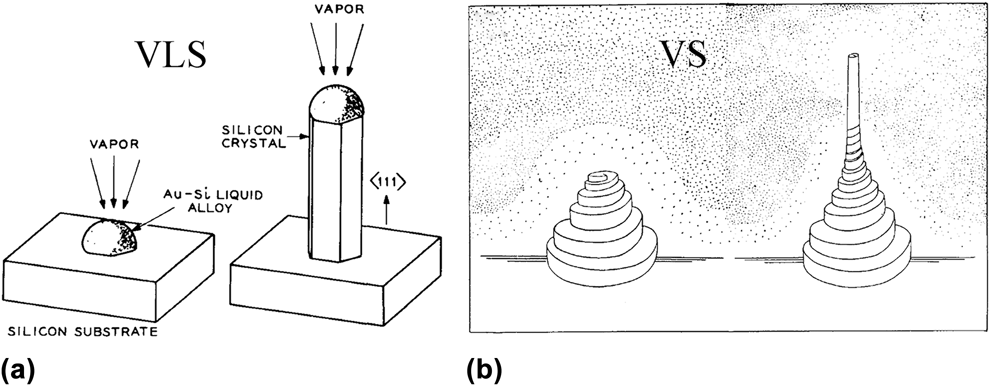
The VLS and VS models are well-established growth mechanisms for 1D nanostructures, such as NWs, under gaseous environments. In 1964, Wagner and EllisReference Wagner and Ellis62 proposed the VLS model [Fig. 6(a)]: a droplet absorbs and condenses the material vapor to a super-saturation level, and then the material nucleates at the liquid–solid interface to sustain the growth of nanostructures. As a result, the VLS mechanism is featured with an extra droplet at the NW tip. However, there is no foreign droplet at the tip of CuO NWs (Figs. 1–5), implying that the VLS model cannot be applied to current situation. Therefore, the VS mechanism which includes direct deposition of the gaseous components onto substrates to form 1D nanostructures [Fig. 6(b)Reference Brenner and Sears63] seems to be a possible explanation for the growth of CuO NWs.Reference Jiang, Herricks and Xia24
Schematic illustrations of (a) VLSReference Wagner and Ellis62 and (b) VS growth mechanisms.Reference Brenner and Sears63 Reprinted with permission from Ref. Reference Wagner and Ellis62 (AIP Publishing) and Ref. Reference Brenner and Sears63 (Elsevier).

Unfortunately, the melting temperatures of Cu, Cu2O, and CuO are 1085, 1243, and 1326 °C,Reference Filipič and Cvelbar5 respectively, which are much higher than the NW growth temperature (e.g., 400 °C), and thus the corresponding vapor pressures are too low to maintain the growth of CuO NWs.Reference Kaur, Muthe, Despande, Choudhury, Singh, Verma, Gupta and Yakhmi49 Moreover, the VS model should lead to extra deposition of CuO onto the quartz tube and mass reduction of the Cu substrate, which are denied by the experiment results.Reference Kaur, Muthe, Despande, Choudhury, Singh, Verma, Gupta and Yakhmi49 Therefore, Cu ion supply is not likely through the gaseous ambient, and the growth mechanism of CuO NWs via thermal oxidation of the copper substrate cannot adopt the VS model. Additionally, the self-catalytic modelReference Hsieh, Chen, Lin and Shih25 is also insufficient to explain NW growth because the annealing temperature is not high enough to create Cu islands which facilitate NW growth.Reference Kaur, Muthe, Despande, Choudhury, Singh, Verma, Gupta and Yakhmi49
B. Stress-induced diffusion of Cu ions
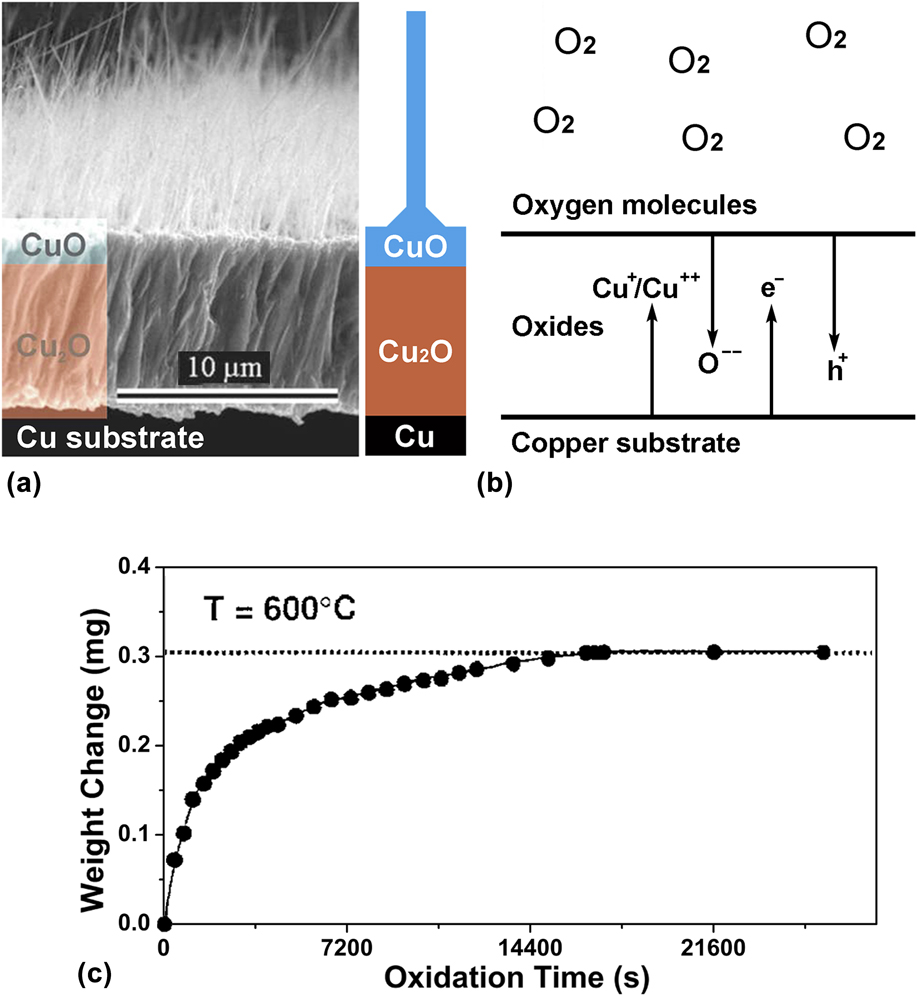
Since the existence of “vapor” was excluded for CuO NW growth, more attention has been paid to the oxidation processes of the Cu substrate in the past decade. Hitherto, most of the experimental results demonstrated a consistent three-layer structure “Cu/Cu2O/CuO” beneath the CuO NWs.Reference Gonçalves, Campos, Ferlauto and Lacerda27 As presented in Fig. 7(a), there always exists a Cu2O interlayer which is much thicker than the CuO outer-layer. Apart from the CuO NWs, Wagner theory can be adopted to explain the growth of Cu2O and CuO layers during oxidation.Reference Lawless39,Reference Atkinson40 After the formation of an original oxide film, the subsequent thickening of Cu2O and CuO layers is sustained by the inward diffusion of oxygen ions and/or outward diffusion of copper ions [Fig. 7(b)Reference Atkinson40]. As the oxide layer gets thicker, the ions will travel longer distance to continue the reaction, which results in a slower oxidation rate and a typical parabolic growth kinetics of Cu2O/CuO layers as shown in Fig. 7(c).Reference Park and Natesan64 Moreover, Kuar et al.Reference Kaur, Muthe, Despande, Choudhury, Singh, Verma, Gupta and Yakhmi49 found that few CuO NWs were generated when annealing the Cu2O substrate under similar conditions, implying that copper substrates and/or Cu/Cu2O interfaces are necessary for CuO NW growth.
(a) Cross-sectional view of the copper oxides after annealed at 400 °CReference Gonçalves, Campos, Ferlauto and Lacerda27; (b) Transportation of ions and electrons across the oxides; (c) Typical relationship between weight gain and oxidation time during the thermal oxidation of pure Cu in flowing oxygen at 600 °C.Reference Park and Natesan64 Reprinted with permission from Ref. Reference Gonçalves, Campos, Ferlauto and Lacerda27 (AIP Publishing) and Ref. Reference Park and Natesan64 (Springer Nature).

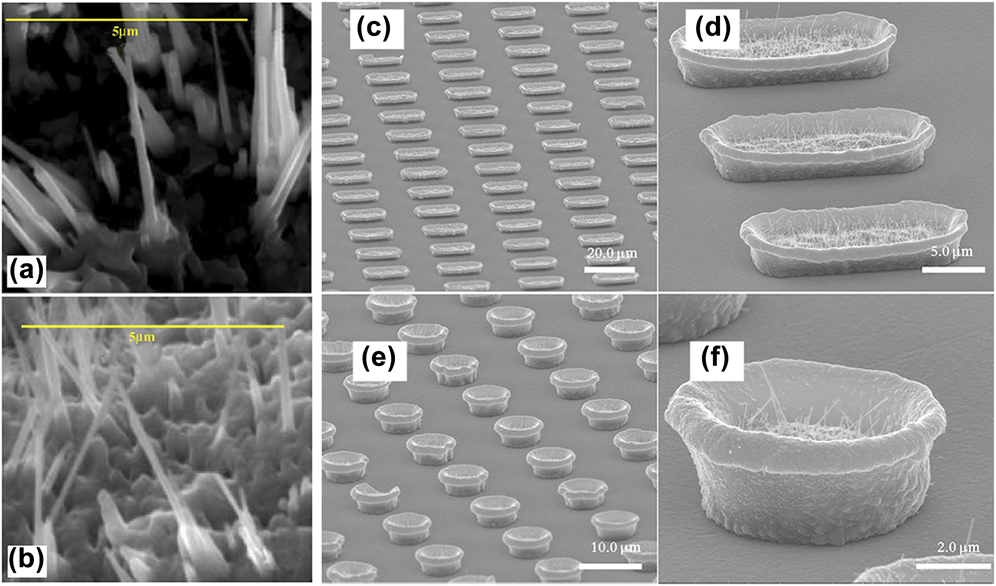
At elevated temperatures, copper ions diffuse outwards very fast, and Cu2O grows at the Cu2O/CuO interface by the reaction Cu(ion) + CuO → Cu2O (reaction 1), while CuO forms at the CuO/O2 interface based on 2Cu(ion) + O2 → 2CuO (reaction 2).Reference Zhu, Mimura and Isshiki65 As a result, the transformation of the CuO layer into Cu2O layer at the Cu2O/CuO interface via reaction 1, and the continuous growth of the CuO layer at the substrate surface by reaction 2 will lead to direct contact of CuO NW roots with the Cu2O/CuO interface and burying of CuO NWs, respectively, as proved by the cross-sectional SEM images.Reference Yuan, Wang, Mema and Zhou66 Correspondingly, the growth rate of Cu2O is dominated by the diffusion of copper ions through the Cu2O layer, and the diffusion across the CuO layer determines the CuO layer growth rate. The out-diffusion of copper ions could be further enhanced by the lattice stress induced by the lattice/volume mismatches at Cu/Cu2O and Cu2O/CuO interfaces. Therefore, a “stress-induced diffusion” growth mechanismReference Lu, Wang, Zheng, Zhao, Wang and Gui67 is proposed: the stress can be relaxed through the formation of small CuO crystallites, from which CuO NWs start to grow [Figs. 8(a) and 8(b)].Reference Kaur, Muthe, Despande, Choudhury, Singh, Verma, Gupta and Yakhmi49 As proved by Kumar et al.Reference Kumar, Srivastava, Tiwari and Nandedkar26 who carefully investigated the growth processes of CuO NWs, CuO “nanogranules” with three-dimensional triangular pyramid morphologies were nucleated and then grew into NWs.
(a) and (b) SEM images of bottom CuO NWs, revealing the growth of NWs from larger crystallites.Reference Kaur, Muthe, Despande, Choudhury, Singh, Verma, Gupta and Yakhmi49 SEM images of CuO NWs grownReference Shao, Deng, Chen and Xu55 in (c and d) microboats and (e and f) microbowls, respectively, under air environment. Reprinted with permission from Ref. Reference Kaur, Muthe, Despande, Choudhury, Singh, Verma, Gupta and Yakhmi49 (Elsevier) and Ref. Reference Shao, Deng, Chen and Xu55 (Springer Nature, https://doi.org/10.1186/1556-276X-6-86).

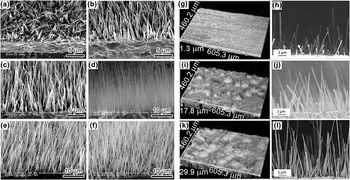
To further study the “stress-induced ion-diffusion” mechanism, many ingenious experiments were designed. For example, Shao et al.Reference Shao, Deng, Chen and Xu55 found that CuO NWs only grew in the inner sides of microcontainers where endured much greater compressive stress due to the volume expansion during oxidation [Figs. 8(c)–8(f)]. The result verifies that stress is an essential factor for CuO NW growth. Li et al.Reference Li, Zhang, Yuan, Liao and Pan56 explored the effects of electric fields on CuO NW growth by adding extra electric voltages which could facilitate/hinder the out-diffusion of Cu ions. As presented in Figs. 9(a)–9(f), the length and number density of CuO NWs increased with higher electric field intensities, which directly testified the significant effect of copper ion diffusion on the CuO NW growth.Reference Farbod, Meamar Ghaffari and Kazeminezhad68 Hereafter, Yuan et al.Reference Yuan and Zhou54 investigated the influence of surface roughness on the growth of CuO NWs by exerting sandblasting onto Cu substrate surfaces. As shown in Figs. 9(g)–9(l), one can see that both number density and length of CuO NWs are remarkably promoted by increasing the surface roughness (more nanogranules), which is consistent with the formation of “nanogranules” before NW growth.Reference Kumar, Srivastava, Tiwari and Nandedkar26 As a result, the “stress-induced Cu ion diffusion” is relevant for the nucleation and growth of CuO NWs.Reference Kaur, Muthe, Despande, Choudhury, Singh, Verma, Gupta and Yakhmi49,Reference Shao, Deng, Chen and Xu55,Reference Chen, Zhang, Wang, Zhang, Miao, Fan, Yan and Yan69
(a–f) SEM images of CuO NWs under various electric fieldsReference Li, Zhang, Yuan, Liao and Pan56: 0, 1000, 2000, 3000, 4000, and 5000 V/m, respectively. (g, i, and k) Three-dimensional surface images showing the morphologies after sandblasted for 0 s, 3 s, and 9 s, respectively. (h, j, and l) Corresponding SEM images revealing the CuO NW growth.Reference Yuan and Zhou54 Reprinted with permission from Ref. Reference Li, Zhang, Yuan, Liao and Pan56 (AIP Publishing) and Ref. Reference Yuan and Zhou54 (Electrochemical Society).

C. Stress-induced GB diffusion
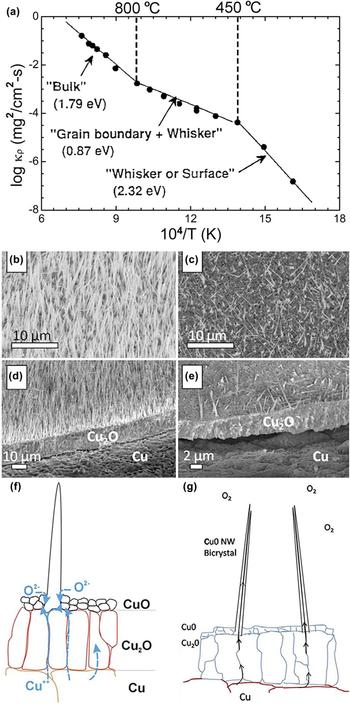
According to the “stress-induced diffusion” mechanism, the growth of CuO NWs is expected to be further promoted under higher temperatures owing to enhanced Cu ion diffusion. On the contrary, the growth is remarkably suppressed when the annealing temperature exceeds 700 °C. Park and NatesanReference Park and Natesan64 studied copper oxidation rates under different temperatures and concluded that copper ion diffusions through lattices, GBs, and surfaces were the rate-determining steps at high (>800 °C), intermediate (450–800 °C), and low temperatures (<450 °C),Reference Mimura, Lim, Isshiki, Zhu and Jiang28 respectively, as shown in Fig. 10(a). Hereafter, Han et al.Reference Han, Lu, Zhang, Yang, Wang and Lu52 compared the oxidation behaviors of nano- and coarse-grain copper substrates at different annealing temperatures in air atmosphere. It was found that at intermediate temperatures, the oxidation rate of nanograin copper was much higher than that of the coarse-grain copper due to the faster ion diffusion along GBs,Reference Atkinson40 while at higher/lower temperatures, the difference disappeared because of the ineffectiveness of GB diffusion. These results further verified the GB dominated diffusion at intermediate temperatures.
(a) Plot of the parabolic rate constants (k p) under various temperatures for the growth of Cu2O/CuO layers.Reference Park and Natesan64 SEM images of CuO NWs grown from (b) surface-treated and (c) nontreated; (d and e) Corresponding cross-sectional images, respectively.Reference Hansen, Chan, Lu, Lu and Chen53 (f) Schematic illustration of the stress-induced GB diffusion of Cu ions in the substrateReference Gonçalves, Campos, Ferlauto and Lacerda27; (g) Further diffusion along CuO NW GBs.Reference Hansen, Chan, Lu, Lu and Chen53 Reprinted with permission from Ref. Reference Park and Natesan64 (Springer Nature), Ref. Reference Hansen, Chan, Lu, Lu and Chen53 (Elsevier), and Ref. Reference Gonçalves, Campos, Ferlauto and Lacerda27 (AIP Publishing).

Interestingly, CuO NWs are grown only within the intermediate temperatures (Figs. 1–5),Reference Cao, Jia, Zheng, Zhao, Liu, Li, Zhao, Hu, Gu and Wang7 corresponding to the GB diffusion temperatures. Additionally, Han et al.Reference Han, Lu, Zhang, Yang, Wang and Lu52 also found that at intermediate temperatures, both the number density and length of CuO NWs increased due to the enhanced oxidation through GB diffusion. Similarly, Hansen et al.Reference Hansen, Chan, Lu, Lu and Chen53 promoted NW growth when the copper grain sizes were decreased by surface mechanical attrition treatment [Figs. 10(b)–10(e)], and then they claimed a short-circuit GB diffusion model. Therefore, the “GB diffusion” could be a crucial factor for CuO NW growth and the “stress-induced GB diffusion” mechanism was widely accepted as the growth mechanism.Reference Zhang, Zhang, Xu, Yang, Huang, Nie, Liu and Yang6,Reference Gonçalves, Campos, Ferlauto and Lacerda27,Reference Yuan and Zhou54,Reference Yuan, Wang, Mema and Zhou66,Reference Farbod, Meamar Ghaffari and Kazeminezhad68,Reference Lee and Tuan70,Reference Mema, Yuan, Du, Wang and Zhou71 As revealed in Fig. 10(f),Reference Gonçalves, Campos, Ferlauto and Lacerda27 the ion diffusion along GBs could be much fasterReference Cao, Zheng, Jia, Liu, Li, Chen, Liu, Wu, Sheng, Xing, Zhao and Wang72 and results in the nucleation and growth of CuO NWs. At higher/lower temperatures, the GB diffusion and NW growth are suppressed.
Additionally, the generation of cone-shaped and uniform diameter morphologies of CuO NWs can also be ascribed to the diffusion of Cu ions along NW surfaces [Fig. 10(f)Reference Gonçalves, Campos, Ferlauto and Lacerda27] and NW GBs [Fig. 10(g)Reference Hansen, Chan, Lu, Lu and Chen53], respectively. One can see that if the diffuse is along the NW surface, the Cu ions will be consumed during the upward diffusion process and then few Cu ions will reach to the NW tips, which results in the cone-shaped NWs. On the contrary, if Cu ions diffuse inside the NWs (along GBs), they will only react with oxygen at the NW tips and thus the NWs should exhibit uniform diameters. Similarly, the single- and bicrystalline structures in CuO NWs could also be ascribed to the surface and GB diffusion, respectively. Nevertheless, single crystalline NWs with uniform diameters are also observed in experiments,Reference Sheng, Zheng, Jia, Li, Cao, Wu, Han, Liu, Zhao and Wang15 which cannot be explained by these models.
D. Oxygen concentration gradient
It seems that the “stress GB diffusion” model is sufficient to describe CuO NW growth via thermal oxidation. Nevertheless, the influences of gaseous ambient, which has significant impacts on NW growth,Reference Zhang, Rossi, Tenailleau, Alphonse and Chane-Ching46,Reference Xu, Yang, Shi, Liu, Surya and Woo73 are rarely studied in spite of the fact that copper oxidation (or CuO NW growth) requires the supply of both copper and oxygen. Intuitively, with more oxygen in the atmosphere, the oxidation process and oxygen ion diffusion will be faster, which should facilitate the growth of CuO NWs. However, CuO NW growth was suppressed under higher oxygen flow rates [Fig. 4(f)].Reference Cao, Jia, Zheng, Zhao, Liu, Li, Zhao, Hu, Gu and Wang7,Reference Kumar, Srivastava, Tiwari and Nandedkar26 As a result, the growth mechanism should be revisited by further considering the influence of oxygen atmosphere.
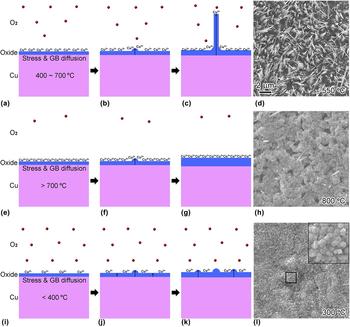
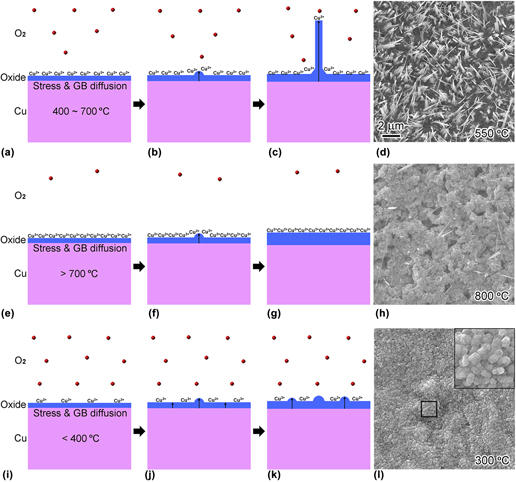
Generally, the oxygen concentration is deemed to be constant and homogeneous throughout the whole gaseous atmosphere due to the fast diffusion velocity of gas molecules at elevated temperature (e.g., about 692 m/s for O2 molecule at 450 °C).Reference Cao, Jia, Zheng, Zhao, Liu, Li, Zhao, Hu, Gu and Wang7 However, Cao et al.Reference Cao, Jia, Zheng, Zhao, Liu, Li, Zhao, Hu, Gu and Wang7 estimated the consumption of oxygen in air environment at 450 °C based on the experimental results,Reference Yuan, Wang, Mema and Zhou66 and surprisingly, about 1800 layers of oxygen molecules corresponding to a thickness of 14 μm oxygen/air were transformed into copper oxides in one second. As a result, there might exist an oxygen concentration gradient at the vicinity of the copper surface [Fig. 11(a)] due to the layer-by-layer diffusion of oxygen from “faraway” to the copper substrate surface (lack of oxygen due to the extremely consumption), despite the fast diffusion velocity of oxygen molecules.
Schematic illustration of the growth mechanism of CuO NWs in air atmosphere at (a–c) 400–700 °C; (e–g) >700 °C; (i–k) <400 °C. (d, h, and l) are the corresponding SEM images.Reference Cao, Jia, Zheng, Zhao, Liu, Li, Zhao, Hu, Gu and Wang7 Reprinted with permission from Ref. Reference Cao, Jia, Zheng, Zhao, Liu, Li, Zhao, Hu, Gu and Wang7 (American Physical Society).

Therefore, Cao et al.Reference Cao, Jia, Zheng, Zhao, Liu, Li, Zhao, Hu, Gu and Wang7 explored the influence of extra air/oxygen supply on CuO NW growth and found suppressing and assisting effects at lower (400–700 °C) and higher (700–800 °C) temperatures (Fig. 4), respectively. Thus, they proposed another growth mechanism: oxygen concentration gradient, which is formed because of the fast consumption of oxygen molecules by Cu ions. As exhibited in Fig. 11: (i) at temperatures ranging from 400 to 700 °C [Figs. 11(a)–11(d)], the remarkable out-diffusion of Cu ions results in fast consumption of oxygen and thus creates an oxygen concentration which will facilitate the growth of CuO NWs, while extra oxygen supply will more or less eliminate the gradient and lead to a suppression effect; (ii) at higher temperatures [>700 °C, Figs. 11(e)–11(h)], the residual oxygen is too scarce to sustain the CuO NW growth, and the extra oxygen supply could compensate for the consumed oxygen, forming the gradient again; (iii) at lower temperatures [<400 °C, Figs. 11(i)–11(l)], the gradient is negligible due to the insufficient Cu ion diffusion,Reference Rice, Han, Campbell and Stoykovich74 which leads to the absence of CuO NWs.
Additionally, according to the “oxygen concentration gradient” growth mechanism, the practical oxygen concentration is very low at the substrate surface during the NW growth process. Only Cu2O is thermodynamically stable at elevated temperatures and oxygen deficient conditions,Reference Xu, Woo and Shi75 which means CuO NWs is probably transformed from Cu2O. For example, Wang et al.Reference Wang, Wang, Liu, Diao, Yuan and Zhou76 observed the reduction of CuO into Cu2O at 450 °C under vacuum environment. Therefore, Cao et al.Reference Cao, Jia, Liu, Liu, Zheng and Wang77 analyzed the phase transition from cubic (Cu2O) to monoclinic structure (CuO) with group theory and theoretically predicted eleven bicrystalline structures, among which five bicrystals have been reported in experiments. Besides, there could be only one domain structure in the CuO NWs according to the group theory analysis, demonstrating the growth of single crystalline NWs.Reference Cao, Jia, Liu, Liu, Zheng and Wang77 Moreover, the uniform diameters of single crystalline CuO NWs could be explained by the “oxygen concentration gradient” model: the oxygen concentration is much lower near the substrate surface, and thus the Cu ions diffusing along NW surfaces (without GBs) will react with oxygen at the NW tips where the oxygen concentration is higher [Figs. 11(a)–11(c)].
However, large amounts of oxygen were directly supplied to the copper surfaces by Cao et al.,Reference Cao, Jia, Zheng, Zhao, Liu, Li, Zhao, Hu, Gu and Wang7 while a small amount of oxygen supply might also promote the NW growth at lower temperatures (<700 °C). This may explain the inconsistent results from Xu et al.Reference Xu, Woo and Shi50 [Figs. 4(a)–4(c)], which indicated that more oxygen was beneficial for NW growth at 400 °C. As proved by Kumar et al.,Reference Kumar, Srivastava, Tiwari and Nandedkar26 compared with that in air atmosphere, the NW growth was slightly promoted at 500 °C under an oxygen flow rate of 150 mL/min, while under lower (35 mL/min) or higher (300 mL/min) flow rates, the growth is suppressed. It is speculated that there exists an optimum oxygen supply (concentration or flow rate) for a certain Cu ion diffusion speed which depends on the annealing temperature and copper substrate microstructures. The experiments should be conducted more precisely in future to quantitatively study the relationship between oxygen supply and annealing temperature, and thus to optimize the oxygen concentration gradient model.
It is worth noting that many metal oxide NWs (e.g., CuO and Fe2O3) can be synthesized by other oxidation methods, including flame, plasma, and electric current.Reference Rao and Zheng58–Reference Altaweel, Filipič, Gries and Belmonte61,Reference Altaweel, Gries, Migot, Boulet, Mézin and Belmonte78–Reference Nasibulin, Rackauskas, Jiang, Tian, Mudimela, Shandakov, Nasibulina, Jani and Kauppinen83 One can see that all these strategies are also based on heating the metal substrates, and consistently featured with very short growth time, indicating fast consumption of oxygen. As a result, the oxygen concentration gradient mechanism may also be enlightening to these growth approaches. For example, Ostrikov et al.Reference Ostrikov, Levchenko, Cvelbar, Sunkara and Mozetic80 introduced the rapid and single-step synthesis of different metal oxide NWs by exposing thin metal substrates (Ga, Cd, Nb, Cu, V, and Fe) to reactive oxygen plasmas. The plasma temperatures could be much higher than the melting points of metals and thus VLS or VS mechanisms are adopted for the explanation of NW growth. Nevertheless, the temperature spatial-distribution in plasma is quite inhomogeneous and changes rapidly with the elapse of time, which means it is hard to figure out the practical NW growth temperature. Therefore, the oxygen concentration gradient model might also be relevant to the NW growth via plasma heating.
IV. FUTURE WORK
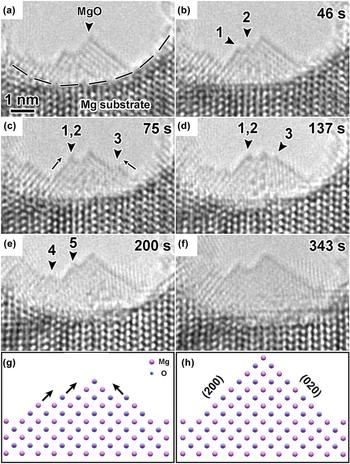
More studies should be done in future to further investigate the CuO NW growth mechanisms and thus realize effective control of the NW growth via thermal oxidation. First, the relationships between oxidation parameters (e.g., annealing time, temperature and atmosphere, and grain size of the Cu substrate) and CuO NW growth (e.g., the length, diameter, density, morphology, and structure of CuO NWs) need to be studied systematically and precisely to reveal the growth mechanisms and guide the fabrication of CuO NWs. To verify the “stress-induced GB diffusion” and “oxygen concentration gradient” growth mechanisms, the growth of CuO NWs may be experimentally studied at the nanoscale via the in situ environmental transmission electron microscopyReference Zou, Li, Zakharov, Stach and Zhou84,Reference Li, Luo, Ciston, Saidi, Stach, Yang and Zhou85 at elevated temperatures,Reference Wang, Wang, Liu, Diao, Yuan and Zhou76 which will allow the direct observation of Cu ion diffusion through lattices, surfaces, or GBs,Reference Cao, Zheng, Jia, Liu, Li, Chen, Liu, Wu, Sheng, Xing, Zhao and Wang72 and the CuO NW growth processes from the substrate. For example, Zheng et al. studied the growth mechanism of MgO via in situ high resolution transmission electron microscopy during magnesium oxidation and directly observed the layer-by-layer growth of MgO by the adatom process (Fig. 12).Reference Zheng, Wu, Sheng, Liu, Liu, Cao, Zhou, Zhao, Zhao and Wang32 Additionally, the existence of “oxygen concentration gradient” may also be theoretically demonstrated by considering the consumption and diffusion of oxygen molecules. And thus the growth mechanism of CuO NWs will be deeply revealed.
(a–f) Time-lapsed images of the layer-by-layer growth of MgO during Mg oxidation at nanoscale. (g) and (h) Atomic models illustrating the MgO growth process.Reference Zheng, Wu, Sheng, Liu, Liu, Cao, Zhou, Zhao, Zhao and Wang32 Reprinted with permission from Ref. Reference Zheng, Wu, Sheng, Liu, Liu, Cao, Zhou, Zhao, Zhao and Wang32 (AIP Publishing).

On the other hand, the sufficient supply of Cu ions and lacking of oxygen during CuO NW growth indicated an oxygen (or oxygen concentration gradient) determined growth mechanism. As a result, one may expect that if a metal substrate is heated under ultra-high vacuum, there will be plenty of reactive metal ions at the substrate surface. Subsequently, the oxygen will be supplied to the substrate surface with a nanotube which can move in three dimensions. Finally, the nanostructure of the corresponding metal oxide could be “drawn/controlled” by moving the nanotube which provides oxygen and generates the metal oxide with much higher melting temperature than that of the metal. A very similar example is the focused ion beam (FIB) technique which can fabricate various micro/nanostructures via the Ga ion sputtering.Reference Ferris, Reig, Eddarir, Pierson, Garbarino, Guay and Pech86 Therefore, this strategy is technically feasible and might be a significant supplement for the design of metal oxide nanostructures.
V. CONCLUSIONS
Scalable CuO NWs can be fabricated via thermal oxidation of copper particles, wires, grids, or foils, within a temperature range from 400 to 800 °C (corresponding to the GB dominated diffusion) under air/oxygen atmosphere. The NWs exhibit either single crystalline structures or bicrystals with various twinning domains, which could be theoretically predicted by the group theory. The diameter, length (or aspect ratio), and number density of NWs can be easily controlled by the annealing time and temperature, gaseous condition, and grain size of the copper substrate.
The growth of CuO NWs requires both copper and oxygen, and thus both copper ion and oxygen molecule supplies could be crucial for the NW growth. The copper vapor is negligible at the growth temperatures, implying that Cu ions are supplied via solid-state diffusion. Subsequently, the “stress-induced GB diffusion of Cu ions” mechanism is widely accepted for CuO NW growth. On the other hand, the oxygen environments are proved to have vital impacts on the growth of CuO NWs, which can be well explained by the “oxygen concentration gradient” model. Additionally, the creation of oxygen concentration gradient is attributed to the fast consumption of oxygen by the “stress GB out-diffusion of Cu ions”. It seems that the combination of “oxygen concentration gradient” and “stress GB diffusion of Cu ions” models is relevant to explain CuO NW growth.
ACKNOWLEDGMENT
L. Xiang would like to thank Dr. Cao for many valuable discussions.