1 Introduction
Understanding labor market dynamics is important when conducting monetary policy and for designing labor market reforms that can reduce unemployment. According to the widely used search and matching theory, unemployment is caused by frictions, and search costs are crucial determinants of the levels of employment and unemployment and their variation. In this paper, I study labor market dynamics from the point of view of a firm—a perspective that has been less studied than has the perspective of an unemployed worker. I investigate the importance of search frictions for firms’ employment dynamics using two methods. First, a theoretical model of a firm’s employment decision is simulated numerically. The model is more general and realistic than is the standard search and matching model as it allows for imperfect competition in the product market and for convex adjustment costs. Second, an employment equation is estimated empirically using panel data for Swedish firms.
According to search and matching theory, the state of the labor market affects the probability of filling a vacancy, which in turn affects the creation of new vacancies and hiring. Footnote 1 It is easier to fill vacancies when there are more unemployed workers available to hire, and it is more difficult when many other firms also have open vacancies. To say something about the magnitudes of these effects at the micro level, I simulate the theoretical model of firms’ employment dynamics developed by Carlsson et al. (Reference Carlsson, Eriksson and Gottfries2013). The model is a search and matching model with linear vacancy costs, convex adjustment costs, and monopolistic competition in the product market. Vacancies and unemployment in the local labor market affect a firm’s employment decision through their effects on the probability of filling a vacancy, but employment also depends on product demand (if competition in the product market is imperfect) and on real wage costs. Employment responses resulting from shocks to the explanatory variables are simulated numerically.
As a reference point, I first consider the special case of the model without convex adjustment costs and with a very high degree of competition in the product market. This simulation produces results that are consistent with the standard search and matching model. The firm’s employment responses to shocks to the number of unemployed and to the number of vacancies in the labor market are substantial.
I then consider a more realistic version of the model with convex adjustment costs and where the degree of competition in the product market is calibrated according to what has been found in relevant studies. Two studies showing convex adjustment costs to be important in search and matching models are Mertz and Yashiv (Reference Mertz and Yashiv2007) and Mumtaz and Zanetti (Reference Mumtaz and Zanetti2015). In widely used New Keynesian macroeconomic models, there is typically an assumption of monopolistic competition in the product market, with a markup of 10–20% (see, e.g. Krause et al Reference Krause, Lopez-Salido and Lubik2008; Christiano et al. Reference Christiano, Trabandt and Walentin2011). Footnote 2 Some recent evidence shows even larger average markups (De Loecker and Eeckhout Reference De Loecker and Eeckhout2017).
Simulating a model with a reasonable markup and adjustment costs, I find that a typically sized shock to the number of vacancies in the labor market has a relatively small but still non-negligible effect on the employment decision of the individual firm in the baseline simulation. The typical vacancy shock has a non-negligible employment effect mainly due to its large size. The simulated employment effect of a typical shock to the number of unemployed is considerably smaller due to the fact that, in the data, these shocks are far from as large as the shocks to the number of vacancies. Simulated employment responses to 1% shocks to the number of vacancies or the number of unemployed—and hence to the probability of filling a vacancy—are close to zero. The intuition behind these results is that vacancies are usually filled quite quickly, and a short extension of this time is not crucial for the firm’s decision on whether to hire.
The baseline simulation results are quite robust with respect to realistic changes in parameter values. The effects become large only in the special case when the convex adjustment costs are set to 0 and at the same time the degree of competition in the product market is set very high. In the baseline simulation, a standard matching function with constant return to scale and equal weights on unemployment and vacancies is applied. If I instead use matching parameters estimated using panel data for Sweden, the simulated employment responses become notably smaller than in the baseline. Setting linear vacancy cost lower than in the baseline, which is probably realistic, also leads to smaller responses.
Simulations furthermore suggest that the employment effects of shocks to the number of unemployed and number of vacancies are smaller when the labor market is weak than in boom periods. This result is consistent with the idea in Michaillat (Reference Michaillat2012) that matching frictions are less important for labor market outcomes in recessions.
To test the predictions from the simulated model empirically, I estimate an equation for employment using firm-level data. The empirical specification is based on Carlsson et al. (Reference Carlsson, Eriksson and Gottfries2013), who analyzed the determinants of net employment changes at the firm level. They used data for Swedish manufacturing firms in the 1990s, which is a period dominated by a deep recession, and they found that product demand and real wages were important for employment, while the availability of unemployed workers was not. Vacancies in the local labor market had a negative effect on employment in some specifications, indicating a congestion effect.
In this paper, I use a richer dataset than did Carlsson et al. (Reference Carlsson, Eriksson and Gottfries2013). The dataset covers both the 1990s and 2000s; hence, all stages of the business cycle and all firms in Sweden with at least 10 employees are included, not just the manufacturing firms. The estimation results show no economically significant effects of changes in the number of unemployed or number of vacancies in the local labor market on firms’ employment decisions, suggesting that search frictions are of small importance. Product demand has a robust positive effect, which points to the importance of imperfect competition in the product market, and the real wage cost has a weak negative effect on firms’ employment. Furthermore, a large coefficient for the lag of employment is consistent with convex adjustment costs. Thus, the empirical results in this paper point in the same direction as those in Carlsson et al. (Reference Carlsson, Eriksson and Gottfries2013). Additionally, the results are largely consistent with those in Eriksson and Stadin (Reference Eriksson and Stadin2017), who estimated a similar equation for hiring (defined as deregistrations of registered vacancies), using data from the Public Employment Service for all local labor markets in Sweden.
The rest of the paper is organized as follows. In Section 2, the theoretical model is presented and simulated. In Section 3, firm-level data are used to empirically estimate an employment equation which is based on the theoretical model. Section 4 concludes the paper.
2 Theoretical Simulation of Firm-Level Employment Dynamics
2.1 Theoretical Model
The theoretical model used is from Carlsson et al. (Reference Carlsson, Eriksson and Gottfries2013). The model is based on the standard search and matching model (cf. Pissarides Reference Pissarides2000), with the main differences being that the product market is characterized by imperfect competition, firms hire more than one worker, and convex adjustment costs are included.
There are several local labor markets, and all matching is assumed to take place within these local labor markets. In each local labor market, indexed n, there are many firms, indexed i. The firms sell their products in different product markets, and they face different competitors’ prices, denoted
 ${{\rm \ P}}^{{\rm C}}_{{\rm i,t}}$
. To keep the model simple, nominal wages (
 ${{\rm W}}_{{\rm i,t}}$
) are assumed to be exogenous to the firms.
Footnote 3
Production takes place with the CRS technology
 ${{\rm Y}}_{{\rm i,t}} = {{\rm N}}_{{\rm i,t}}$
, where
 ${{\rm N}}_{{\rm i,t}}$
is the number of workers employed at the firm. Firms sell their products in monopolistically competitive markets, and demand for a firm’s output is
 ${{\rm Y}}_{{\rm i,t}} = {\left({{\rm P}}_{{\rm i,t}}/{{\rm P}}^{{\rm C}}_{{\rm i,t}}\right)}^{{\rm -}\eta }{{\rm D}}^{\sigma }_{{\rm i,t}}$
, where
 ${{\rm P}}_{{\rm i,t}}$
is the firm’s price,
 ${{\rm D}}_{{\rm i,t}}$
is a firm-specific demand shifter,
 $\sigma >0$
, and
 $\eta >1$
. There is no price rigidity; the firms adjust their prices to sell what they have produced.
Footnote 4
Matching of unemployed workers and vacancies takes place every period in each local labor market. The probability of filling a vacancy within period t is given by
 ${{\rm Q}}_{{\rm n,t}} = \phi {{\rm U}}^{{\alpha }_{{\rm U}}}_{{\rm n,t}}{{\rm V}}^{{\alpha }_{{\rm V}}-1}_{{\rm n,t}}$
. It takes time to fill a vacancy, and the matching process can be more or less efficient, which is reflected in the constant
 $\phi$
. With search frictions, the vacancy filling rate depends on the number of unemployed and the number of vacancies in the local labor market. Without search frictions,
 $\alpha {}_{U} = \alpha_{V}-1 = 0$
, and the vacancy filling rate is constant.
A fraction
 $\lambda $
of the previously employed workers quit their jobs for exogenous reasons each period. This fraction is assumed to be sufficiently large that firms are able to adjust the number of employees sufficiently downward by hiring fewer workers, that is, layoffs are not necessary. At the start of each period, firms choose the number of vacancies to open. Firm i opens
 ${{\rm V}}_{{\rm i,t}}$
vacancies and incurs real linear vacancy costs given by
 ${{\rm c}}_{{\rm V}}{{\rm V}}_{{\rm i,t}}$
. The linear vacancy costs include costs for advertising and recruiters for each period the vacancy is open. Hiring is
 ${{\rm H}}_{{\rm i,t}} = {{\rm Q}}_{{\rm n,t}}{{\rm V}}_{{\rm i,t}}$
, and the firm incurs real quadratic hiring costs given by
 ${{\rm c}}_{{\rm H}}/2{\left({{\rm H}}_{{\rm i,t}}/{{\rm N}}_{{\rm i,t-1}}\right)}^{{\rm 2}}{{\rm N}}_{{\rm i,t-1}}.$
The quadratic hiring costs include costs for training, reorganization, etc. Convex hiring costs imply a smooth adjustment of the firms’ employment over time.
Footnote 5
When deciding the number of workers to recruit, firm i maximizes current profit plus the expected present value of future profits. The Bellman equation is as follows:
 \begin{align} & {\rm V}\!\left({{\rm N}}_{{\rm i,t-1}}; {{\rm Q}}_{{\rm n,t}},{{\rm D}}_{{\rm i,t}},\ {{\rm P}}^{{\rm C}}_{{\rm i,t}}\ ,{{\rm W}}_{{\rm i,t}}\ \right) = {\mathop{\max }_{{{\rm V}}_{{\rm i,t}}} \frac{{{\rm P}}_{{\rm i,t}}{{\rm Y}}_{{\rm i,t}}}{{{\rm P}}^{{\rm C}}_{{\rm i,t}}}-\frac{{{\rm W}}_{{\rm i,t}}}{{{\rm P}}^{{\rm C}}_{{\rm i,t}}}{{\rm N}}_{{\rm i,t}}\ }{\rm -}\frac{{{\rm c}}_{{\rm H}}}{{\rm 2}}{\left(\frac{{{\rm H}}_{{\rm i,t}}}{{{\rm N}}_{{\rm i,t-1}}}\right)}^{{\rm 2}}{{\rm N}}_{{\rm i,t-1}}\nonumber\\[5pt]& \quad{\rm -}{{\rm c}}_{{\rm V}}{{\rm V}}_{{\rm i,t}} + \beta \ {{\rm E}}_{{\rm t}}\!\left\{{\rm V}\!\left({{\rm N}}_{{\rm i,t}}; {{\rm Q}}_{{\rm n,t+1}},{{\rm D}}_{{\rm i,t+1}},\ {{\rm P}}^{{\rm C}}_{{\rm i,t+1}},{{\rm W}}_{{\rm i,t+1}}\ \right)\right\}\end{align}
such that
 ${{\rm N}}_{{\rm i,t}} = {{\rm H}}_{{\rm i,t}} + \left({\rm 1-}\lambda \right){{\rm N}}_{{\rm i,t-1}}$
,
 ${{\rm H}}_{{\rm i,t}} = {{\rm Q}}_{{\rm n,t}}{{\rm V}}_{{\rm i,t}}$
,
 ${{\rm Y}}_{{\rm i,t}} = {{\rm N}}_{{\rm i,t}}$
, and
 ${{\rm Y}}_{{\rm i,t}} = {\Big(\frac{{{\rm P}}_{{\rm i,t}}}{{{\rm P}}^{{\rm C}}_{{\rm i,t}}}\Big)}^{{\rm -}\eta }{{\rm D}}^{\sigma }_{{\rm i,t}}$
.
Substituting out
 ${{\rm H}}_{{\rm i,t}},\ {{\rm V}}_{{\rm i,t}},\ {{\rm Y}}_{{\rm i,t}},$
and
 ${{\rm P}}_{{\rm i,t}}$
and maximizing with respect to
 ${{\rm N}}_{{\rm i,t}}$
yields the following Euler equation:
Footnote 6
 \begin{equation} {{\rm E}}_{{\rm t}}\!\left\{ \begin{array}{l}\frac{\eta {\rm -1}}{\eta }{\left(\frac{{{\rm D}}^{\sigma }_{{\rm i,t}}}{{{\rm N}}_{{\rm i,t}}}\right)}^{\frac{{\rm 1}}{\eta }}{\rm \ }-\frac{{{\rm W}}_{{\rm i,t}}}{{{\rm P}}^{{\rm C}}_{{\rm i,t}}}{\rm -}{{\rm c}}_{{\rm H}}\left({{\rm N}}_{{\rm i,t}}{\rm -}\left({\rm 1-}\lambda \right){{\rm N}}_{{\rm i,t-1}}\right){{{\rm N}}_{{\rm i,t-1}}}^{{\rm -1}}{\rm -}\frac{{{\rm c}}_{{\rm V}}}{{{\rm Q}}_{{\rm n,t}}} \\[9pt]\quad +\, \beta {{\rm c}}_{{\rm H}}\left({{\rm N}}_{{\rm i,t+1}}{\rm -}\left({\rm 1-}\lambda \right){{\rm N}}_{{\rm i,t}}\right){{\left({\rm 1-}\lambda \right){\rm N}}_{{\rm i,t}}}^{{\rm -1}} \\[5pt]+\, \beta \frac{{{\rm c}}_{{\rm H}}}{{\rm 2}}{\left({{\rm N}}_{{\rm i,t+1}}{\rm -}\left({\rm 1-}\lambda \right){{\rm N}}_{{\rm i,t}}\right)}^{{\rm 2}}{{{\rm N}}_{{\rm i,t}}}^{{\rm -2}} + \beta \left({\rm 1-}\lambda \right)\frac{{{\rm c}}_{{\rm V}}}{{{\rm Q}}_{{\rm n,t+1}}}{\rm = 0} \end{array}\right\}\end{equation}
From the first-order condition (2), one can see that the firm will hire more workers if the probability of finding a worker in the current period (
 ${{\rm Q}}_{{\rm n,t}} = \phi{{\rm U}}^{{\alpha }_{{\rm U}}}_{{\rm n,t}}{{\rm V}}^{{\alpha }_{{\rm V}}-1}_{{\rm n,t}}$
) is higher, if the expected probability of finding a worker in the next period
 ${{\rm (Q}}_{{\rm n,t+1}}{\rm )}$
is lower, if the demand for the firm’s products (
 ${{\rm D}}_{{\rm i,t}}$
) is higher, or if the real wage costs
 $\left({{\rm W}}^{{\rm r}}_{{\rm i,t}} = {{\rm W}}_{{\rm i,t}}/{{\rm P}}^{{\rm C}}_{{\rm i,t}}\right)$
are lower. This equation will be used in the theoretical simulations of impulse response functions. Furthermore, a log-linear labor demand equation derived from this equation will be estimated in the empirical part of the paper, Section 3. An individual firm is assumed to be small in relation to the market, so the probability of filling a vacancy is taken as given by the firm.
2.2 Comments on Some Features of the Theoretical Model
The wage cost per worker is assumed to be exogenous to the firm. There is an ongoing discussion about wage setting in search and matching models. Shimer (Reference Shimer2005) showed that in a conventional search and matching model with the wage in each period determined by Nash bargaining between individual firms and workers, there is too much volatility in wages and too little volatility in aggregate vacancies and unemployment compared to what can be observed in the data. Models with wage stickiness have been found to better match US data; see Shimer (Reference Shimer2004), Hall (Reference Hall2005), Gertler et al. (Reference Gertler, Sala and Trigari2008), and Gertler and Trigari (Reference Gertler and Trigari2009). Footnote 7 Wages in Sweden are to a large extent set in advance in nationwide branch-level union contracts. The effect of wages is not the main focus of this study, and to keep the model simple, I retain the assumption of exogenous wages, following Carlsson et al. (Reference Carlsson, Eriksson and Gottfries2013). Thus, local unemployment, local vacancies, and wages are assumed to be exogenous to the individual firm. In the simulations, the volatility and persistence of these variables are based on stochastic processes that have been estimated on Swedish data.
Firms are assumed to face quadratic adjustment costs. This specification is a simple representation of various types of adjustment costs to which firms are subject. The use of convex adjustment costs can be questioned since adjustments by individual firms appear to be lumpy, but several studies have found that a smooth specification can capture the sluggish response on the macro level; hence, it may be an acceptable approach to model the average response to shocks. Footnote 8 Mertz and Yashiv (Reference Mertz and Yashiv2007) and Mumtaz and Zanetti (Reference Mumtaz and Zanetti2015) include both labor and capital in their models, and they allow for convex adjustment costs in both capital and labor and an interaction term in the adjustment costs. Their estimations suggest that convex adjustment costs are important to replicate US business cycle fluctuations. Concerning the precise specification of the convex labor adjustment cost, they find support for a cubic specification. In a simpler, alternative model, Mumtaz and Zanetti (Reference Mumtaz and Zanetti2015) also exclude capital, an approach more consistent with the model I use; then, their estimate for the labor adjustment costs lands in the middle between a quadratic and a cubic specification. I retain the quadratic specification for the hiring adjustment costs, following Carlsson et al. (Reference Carlsson, Eriksson and Gottfries2013). The main point here is that the costs of adjusting the labor force should include convex terms (of some sort) and not just be linear.
Price rigidity is not part of the model but could be included to produce a more sluggish price response. As a robustness check, I include quadratic adjustment costs for prices. Quadratic adjustment costs are a quite common method of modeling sticky prices and are used for instance in the New Keynesian model in Krause et al (Reference Krause, Lopez-Salido and Lubik2008). Price rigidity is expected to slow the employment responses to changes in labor market conditions but increase the responses in product demand.
2.3 Parametrization
Carlsson et al. (Reference Carlsson, Eriksson and Gottfries2013) used their model to derive an empirical specification, but they did not simulate it. Simulations generate predictions concerning the magnitudes of the expected effects and allow us to see which parameter values of the model are most crucial for the results. In this section, numerical values are assigned to the parameters of the model, aiming at being reasonable in the Swedish context. The period length is 1 month, which is the highest frequency for which I have data to estimate the shocks. One month seems to be a standard time horizon in the search and matching literature. The parameter values of the theoretical model used are listed in Table 1. The processes of the exogenous variables are presented in Table 2.
Parameter values

Notes: The steady state levels of the exogenous variables are not interesting in the analysis and are for simplicity set to 1. The processes of the exogenous variables are presented in Table 2.
Estimated autoregressive processes for exogenous variables

Notes: ***, **, and * denote significance at the 1, 5, and 10% levels, respectively. Unemployment and vacancy data are for all local labor markets (n) in Sweden in 1992–2011, the product demand for all industries (j) in Sweden in 1992–2008, and the real wage costs for all industries in manufacturing and mining 1992–2008, all in logs and at monthly frequency. The standard errors are robust, clustered at local labor market or industry. Fixed effects for local labor markets or industry, local or industry-specific linear and quadratic time trends, and local or industry-specific seasonal effects are included in all regressions. Excluding the trends has little effect on the estimated processes. The steady state levels of the exogenous variables are all set to 1 in the simulations, and the size and persistence of each shock are given by the estimated autoregressive processes presented in this table.
I set
 $\alpha {}_{U } = \alpha {}_{V } = 0.5$
, that is, equal weights and constant returns to scale in the matching function. These parameter values are used in other studies such as Gertler and Trigari (Reference Gertler and Trigari2009). According to Petrongolo and Pissarides (Reference Petrongolo and Pissarides2001), most studies estimating matching functions have found that a log-linear specification with coefficients of approximately 0.5 for both vacancies and unemployment (CRS) fits the data well. Since the model is simulated around a steady state, where the levels of the exogenous variables are one, the constant
 $\phi$
is set equal to the mean of Q in data I have for Sweden.
Footnote 9
Therefore,
 $\phi = {{\rm Q}}^{{\rm ss}} = $
1.6, which means that a vacancy that is open for 1 month generates 1.6 hires in the steady state. An alternative, which is considered below, is to estimate the parameters
 $\alpha {}_{U }$
and
 $\alpha {}_{V }$
and then use the estimated values in the simulation, but I want to start with the more standard calibration to make clear that my estimates of these parameters are not the important drivers behind my main results.
The parameter
 $\lambda $
is the rate at which employed workers quit their jobs for exogenous reasons. According to Statistics Sweden, approximately 3% of the workers in the private sector left their jobs each quarter in 1990–2011, indicating a monthly separation rate of approximately 1%. I set
 $\lambda $
= 0.01 to match this number.
Footnote 10
The value 0.01 is smaller than the monthly separation rate of 0.038 for the USA reported by Michaillat (Reference Michaillat2012) and the monthly values that can be derived from the quarterly values for the USA in Shimer (Reference Shimer2005),
 $0.1/3 \approx 0.033$
, and in Mertz and Yashiv (Reference Mertz and Yashiv2007),
 $0.086/3 \approx 0.029$
. A lower separation rate for Sweden than for the USA is not surprising, since the USA has higher turnover than do many other countries. Yashiv (Reference Yashiv2000) set
 $\lambda $
to 0.017 per month for Israel. Setting
 $\lambda $
= 0.02 instead of
 $\lambda $
= 0.01 has almost no effect on my results.
The cost of recruiting a worker consists of two parts. The linear vacancy costs make the cost of recruitment higher, the longer the duration of the vacancy. The other part is the quadratic hiring costs, which are independent of the probability of filling a vacancy. If the vacancy cost parameter, c
 ${}_{v}$
, is set to 0, employment is not at all affected by shocks to vacancies or unemployment in the local labor market. If the hiring cost parameter c
 ${}_{\rm H}$
is set to 0, the employment effects of all shocks become stronger, and employment returns faster to steady state. With no convex adjustment costs (c
 ${}_{\rm H}$
= 0) and at the same time a very high price elasticity (high
 $\eta $
), the model approaches a standard search and matching model.
The value of the linear vacancy costs parameter, c
 ${}_{V}$
, is taken from Michaillat (Reference Michaillat2012). In his calibration, the recruiting cost in the benchmark model is 0.32 = 0.32
 $\overline{{\rm W}}$
, where
 $\overline{{\rm W}}$
is the steady state wage. This value is a midpoint between two estimates based on data from two different US data sources.
Footnote 11
I have seen no estimates of the vacancy cost parameter for Sweden. The steady state wage in my calibration is one; hence, I calibrate c
 ${}_{V }$
as 0.32. This value might overstate the linear vacancy costs in my case, since some costs that should be included in the quadratic hiring costs might be included in this measure.
Footnote 12
Cases with lower or higher linear vacancy costs are analyzed as sensitivity checks.
The value of the parameter in the quadratic hiring costs, c
 ${}_{\rm H}$
= 7, is derived from the estimation of the Euler equation using Swedish firm-level data in Carlsson et al. (Reference Carlsson, Eriksson and Gottfries2013). There is also support for convex hiring costs in, for example, Yashiv (Reference Yashiv2000) using Israeli data, Mertz and Yashiv (Reference Mertz and Yashiv2007), Yashiv (Reference Yashiv2016), and Mumtaz and Zanetti (Reference Mumtaz and Zanetti2015) using US data, and Blatter, Muehlemann and Schenker (Reference Blatter, Muehlemann and Schenker2012) using Swiss data. Due to uncertainty concerning the value of this parameter, I examine cases with markedly lower or higher quadratic hiring costs in the sensitivity analysis.
Footnote 13
Carlsson and Smedsaas (Reference Carlsson and Smedsaas2007) estimated the markup for Swedish manufacturing firms in 1990–1996 at 17%. Since the price markup over marginal cost is
 $\eta {\rm /(}\eta {\rm -1)}$
, this estimation translates to
 $\eta = 7$
, which is the value I use in the baseline. A markup of 17% is not far from what is assumed in many other studies. A steady state markup of 10% (
 $\eta $
= 11) is a common value according to Krause et al (Reference Krause, Lopez-Salido and Lubik2008). Christiano et al. (Reference Christiano, Trabandt and Walentin2011) set the markup to 20% in their New Keynesian model. De Loecker and Eeckhout (Reference De Loecker and Eeckhout2017) report evidence on the size of markups in the USA, with average markups rising from approximately 20% in the 1980s to 67% in 2014. Carlsson et al. (Reference Carlsson, Eriksson and Gottfries2013) derived a value of
 $\eta $
= 2.6 from estimation results for firms in the Swedish manufacturing sector in the 1990s, implying a markup of 63%, but this estimate is quite uncertain, and I will not use it as a baseline value. In the sensitivity analysis, I examine what happens when I markedly decrease and increase competition in the product market.
The other parameter in the monopolistic demand function,
 $\sigma$
, is set to 1.8, as was estimated for Swedish manufacturing firms in Carlsson et al. (Reference Carlsson, Eriksson and Gottfries2013). This parameter is the elasticity of production with respect to the demand shock.
The discount rate is
 $\beta = 0.99^{1/3} \approx 0.997$
, that is, a monthly interest rate of 0.3%. This rate is the same as in Gertler and Trigari (Reference Gertler and Trigari2009) and is close to the 0.4% rate in Yashiv (Reference Yashiv2000) and the values in most other studies. Some other related studies using a quarterly discount rate of 0.99 are Thomas and Zanetti (Reference Thomas and Zanetti2009) for the Euro area and Mumtaz and Zanetti (Reference Mumtaz and Zanetti2015) for the USA.
Vacancies in the local labor market, unemployment, product demand, and real wage costs are exogenous in the theoretical model of the firm. Estimates of how these variables move over time are needed to simulate the model. For this purpose, I estimate second-order autoregressive processes, controlling for local linear time trends and seasonal effects. The aim is to identify unexpected variations that firms have not already incorporated into earlier employment decisions; neither the trend nor the seasonal variation should come as a surprise to the firms. AR(2) is chosen to keep it simple but still catch more of the dynamics than with AR(1). Footnote 14 The estimated AR(2) processes are presented in Table 2. The standard deviations of the residuals are used as measures of typical shocks to the variables that are exogenous to the firm. The coefficients for the lags provide information about how the variables will move over time until they return to steady state after the initial shock. The shocks are interpreted as standard unpredictable changes in economic conditions according to the data. The steady state levels of the exogenous variables are not interesting in the analysis and are for simplicity set to 1 in the simulations.
Data for unemployment and vacancies for all local labor markets in Sweden 1992–2011 are from the Swedish Public Employment Service. The variables representing product demand and real wage costs are constructed at the industry level using data from Statistics Sweden and the OECD. Product demand is an index including both domestic and foreign demand, weighted together by industry-level export shares. The real wage cost is the nominal wage deflated by a competitors’ price consisting of domestic and international product prices. A more detailed description of the product demand and wage cost variables can be found in Eriksson and Stadin (Reference Eriksson and Stadin2017). Data for these two variables are not available at the firm level, but the industry level should serve as an approximation.
Franco and Philippon (Reference Franco and Philippon2007) used data for US firms and found that permanent changes in firm-specific (relative) product demand and technology explain most of the firms’ dynamics, but since these shocks are almost uncorrelated across firms, they are not important for aggregate dynamics. Transitory shocks, on the other hand, were found to be significantly correlated across firms and accounted for most of the volatility in aggregate production and aggregate labor input. In this study, the focus is on the effects of typical, macro-related, transitory shocks (around a trend) to firm-level employment. The behavior of firms reflects on the shock variables, but how this reflection happens is not modeled in this paper. The shocks are assumed to be exogenous to the individual firm that is simulated, and their development over time is just taken from the data. This approach allows me to focus on firm behavior.
2.4 Simulation of Impulse Response Functions
The simulations show the employment dynamics for an individual firm according to the calibrated model. To do the simulations, the theoretical model is approximated around a steady state, and the effects of temporary but persistent shocks to the exogenous variables are simulated. Footnote 15 Shocks to the explanatory variables are considered one at a time. The shocks are log-deviations from steady state and are referred to as approximate percentage changes. I start with the case approaching the standard search and matching case, then go to my baseline case using the parameters listed in Table 1; thereafter, I do some sensitivity analysis.
The simulated responses to positive and negative shocks are symmetric. In the theoretical model, it is assumed that downward adjustment of employment can be handled by simply reducing hiring since there are always workers quitting to voluntarily change their workplace, retire, etc. For extreme parameter values, this assumption can be problematic; hence, the focus is on shocks with a positive expected employment response. Footnote 16
2.4.1. Standard search and matching model
To give a reference point for comparison, I first simulate the model with the parameter values calibrated, so that the model approaches a standard search and matching model. In other words, the convex hiring cost is set to 0, and competition in the product market is set very high, approaching perfect competition. In this case, the firm responds strongly to changes in labor market conditions. The maximum employment responses to shocks to the number of unemployed and the number of vacancies in the local labor market are reported in row 2 in Table 3. The average firm’s employment response to a typical shock to vacancies is huge, more than 60%, and the corresponding employment response to a typical shock to the number of unemployed is also large, almost 6%. One-percent shocks to either the number of unemployed or the number of vacancies in the labor market give rise to employment responses on the order of 1–2%.
Simulated maximum firm-level employment responses to shocks to the number of unemployed and to the number of vacancies in the local labor market

Notes: Baseline parameter values are listed in Table 1, for example, c
 ${}_{H} = 7$
, c
 ${}_{V} = 0.32$
,
 $\eta = 7$
, and
 $\alpha_{U} = (\alpha_{V} -1) = 0.5$
, and Q
 ${}^{ss} = 1.6.$
Q
 ${}^{ss}$
can be changed by, for example, changing U
 ${}^{ss}$
and V
 ${}^{ss}$
or
 $\phi$
. The employment responses are simulated using Dynare, Matlab. The model is approximated using the first-order approximation; using the second-order approximation yields very similar results.
However, as discussed above, several studies have shown that convex adjustment costs are important, and markups have been found to be substantial. In my baseline simulation, following next, the convex adjustment costs and the competition in the product market are calibrated consistent with what is reasonable according to the literature described in Section 2.3.
2.4.2 Baseline simulation
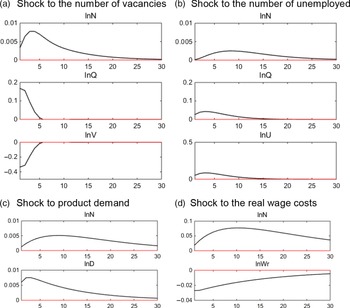
Impulse response functions for the baseline case are presented in Figure 1. A typical shock to vacancies, consisting of a decrease of 34% Footnote 17 in the number of vacancies in the local labor market where the firm is located, leads to a 17% increase in the probability of filling a vacancy and a maximum increase of 0.8% in the number of workers employed at the firm. A typical shock to unemployment, consisting of a 5% increase in the number of unemployed in the local labor market, leads to a 4% increase in the probability of filling a vacancy and a maximum increase of 0.3% in the number of workers employed at the firm. It takes approximately 2 years for employment to return to steady state after a shock to the probability of filling a vacancy.
Simulation of a firm’s employment responses to exogenous shocks.
Notes: Employment (N) is at the firm level. The number of unemployed (U), the number of vacancies (V), and the vacancy filling rate (Q) are at the local labor market level and are assumed to be taken as given by the individual firm, just as are the demand for the firm’s type of product (D) and the real wage cost per worker facing the firm (Wr). On the y-axis is log-deviation from steady state, and on the x-axis is the number of months. The graphs show the return to steady state after an exogenous shock. The sizes of the shocks and the development of the exogenous variables over time are given by the data; see Table 2. Parameter values are listed in Table 1. These theoretical impulse response functions are simulated using Dynare, Matlab. The model is approximated using the first-order approximation; using the second-order approximation yields very similar results.

A 0.6% shock to product demand leads to a maximum response of 0.5% increase in employment, and a 2.7% negative shock to real wage costs leads to a maximum response of 7.7% higher employment. It takes more than 3 years for employment to return to steady state after a shock to product demand or real wage costs.
I have also simulated impulse responses to 1% shocks using the baseline parameter values. This is to ease the interpretation of the effects, making them similar to elasticities. The maximum response in employment to a 1% shock is 0.02% when the shock is to vacancies, 0.05% when the shock is to unemployment, 0.8% when the shock is to product demand, and 2.9% when the shock is to real wage costs. The unemployment shock is much more persistent than the vacancy shock and produces a hump-shaped response.
2.4.3 Sensitivity analysis
Table 3 shows the maximum employment responses in simulations, changing some of the parameter values. Changing the parameter values for the quadratic hiring costs, the linear vacancy costs, and the degree of competition in the product market, I come to the conclusion that the convex adjustment costs seem to be important for the sizes of the employment responses, particularly in combination with the degree of competition in the product market. Without convex costs associated with adjusting the number of employees and with high competition in the product market, the firm’s responses are fast and strong. For baseline convex hiring costs and baseline degree of competition in the product market, the vacancy cost per unit of time would have to be very high for substantial changes in employment to occur due to changes in the probability of filling a vacancy, much higher than in the baseline. (As explained in Section 2.3, the linear vacancy cost parameter is probably set too high rather than too low in the baseline calibration.) The duration of a vacancy is always quite short and, compared to the marginal revenue product and the wage costs for another employee, a few weeks’ vacancy costs seem to be relatively unimportant in the decision on whether to hire someone.
The results suggest that convex labor adjustment costs are important for employment dynamics. For more fine-tuning of the best approach to specifying convex adjustment costs, one can turn to results in other studies such as Mertz and Yashiv (Reference Mertz and Yashiv2007) and Mumtaz and Zanetti (Reference Mumtaz and Zanetti2015).
Adding a reasonable degree of price rigidity to the model through quadratic price adjustment costs makes the employment responses to changes in labor market conditions slightly smaller but does not change the conclusions. Footnote 18
To say something more precise about macro outcomes, I would have to set up a general equilibrium model. Footnote 19 However, if the firm-level employment effects are typically very small, the aggregate effects are also expected to be small.
2.4.4 Simulations using estimated matching elasticities
Since I have data for the number of vacancies and unemployed for each local labor market in Sweden each month 1992m1–2011m12, I can use this data to estimate the coefficients in the matching function. The results are presented in Appendix D. The number of unemployed in the local labor market has a rather small positive effect on the vacancy filling rate. The estimated effect is not robust, and in some specifications, there is no effect at all. The number of vacancies, on the other hand, has a significant, negative, and robust effect on the vacancy filling rate.
One reason for the weak estimated effect of the number of unemployed on the vacancy filling rate may be that the employed job seekers and those out of the labor force constitute a large share of all job seekers. Footnote 20 Additionally, it may be hard for unemployed workers to compete with employed workers searching on the job. Footnote 21 There could furthermore be such a serious skill mismatch that those who are unemployed to a large extent cannot do the types of job for which there are vacancies. Footnote 22
Setting
 $\alpha_{U} = 0.2$
and
 $\alpha_{V}-1 = -0.3$
, roughly consistent with the estimated results, the employment responses to shocks to the number of unemployed and the number of vacancies decrease (see row 11 in Table 3). The employment response to the typical vacancy shock is 0.5% (0.8 in the baseline), and the response to the typical unemployment shock is 0.1% (0.3 in the baseline). The employment responses to 1% shocks are even closer to zero than in the baseline. Setting
 $\alpha_{U} = 0$
, consistent with several robustness checks, the employment response to a change in the number of unemployed is of course zero.
2.4.5 Different stages of the labor market
Michaillat (Reference Michaillat2012) found that matching frictions are less important in recessions, when the probability of filling a vacancy is high, than they are in booms. I will not test his exact theoretical model because it is different than the model adopted in this paper. However, looking at aggregate monthly data for Sweden in 1970–2014 in Figure 2, one can see that the mean vacancy filling rate has been higher in recessions (though this pattern is less obvious after around the year 2000). Footnote 23 The vacancy filling rate was particularly high during the deep crisis in the early 1990s. According to simulations, a shock of the same size to the probability of filling a vacancy has a smaller impact on employment when the mean probability of filling a vacancy is high; see rows 12–13 in Table 3. When the probability of filling a vacancy is already at a high level, the duration of vacancies is short and the costs associated with vacancies are small, so a typical shock to these costs has a small effect. Footnote 24 Hence, search and matching frictions seem to be less important in a recession. Footnote 25
Monthly aggregate vacancy filling rate in Sweden.
Notes: Monthly data in 1970–2014. The variable Q is defined as the outflow of vacancies during the month in relation to the mean stock of vacancies each month. The variable Q_sa is a seasonally adjusted version of Q. The variable is calculated using data series from AMS/AF (Swedish Public Employment Service). For more information about the data, see Appendix D. For the probability of filling a vacancy plotted together with the number of unemployed and the number of vacancies in some important local labor markets in 1992–2011, see Figure A.1 in Appendix D.

The model used in this study assumes a log-linear form of the matching function in the labor market, which is standard in the search and matching literature. If there is a nonlinearity such that the coefficients in the Q-function are different at different levels of unemployment and vacancies, this nonlinearity will lead to further differences across different stages of the business cycle. In Table A.4, Appendix D, I show some empirical estimation results indicating a nonlinearity; in particular, the unemployment effect seems to be a bit larger when unemployment is at a low level and then decreases when unemployment increases.
Explaining firms’ employment

Note: Robust standard errors are in parentheses, clustered at the firms. ***, **, and * denote significance at the 1%, 5%, and 10% levels, respectively. Yearly data for firms in Sweden with at least 10 employees 1996–2008 are included, equaling approximately 140 000 observations. In the 2SLS estimations (“xtivreg2” in Stata), the mean log stocks of unemployed and vacancies are instrumented with the log stocks at the end of the previous period, and the wage cost of the firm is instrumented with a measure where the nominal wage part is the mean wage for all the firms in the industry except the firm itself. In the Arellano-Bond estimation (“xtabond2” in Stata), the instruments used are three lags of the stocks of vacancies and unemployed at the end of the previous period, the second and third lag of employment, and three lags of product demand and industry real wage costs. The instruments seem to be relevant but not particularly valid, so the results should be interpreted with caution. It is hard to find a relevant and valid instrument set. An instrument set only including lags of product demand and real wage costs seems to be valid (according to the Hansen test), but the relevance of this instrument set for the lag of the firm’s employment, the number of unemployed and the number of vacancies in the local labor market seems to be low, and the resulting coefficients for these variables do not seem reasonable.
3 Empirical Estimation of Determinants of Employment on the Firm Level
The model used in this paper has been applied to data by Carlsson et al. (Reference Carlsson, Eriksson and Gottfries2013) and by Eriksson and Stadin (2015). The reason to apply it to data yet another time is that I have access to richer data. In the first case, they used yearly data for only a few hundred firms in manufacturing in the 1990s, a period dominated by a deep recession in Sweden. As been emphasized by Michaillat (Reference Michaillat2012), the state of the business cycle may matter for the results. In the second case, they used monthly data for all local labor markets in Sweden 1992–2008, but no firm-level data. Firm-level data are richer in information and measure variables at the level where employment decisions are made. In this section, I will estimate an employment equation that is derived from the theoretical model using yearly data for firms in all sectors in Sweden 1996–2008, a period including all stages of the business cycle. Unfortunately, firm-level data are not available at the monthly frequency.
3.1 Data and Empirical Specification
3.1.1 Data
Register data for firms in Sweden are used together with other data from Statistics Sweden, the OECD, and the Swedish Public Employment Service. Only firms that have had at least 10 employees in all their years of existence are included in the estimations because export data do not exist for all firms with fewer than 10 employees. However, this limitation is also motivated by the fact that there are many large percentage changes for very small firms. Furthermore, many small firms consist of one person with no intention to employ others. For such firms, it would be more interesting to study the number of firms rather than employment growth in existing firms.
To diminish attrition bias, all firms with at least 10 employees in all their years of existence are included, instead of for each year including all the firms with at least 10 employees that year. Otherwise, firms with approximately 10 employees would be likely to drop out when they experience a negative shock and then return to the data when experiencing a positive shock, leading to series with missing observations for years with bad shocks for these firms. Using the current definition, such firms are not included in any year. As a robustness check, only large firms with a mean of at least 50 employees are used. This is a limit far above the 10-limit, such that there could be large negative shocks and the firms would still be included in the sample.
The panel is unbalanced since new firms enter the sample and others exit during the sample period. The surviving firms do not constitute a random sample from the population of all firms. Furthermore, the 10-employee rule described above makes the sample less representative. Thus, one should keep in mind that the firms in my sample are typically larger, older, and more profitable than the population of all firms.
Since this study focuses on employment changes caused by changes in labor and product market conditions, it is relevant to try to diminish the noise caused by firms buying and selling establishments. It is not obvious when a firm is different enough to be seen as a new firm and hence should be given a new firm identification number in the dataset. In this study, the firm identities are the FAD units from Statistics Sweden. The FAD units are based on the organizational numbers, but the FAD unit number changes if there are large mergers or splits affecting more than 50% of the workforce even though the organizational number is still the same. Footnote 26
The number of employed workers is defined as the reported full-year equivalents of the number of employees at each firm. The nominal mean wage at the firm is instrumented with a wage measure that is defined as the nominal total wage sum for all other firms in the same industry divided by the number of employees at these firms (the firm itself is excluded to make the variable more exogenous). The real wage cost is defined as the nominal wage cost divided by the market price relevant for the firm.
The variables representing product demand and market price are constructed using data from Statistics Sweden and the OECD. Similar variables have been used by Carlsson et al. (Reference Carlsson, Eriksson and Gottfries2013) and Eriksson and Stadin (Reference Eriksson and Stadin2017). Product demand is an index including both domestic and foreign demand at the industry level weighted together using the firm-specific mean export share over the sample period. To avoid simultaneity due to unobserved industry-specific shocks, industry production is not used when constructing the measure of industry-specific domestic demand. Instead, product demand is constructed to be as exogenous to the firm as possible using only data for aggregate components of domestic demand, data for foreign demand, and weights that do not vary over time. Similarly, the competitors’ price measure consists of domestic and international product prices at the industry level weighted together by fixed, firm-specific export shares. For more information about these two variables, see Appendix F.
The data for vacancies cover the stock of vacancies registered at the Swedish Public Employment Service in the local labor market. The yearly measure that I use is the mean of the monthly stocks during the year. Many vacancies were never announced at the Public Employment Service, even though it was mandatory to do so, Footnote 27 but this is the best measure of vacancies available for the period studied. Unemployment is measured by the number of openly unemployed workers registered at the Public Employment Service in each local labor market, and, again, the yearly measure is the mean of the monthly stocks. There is a strong incentive for unemployed workers to register since this is required to qualify for unemployment benefits. These measures of vacancies and unemployed can be compared to survey measures from Statistics Sweden using aggregate data in the 2000s; see Appendix E, Figure A.4.
Local labor markets consist of one or more municipalities, and they are entities constructed by Statistics Sweden to be geographical areas that are as independent as possible in terms of labor demand and supply (see Appendix G). Firms with several establishments are assigned the local labor market of the main establishment reported in the data. As a robustness check, the regression is run for the firms with only one establishment. A firm switching labor market number is assigned the local labor market to which it belonged for the longest period of time. More than 90% of the firms are located in the same local labor market throughout their period of existence.
Industries are classified according to SNI codes at the two-digit level (see Appendix G). More than 90% of the firms are in the same industry throughout the time period that they exist in the data. A firm changing industry is assigned the industry to which it belonged for the longest period of time. Typically, a firm does not completely change its production, but a small change in the composition of goods can occasionally lead to a change in industry classification.
The employees at the approximately 33 800 firms included in the estimation dataset are in all sectors of the economy and constitute 30% of total employment in Sweden. The mean number of employees per firm is approximately 80.
The empirical specification is as follows:
 \begin{equation}{{\rm lnN}}_{{\rm i,t}} = {\beta }_{{\rm 0,i}}+{\beta }_{{\rm 1}}{{\rm lnN}}_{{\rm i,t-1}}{+}{{\beta }_{{\rm 2}}{\rm lnD}}_{{\rm i,t}} + {\beta }_{{\rm 3}}{{\rm lnW}}^{{\rm r}}_{{\rm i,t}} + {\beta }_{{\rm 4}}{{\rm lnU}}_{{\rm i}\left({\rm n}\right){\rm ,t}} + {{\beta }_{{\rm 5}}{\rm lnV}}_{{\rm i}\left({\rm n}\right){\rm ,t}} {+} {{\rm d}}_{{\rm t}} {+} \in_{{\rm i,t}}.\end{equation}
The specification is based on the solution to the model in Section 2 (see equation (2) and the derivation of the empirical specification in Carlsson et al. Reference Carlsson, Eriksson and Gottfries2013). Employment at the firm is expected to depend positively on product demand, negatively on real wage costs, positively on the number of unemployed workers available and negatively on the number of vacancies posted in the same local labor market. Since there are convex adjustment costs in the model, firms do not adjust employment immediately. High employment in the previous period implies that employment will be higher also in the current period.
Fixed effects for firms are included in all regressions (
 ${\beta }_{{\rm 0,i}}$
), and time dummies for each year 1996–2008 (
 ${{\rm d}}_{{\rm t}}$
) are included to control for unobserved aggregate shocks, common cyclicality, and common time trends.
Footnote 28
The standard errors are clustered at the firms to make them robust to autocorrelation and heteroskedasticity.
Footnote 29
In robustness checks, I also include industry-level trends and local trends, mainly to control for productivity trends that are not common for all firms. Furthermore, one robustness check includes a measure of local value-added per worker to also control for changes in local productivity that do not follow a trend.
The variables
 ${{\rm lnU}}_{{\rm i(n),t}}$
and
 ${{\rm lnV}}_{{\rm i(n),t}}$
are instrumented with the stocks at the end of the previous year to make them predetermined and hence reduce simultaneity problems.
Footnote 30
To use lags as instruments for stocks of vacancies and unemployed is common in the literature estimating matching functions but can be problematic if shocks are serially correlated. One approach to make the vacancy measure more exogenous would be to subtract the firm’s own vacancies from the vacancies in the local labor market, but unfortunately there are no data for the number of vacancies at the firm level. The wage cost of the firm is instrumented with a wage cost measure where the nominal wage part is the mean wage for all the firms in the industry except the firm itself.
Since the time dimension is not very long in my data (13 years), there is a possible dynamic panel bias. Part of the coefficient for the lagged dependent variable may be picked up by the firm-fixed effects, a bias that diminishes when the number of periods increases. Footnote 31 Arellano and Bond (Reference Arellano and Bond1991) suggested handling this problem by first differencing the fixed effects away and then instrumenting the lagged dependent variable with older lags in a GMM-type estimation. I first do fixed effects 2SLS estimations and then difference GMM estimations as a robustness check. However, for the GMM method to be more reliable than the 2SLS, it is essential to find a good instrument set that is both relevant and valid, and this is difficult.
3.2 Estimation Results
Estimation results are shown in Tables 4 and 5, with column 1 in both tables showing the baseline specification. The coefficients for unemployment and vacancies in the local labor market are small, and they have the opposite sign to that predicted by the theory. They are weakly statistically significant in the main specification but not significant in several of the robustness checks. The expected effects are also absent in the case when only one-establishment firms are included in the estimation, that is, firms that have a stronger connection to the local labor market (see column 4, Table 5). Furthermore, the expected effects are also absent when only including a time period with no recession, 2000–2007. Coefficient estimates close to zero are consistent with the prediction from the theoretical simulations, allowing for imperfect competition in the product market and convex labor adjustment costs.
Explaining firms’ employment, robustness

Note: Robust standard errors are in parentheses, clustered at the firms. ***, **, and * denote significance at the 1, 5, and 10% levels, respectively. Yearly data for firms in Sweden with at least 10 employees 1996–2008. The mean log stocks of unemployed and vacancies are instrumented with the log stocks at the end of the previous period. The wage cost of the firm is instrumented with a measure where the nominal wage part is the mean wage for all the firms in the industry except the firm itself. Productivity is measured as the log of total real value-added per employee for all firms in the local labor market except the firm itself. If tightness (V/U) is included as an explanatory variable instead of vacancies and unemployment separately, the coefficient for this variable is 0.012 and everything else is as in the baseline.
The unexpected signs for the coefficients for vacancies and unemployed in the local labor market might be an indication that there is a problem of lack of exogeneity in the instruments used (the stocks at the end of last period). One reason for this lack could be changes in local productivity. Controlling for value-added per employee for all the other firms in the local labor market as a proxy for local productivity does not change the results (see column 2, Table 5). Another issue is that matching processes are probably better studied using higher frequency data, since the number of unemployed and the number of vacancies vary substantially during the year. Footnote 32 Moreover, the expected effects from 1% shocks in the simulations are very small; if this expectation is correct, it is probably hard to empirically identify these effects precisely.
There is a positive employment effect of product demand that is significant and robust. This result confirms that imperfect competition in the product market should be taken into account when studying employment dynamics. If the product market is perfectly competitive, so that firms can sell whatever they produce at a prevailing market price, product demand should not have a direct effect on hiring. Footnote 33 The large coefficient for the lag of employment in all specifications indicates a sluggish response, which could be explained by convex adjustment costs.
The real wage costs have a small and negative employment effect that is not robust. When I do not instrument the mean wage cost per employee at the firm, the negative coefficient for the real wage cost becomes notably larger and robust. Footnote 34 Omitting the real wage cost variable, which is reasonable if wages are endogenous, has very little effect on the estimated coefficients for the other explanatory variables (see column 3, Table 5).
Inclusion of industry-specific linear time trends in addition to the time dummies causes the wage measure to lose its negative significance, while the coefficient for the product demand variable is increased (see column 2, Table 4). Inclusion of local time trends in addition to the time dummies has very little effect on the estimation results. Including local and industry-specific linear trends but no time dummies in the regression yields results similar to when these trends are included in addition to the time dummies. Including neither time dummies nor industry time trends yields results similar to the baseline.
Including only large firms (column 5, Table 5) or using groups of firms with the same owner as units in the estimation (column 6, Table 5) has no important effect on the results. Including only firms existing all 13 years, that is, balancing the panel, has very little effect on the results except for a slightly larger coefficient for the lag of employment (as expected since the dynamic panel bias toward zero diminishes as the time dimension increases). If I only include firms in manufacturing in the sample, there is, somewhat surprisingly, no statistical significance for the wage effect, but the product demand effect becomes stronger.
A product demand effect on employment is present in all robustness checks. There are other studies emphasizing the importance of product demand. Carlsson et al. (Reference Carlsson, Eriksson and Gottfries2013) found support for product demand to be important for explaining employment dynamics of Swedish manufacturing firms in 1992–2000, and in another closely related paper, Eriksson and Stadin (Reference Eriksson and Stadin2017) found that product demand was important for hiring in local labor markets in Sweden in 1992–2008. Michaillat and Saez (Reference Michaillat and Saez2015) used US data and concluded that labor market fluctuations are mostly explained by labor demand shocks reflecting aggregate demand shocks (and not by shocks to labor supply or technology).
4 Conclusions
In this paper, search and matching frictions are studied from the point of view of firms. According to search and matching theory, hiring should increase when it is easier to recruit workers. The existence of more unemployed workers and fewer vacancies at other firms should have a positive effect on hiring. Numerical simulation of a theoretical model of a firm facing search frictions without convex adjustment costs and with perfect competition in the product market (standard assumptions in the search and matching literature) shows large effects on hiring of changes in labor market conditions.
Relaxing these two assumptions, thus including more realism concerning firms’ conditions and hence labor demand, has considerable impact on employment dynamics. Numerical simulations including convex adjustment costs and imperfect competition in the product market show a relatively small employment effect of a typical shock to the number of vacancies and a very small employment effect of a typical shock to the number of unemployed. The employment effects of 1% shocks of both types are almost zero. The conclusion is that even if the number of unemployed and the number of vacancies in the labor market affect the time required to fill a vacancy, this situation does not seem to matter much for a firm’s decision whether to hire. Footnote 35
Empirical estimation results using firm-level data for all sectors of the economy and all stages of the business cycle suggest that neither the number of unemployed nor the number of vacancies in the local labor market are important for firms’ employment decisions. This result indicates that search frictions are of small importance. Instead, the estimations show a robust positive employment effect of increased product demand and a weak negative employment effect of increased real wage costs.
The empirical results are roughly consistent with those of Carlsson et al. (Reference Carlsson, Eriksson and Gottfries2013) and are consistent with the results of Eriksson and Stadin (Reference Eriksson and Stadin2017) using deregistration of vacancies as the dependent variable. When instead using the hiring of unemployed workers as the dependent variable, Eriksson and Stadin (Reference Eriksson and Stadin2017) found a positive effect of the number of unemployed. In many studies of the matching function, unemployment is estimated to have a significantly positive effect on hiring of unemployed workers. However, it is only in the simplest search and matching model that the filling of a vacancy is the same thing as the hiring of an unemployed worker. A large fraction of the vacancies is filled by workers who go directly between jobs or enter from out of the labor force.Footnote 36 Matching is not the same thing when examined from the perspective of a firm as when looking at it from the perspective of an unemployed worker.
Acknowledgements
I am grateful for helpful comments from Steve Bond, Mikael Carlsson, Nils Gottfries, Niels-Jakob Harbo Hansen, Bertil Holmlund, Helena Holmlund, Per Krusell, Johan Lyhagen, Florin Maican, Erik Mellander, Pascal Michaillat, Håkan Selin, Eran Yashiv, editors and anonymous referees, and seminar participants at Uppsala University (the Department of Economics and UCLS), the NORMAC Symposium in Smögen, the EALE conference in Turin, and Södertörn University. Financial support from the Wallander & Hedelius Foundation and IFAU is gratefully acknowledged.
Appendices
Appendix A: Derivation of the Euler Equation Determining Employment
When deciding on the number of workers to recruit, a firm maximizes current revenues from workers’ production (R) minus wage costs and costs for recruiting new workers plus the expected present value of the profit from workers’ future work. The firm enters the period with a given number of employees from last period,
 ${{\rm N}}_{{\rm i,t-1}}$
, and observes the current values of the exogenous variables,
 ${{\rm exo}}_{{\rm t}} = {{\rm Q}}_{{\rm n,t}},\ {{\rm D}}_{{\rm i,t}},\ {{\rm P}}^{{\rm C}}_{{\rm i,t}},{{\rm W}}^{{\rm r}}_{{\rm i,t}}$
, when deciding the number of vacancies to open. The probability of filling a vacancy (
 ${{\rm Q}}_{{\rm n,t}}$
) is a function of the state of the labor market (
 ${{\rm V}}_{{\rm n,t}}$
and
 ${{\rm U}}_{{\rm n,t}}$
). The wage cost is marked in gray since in a more general case, it could be endogenous. I start with a more general formulation and then make it more specific, consistent with Carlsson et al. (Reference Carlsson, Eriksson and Gottfries2013). All variables and parameters have been defined in Section 2.
The Bellman equation is as follows:
 \begin{align*} {\rm V}\!\left({{\rm N}}_{{\rm i,t-1}};{{\rm exo}}_{{\rm t}}\right) =\, & {\mathop{\max }_{{{\rm V}}_{{\rm i,t}}} {\rm R}\!\left({{\rm N}}_{{\rm i,t}},{{\rm D}}_{{\rm i,t}}{\rm ,\ }{{\rm P}}^{{\rm C}}_{{\rm i,t}}\right)\ }{\rm -}{{\rm W}}^{{\rm r}}_{{\rm i,t}}{{\rm N}}_{{\rm i,t}}{\rm -C}\!\left({{\rm H}}_{{\rm i,t}}{{\rm ,N}}_{{\rm i,t-1}}\right){\rm -}{{\rm c}}_{{\rm V}}{{\rm V}}_{{\rm i,t}}\\& + \beta \ {{\rm E}}_{{\rm t}}\!\left\{{\rm V}\!\left({{\rm N}}_{{\rm i,t}};{{\rm exo}}_{{\rm t+1}}\right)\right\}\end{align*}
where
 ${{\rm H}}_{{\rm i,t}} = {{\rm Q}}_{{\rm n,t}}{{\rm V}}_{{\rm i,t}}$
and
 ${{\rm N}}_{{\rm i,t}} = {{\rm H}}_{{\rm i,t}} + \left({\rm 1-}\lambda \right){{\rm N}}_{{\rm i,t-1}}$
;
 ${\rm i.e.}{\rm \ }{\rm \ }{{\rm H}}_{{\rm i,t}} = {{\rm N}}_{{\rm i,t}}-\left({\rm 1-}\lambda \right){{\rm N}}_{{\rm i,t-1}}\ $
and
 ${{\rm V}}_{{\rm i,t}} = \frac{{{\rm N}}_{{\rm i,t}}-\left({\rm 1-}\lambda \right){{\rm N}}_{{\rm i,t-1}}}{{{\rm Q}}_{{\rm n,t}}}$
.
With a restriction to constant returns to scale, the hiring cost function simplifies to
 \begin{equation*}{\rm C}\!\left({{\rm H}}_{{\rm i,t}}{{\rm ,N}}_{{\rm i,t-1}}\right) = {{\rm N}}_{{\rm i,t-1}}{\rm C}\left(\frac{{{\rm H}}_{{\rm i,t}}}{{{\rm N}}_{{\rm i,t-1}}},\ 1\right) = {\rm C}\left(\frac{{{\rm H}}_{{\rm i,t}}}{{{\rm N}}_{{\rm i,t-1}}}\right){{\rm N}}_{{\rm i,t-1}}.\end{equation*}
Substituting out
 ${{\rm V}}_{{\rm i,t}}$
and
 ${\rm \ }{{\rm H}}_{{\rm i,t}}$
the functional equation can be rewritten:
 \begin{align*}{\rm V}\!\left({{\rm N}}_{{\rm i,t-1}};{{\rm exo}}_{{\rm t}}\right) =\, & {\mathop{\max}\nolimits_{{{\rm N}}_{{\rm i,t}}} {\rm R}\!\left({{\rm N}}_{{\rm i,t}},{{\rm D}}_{{\rm i,t}}{\rm ,\ }{{\rm P}}^{{\rm C}}_{{\rm i,t}}\right)\ }{\rm -}{{\rm W}}^{{\rm r}}_{{\rm i,t}}{{\rm N}}_{{\rm i,t}}{{\rm -}{\rm C}\!\left(\frac{{{\rm N}}_{{\rm i,t}}-\left({\rm 1-}\lambda \right){{\rm N}}_{{\rm i,t-1}}}{{{\rm N}}_{{\rm i,t-1}}}\right){{\rm N}}_{{\rm i,t-1}}}\\& - {{{\rm c}}_{{\rm V}}\frac{{{\rm N}}_{{\rm i,t}}-\left({\rm 1-}\lambda \right){{\rm N}}_{{\rm i,t-1}}}{{{\rm Q}}_{{\rm n,t}}} + \beta {\rm \ E}_{{\rm t}}}\!\left\{{\rm V}\!\left({{\rm N}}_{{\rm i,t}};{{\rm exo}}_{{\rm t+1}}\right)\right\},\end{align*}
and the one-period payoff function is
 \begin{align*} {\rm F}\!\left({{\rm N}}_{{\rm i,t}},{{\rm N}}_{{\rm i,t-1}},{{\rm D}}_{{\rm i,t}},{\rm \ }{{\rm P}}^{{\rm C}}_{{\rm i,t}},{{\rm W}}^{{\rm r}}_{{\rm i,t}},{{\rm Q}}_{{\rm n,t}}\right) =\, & {\rm R}\!\left({{\rm N}}_{{\rm i,t}}{{\rm ,D}}_{{\rm i,t}},{{\rm P}}^{{\rm C}}_{{\rm i,t}}\right){\rm -}{{\rm W}}^{{\rm r}}_{{\rm i,t}}{{\rm N}}_{{\rm i,t}}\\ &- {\rm C}\!\left(\frac{{{\rm N}}_{{\rm i,t}}-\left({\rm 1-}\lambda \right){{\rm N}}_{{\rm i,t-1}}}{{{\rm N}}_{{\rm i,t-1}}}\!\right)\!{{\rm N}}_{{\rm i,t-1}}{\rm -}{{\rm c}}_{{\rm V}}\frac{{{\rm N}}_{{\rm i,t}}{-}\left({\rm 1-}\lambda \right)\!{{\rm N}}_{{\rm i,t-1}}}{{{\rm Q}}_{{\rm n,t}}}.\end{align*}
The optimal number of employees at the firm is determined where
 \begin{equation*}\frac{\partial {\rm F}\left({{\rm N}}_{{\rm i,t}},{{\rm N}}_{{\rm i,t-1}},{{\rm D}}_{{\rm i,t}},{\rm \ }{{\rm P}}^{{\rm C}}_{{\rm i,t}},{{\rm W}}^{{\rm r}}_{{\rm i,t}},{{\rm Q}}_{{\rm n,t}}\right)}{\partial {{\rm N}}_{{\rm i,t}}}+\beta {{\rm E}}_{{\rm t}}\!\left\{{{\rm V}}^{'}\!\left({{\rm N}}_{{\rm{i,t}}};{{\rm exo}}_{{\rm{t}+1}}\right)\right\} = 0\end{equation*}
The envelope theorem implies that the Euler equation is equivalent to
 \begin{equation*}\frac{\partial {\rm F}\!\left({{\rm N}}_{{\rm i,t}},{{\rm N}}_{{\rm i,t-1}},{{\rm D}}_{{\rm i,t}},\ {{\rm P}}^{{\rm C}}_{{\rm i,t}},{{\rm W}}^{{\rm r}}_{{\rm i,t}},{{\rm Q}}_{{\rm n,t}}\right)}{\partial {{\rm N}}_{{\rm i,t}}}+\beta {{\rm E}}_{{\rm t}}\!\left\{\frac{\partial {\rm F}\!\left({{\rm N}}_{{\rm i,t+1}},{{\rm N}}_{{\rm i,t}},{{\rm D}}_{{\rm i,t+1}},\ {{\rm P}}^{{\rm C}}_{{\rm i,t+1}},{{\rm W}}^{{\rm r}}_{{\rm i,t+1}},{{\rm Q}}_{{\rm n,t+1}}\right)}{\partial {{\rm N}}_{{\rm i,t}}}\!\right\} = 0\end{equation*}
In this paper, the following more specific model formulation is used: Footnote 37
 \begin{align*}{\rm V}\!\left({{\rm N}}_{{\rm i,t-1}};{{\rm Q}}_{{\rm n,t}},{{\rm D}}_{{\rm i,t}},\ {{\rm P}}^{{\rm C}}_{{\rm i,t}},{{\rm W}}_{{\rm i,t}}\right) = \, & {\mathop{\max }\nolimits_{{{\rm V}}_{{\rm i,t}}} \frac{{{\rm P}}_{{\rm i,t}}{{\rm Y}}_{{\rm i,t}}}{{{\rm P}}^{{\rm C}}_{{\rm i,t}}}-\frac{{{\rm W}}_{{\rm i,t}}}{{{\rm P}}^{{\rm C}}_{{\rm i,t}}}{{\rm N}}_{{\rm i,t}}\ }{\rm -}\frac{{{\rm c}}_{{\rm H}}}{{\rm 2}}{\left(\frac{{{\rm H}}_{{\rm i,t}}}{{{\rm N}}_{{\rm i,t-1}}}\right)}^{{\rm 2}}{{\rm N}}_{{\rm i,t-1}}{\rm -}{{\rm c}}_{{\rm V}}{{\rm V}}_{{\rm i,t}}\\& + \beta \ {{\rm E}}_{{\rm t}}\!\left\{{\rm V}\!\left({{\rm N}}_{{\rm i,t}};{{\rm Q}}_{{\rm n,t+1}},{{\rm D}}_{{\rm i,t+1}},\ {{\rm P}}^{{\rm C}}_{{\rm i,t+1}},{{\rm W}}_{{\rm i,t+1}}\right)\right\}\end{align*}
s.t.
 ${{\rm N}}_{{\rm i,t}} = {{\rm H}}_{{\rm i,t}} + \left({\rm 1-}\lambda \right){{\rm N}}_{{\rm i,t-1}}$
,
 ${{\rm H}}_{{\rm i,t}} = {{\rm Q}}_{{\rm n,t}}{{\rm V}}_{{\rm i,t}}$
,
 ${{\rm Y}}_{{\rm i,t}} = {{\rm N}}_{{\rm i,t}}$
, and
 ${{\rm Y}}_{{\rm i,t}} = {\left(\frac{{{\rm P}}_{{\rm i,t}}}{{{\rm P}}^{{\rm C}}_{{\rm i,t}}}\right)}^{{\rm -}\eta }{{\rm D}}^{\sigma }_{{\rm i,t}}$
.
The constraints can be rewritten
 ${{\rm H}}_{{\rm i,t}} = {{\rm N}}_{{\rm i,t}}{\rm -}\left({\rm 1-}\lambda \right){{\rm N}}_{{\rm i,t-1}}$
,
 ${{\rm V}}_{{\rm i,t}} = \frac{{{\rm H}}_{{\rm i,t}}}{{{\rm Q}}_{{\rm n,t}}}$
,
 ${{\rm Y}}_{{\rm i,t}} = {{\rm N}}_{{\rm i,t}}$
, and
 ${{\rm P}}_{{\rm i,t}} = {\left(\frac{{{\rm N}}_{{\rm i,t}}}{{{\rm D}}^{\sigma }_{{\rm i,t}}}\right)}^{-\frac{{\rm 1}}{\eta }}{{\rm P}}^{{\rm C}}_{{\rm i,t}}$
and be substituted into the expression as follows:
 \begin{align*}{\rm V}\!\left({{\rm N}}_{{\rm i,t-1}};{{\rm Q}}_{{\rm n,t}},{{\rm D}}_{{\rm i,t}},\ {{\rm P}}^{{\rm C}}_{{\rm i,t}},{{\rm W}}_{{\rm i,t}}\right) = \, & {\mathop{\max }\nolimits_{{{\rm N}}_{{\rm i,t}}} {\left(\frac{{{\rm N}}_{{\rm i,t}}}{{{\rm D}}^{\sigma }_{{\rm i,t}}}\right)}^{-\frac{{\rm 1}}{\eta }}{{\rm P}}^{{\rm C}}_{{\rm i,t}}-\frac{{{\rm W}}_{{\rm i,t}}}{{{\rm P}}^{{\rm C}}_{{\rm i,t}}}{{\rm N}}_{{\rm i,t}}\ }\\& - \frac{{{\rm c}}_{{\rm H}}}{{\rm 2}}{\left({{\rm N}}_{{\rm i,t}}{\rm -}\left({\rm 1-}\lambda \right){{\rm N}}_{{\rm i,t-1}}\right)}^{{\rm 2}}{{{\rm N}}_{{\rm i,t-1}}}^{{\rm -1}}{\rm -}\frac{{{\rm c}}_{{\rm V}}}{{{\rm Q}}_{{\rm n,t}}}\!\left({{\rm N}}_{{\rm i,t}}{\rm -}\!\left({\rm 1-}\lambda \right)\!{{\rm N}}_{{\rm i,t-1}}\right)\\& +\beta \ {{\rm E}}_{{\rm t}}\!\left\{{\rm V}\!\left({{\rm N}}_{{\rm i,t}};{{\rm Q}}_{{\rm n,t+1}},{{\rm D}}_{{\rm i,t+1}},\ {{\rm P}}^{{\rm C}}_{{\rm i,t+1}},{{\rm W}}_{{\rm i,t+1}}\right)\right\}\end{align*}
Maximizing with respect to the number of employees,
 ${{\rm N}}_{{\rm i,t}}$
, and using the envelope theorem yields the following first-order condition, the Euler equation used in this paper:
 \begin{equation*}{{\rm E}}_{{\rm t}}\!\left\{ \begin{array}{l}\frac{\eta {\rm -1}}{\eta }{\left(\frac{{{\rm D}}^{\sigma }_{{\rm i,t}}}{{{\rm N}}_{{\rm i,t}}}\right)}^{\frac{{\rm 1}}{\eta }} - \frac{{{\rm W}}_{{\rm i,t}}}{{{\rm P}}^{{\rm C}}_{{\rm i,t}}}{\rm -}{{\rm c}}_{{\rm H}}\!\left({{\rm N}}_{{\rm i,t}}{\rm -}\left({\rm 1-}\lambda \right){{\rm N}}_{{\rm i,t-1}}\right){{{\rm N}}_{{\rm i,t-1}}}^{{\rm -1}}{\rm -}\frac{{{\rm c}}_{{\rm V}}}{{{\rm Q}}_{{\rm n,t}}} \\[8pt]\qquad + \beta {{\rm c}}_{{\rm H}}\!\left({{\rm N}}_{{\rm i,t+1}}{\rm -}\left({\rm 1-}\lambda \right){{\rm N}}_{{\rm i,t}}\right){{\left({\rm 1-}\lambda \right){\rm N}}_{{\rm i,t}}}^{{\rm -1}} \\[8pt] + \beta \frac{{{\rm c}}_{{\rm H}}}{{\rm 2}}{\left({{\rm N}}_{{\rm i,t+1}}{\rm -}\left({\rm 1-}\lambda \right){{\rm N}}_{{\rm i,t}}\right)}^{{\rm 2}}{{{\rm N}}_{{\rm i,t}}}^{{\rm -2}} + \beta \left({\rm 1-}\lambda \right)\frac{{{\rm c}}_{{\rm V}}}{{{\rm Q}}_{{\rm n,t+1}}}{\rm = 0} \end{array}\right\}\ \end{equation*}
If a quadratic adjustment cost for the price is introduced, specified
 $\frac{\theta }{{\rm 2}}{\left(\frac{{{\rm P}}_{{\rm i,}\tau }}{{{\rm P}}_{{\rm i,}\tau {\rm -1}}}-1\right)}^{{\rm 2}}$
, the following terms will be added to the Euler equation:
 $+\frac{\theta }{\eta }\!\left(\frac{{{\rm P}}_{{\rm i,t}}}{{{\rm P}}_{{\rm i,t-1}}}-1\right)\left(\frac{{{\rm P}}_{{\rm i,t}}}{{{\rm P}}_{{\rm i,t-1}}}\right){{{\rm N}}_{{\rm i,t}}}^{{\rm -1}}-\beta \frac{\theta }{\eta }\!\left(\frac{{{\rm P}}_{{\rm i,t+1}}}{{{\rm P}}_{{\rm i,t}}}-1\right)\left(\frac{{{\rm P}}_{{\rm i,t}}+1}{{{\rm P}}_{{\rm i,t}}}\right){{{\rm N}}_{{\rm i,t}}}^{{\rm -1}}$
.
Appendix B: Derivation of the Quadratic Hiring Costs Parameter Value
The value of the parameter in the quadratic hiring costs is derived from the estimation of the Euler equation in Carlsson et al. (Reference Carlsson, Eriksson and Gottfries2013). Setting
 $\eta $
= 7 and
 $\sigma$
= 1.8 (motivated in Section 2.3), I can use their estimated coefficient for the product demand variable to derive a monthly value of 2.6. I use
 ${\gamma }_{{\rm d}} = \frac{\sigma \left(\eta {\rm -}{\rm 1}\right)}{{{\rm c}}_{{\rm H}}{\eta }^{{\rm 2}}}\ $
and calculate c
 ${}_{\rm H}$
per year as
 $1 \times (7-1)/(0.38 \times 7^{2}) \approx 0.58$
, and hence the monthly value as
 $0.58 \times 12 \approx 7$
.
Carlsson, Eriksson, and Gottfries themselves reported a yearly value of 1.1 for c
 ${}_{\rm H}$
, indicating a monthly value of 1.1
 $\times$
12
 $\approx $
13. However, this value is consistent with
 $\eta $
= 2.6, which is improbably small according to most earlier studies, implying a markup of over 60% in the product market, explaining why c
 ${}_{\rm H}$
= 13 is not used in the baseline but as a special case.
The rough relation between the yearly and monthly value can be derived as follows:
Approximately setting
 ${{\rm H}}^{{\rm y}}{\rm = 12}{{\rm H}}^{{\rm m}}$
(constant hiring during the year) and
 ${{\rm N}}_{{\rm t}} = {{\rm N}}_{{\rm t-1}}$
(constant N, i.e. few hires in relation to a large number of employees at the firm), the yearly costs are
 $\sum^{{\rm t = 12}}_{{\rm t = 1}}{\frac{{{\rm c}}^{{\rm m}}_{{\rm H}}}{{\rm 2}}}{\left(\frac{{{\rm N}}_{{\rm t}}{\rm -}\left({\rm 1-}\lambda \right){{\rm N}}_{{\rm t-1}}}{{{\rm N}}_{{\rm t-1}}}\right)}^{{\rm 2}}\approx {\rm 12}\frac{{{\rm c}}^{{\rm m}}_{{\rm H}}}{{\rm 2}}{\left(\frac{{{\rm H}}^{{\rm m}}}{{\rm N}}\right)}^{{\rm 2}} = {\rm 12}\frac{{{\rm c}}^{{\rm m}}_{{\rm H}}}{{\rm 2}}{\left(\frac{\frac{{{\rm H}}^{{\rm y}}}{{\rm 12}}}{{\rm N}}\right)}^{{\rm 2}} = \frac{{\rm 1}}{{\rm 12}}\frac{{{\rm c}}^{{\rm m}}_{{\rm H}}}{{\rm 2}}{\left(\frac{{{\rm H}}^{{\rm y}}}{{\rm N}}\right)}^{{\rm 2}}$
, and
 $\frac{{\rm 1}}{{\rm 12}}\frac{{{\rm c}}^{{\rm m}}_{{\rm H}}}{{\rm 2}}{\left(\frac{{{\rm H}}^{{\rm y}}}{{\rm N}}\right)}^{{\rm 2}} = \frac{{{\rm c}}^{{\rm y}}_{{\rm H}}}{{\rm 2}}{\left(\frac{{{\rm H}}^{{\rm y}}}{{\rm N}}\right)}^{{\rm 2}}\to {\rm \ }{{\rm c}}^{{\rm m}}_{{\rm H}}{\rm = 12}{{\rm c}}^{{\rm y}}_{{\rm H}}$
. If
 ${{\rm c}}^{{\rm m}}_{{\rm H}}$
is 12 times greater than
 ${{\rm c}}^{{\rm y}}_{{\rm H}}$
, there is approximately 12 times less adjustment per month than per year.
There is not extensive evidence concerning the size of quadratic hiring costs in the literature for comparison. In Mumtaz and Zanetti (Reference Mumtaz and Zanetti2015), there are estimates using quarterly US data. With a simplified specification not including capital (as in this paper), there is an estimate of a parameter value of 2.2, when at the same time, the costs are estimated to be in between quadratic and cubic, that is, the convex adjustment cost is
 $\frac{2.2}{2.6}{\left(\frac{{\rm H}}{{\rm N}}\right)}^{2.6}$
. Including capital and an interaction term between labor and capital adjustment costs, the adjustment costs for the (pure) hiring part are estimated to be cubic and the cost parameter value 2.4, that is, this part of the convex adjustment cost is estimated to be
 $\frac{2.4}{3.1}{\left(\frac{{\rm H}}{{\rm N}}\right)}^{3.1}$
. In Mertz and Yashiv (Reference Mertz and Yashiv2007), also using quarterly US data and including capital and an interaction term, the convex adjustment cost for the (pure) hiring part is also estimated to be roughly cubic, here with a cost parameter value of 2.8, that is,
 $\frac{2.8}{3.4}{\left(\frac{{\rm H}}{{\rm N}}\right)}^{3.4}$
. These estimates are not directly applicable since they stem from somewhat different specifications and a different time frequency; furthermore, they are estimated for a country not necessarily very similar to Sweden regarding labor market dynamics. However, a parameter value in a quadratic specification on monthly frequency could roughly be expected to be slightly less than 6.6 (three times larger to have three times less adjustment). This is not far from the value of 7 used for the parameter in the quadratic hiring cost function in this paper.
Appendix C: Aggregate Data Time Series Properties
Some summary statistics for aggregate monthly data for Sweden

Note: Monthly data for Sweden in 1992–2014. Variables are detrended and seasonally adjusted logs of the number of unemployed (U) and the number of vacancies (V) registered at the Swedish Public Employment Service (AF) and of the number of employed (N) according to Statistics Sweden (AKU).
Appendix D: Estimating Matching Elasticities
The Q-equation is estimated on monthly panel data from the Swedish Public Employment Service (AF) for 1992–2011. The data include the stock of vacancies registered at the Public Employment Service at the beginning of each month and the inflow of new vacancies during the month. Unemployment is measured by the number of openly unemployed workers registered at the Public Employment Service at the beginning of the month. The data from the Public Employment Service are measured at the municipality level and at a monthly frequency. I aggregate the data to obtain a dataset with variables for local labor markets. A local labor market consists of one or more municipalities and is constructed by Statistics Sweden to be a geographical area that is as independent as possible concerning labor demand and labor supply. All 90 local labor markets (in the 2000 version) are listed in Appendix G. (Using instead the 109 local labor markets according to the 1993 version has little effect on the results.) Figures A.1, A.2, and A.3 show some illustrations of the data.
Monthly data for unemployment, vacancies, and the vacancy filling rate for some large local labor markets in Sweden
Notes: Monthly data from AF (Swedish Public Employment Service) in 1992–2011. All variables are in logs and seasonally adjusted for each local labor market using dummies for month of the year.

Bubble scatter plots for some large local labor markets in Sweden.
Notes: The larger the vacancy filling rate, the larger is the bubble. All variables are in logs. Quarterly means of seasonally adjusted monthly values 1992–2011. Data from AF (Swedish Public Employment Service).

Plots of the vacancy filling rate (Q, y-axis) versus tightness (V/U, x-axis).
Notes: Variables are seasonally adjusted and not in logs. Stocks of the number of unemployed and vacancies are measured at the very beginning of the month. The y-axis shows q_w, which measures the mean probability of filling a vacancy within a week during the month. Monthly data from AF (Swedish Public Employment Service) for the three largest local labor markets in Sweden in 1992–2011. The mean aggregate tightness for Sweden in 1992–2011 is 0.1, and the mean probability of filling a vacancy within a week is 0.4.

The main estimation method is 2SLS with fixed effects for the local labor markets and time dummies. A test for constant returns to scale indicates decreasing returns to scale for column 1, Table A.2. Time dummies for each period are included to diminish the risk of biased estimates due to unobserved aggregate shocks. They address, for example, changes in regulation that change the variables at all local labor markets at a certain point in time. They also control for common seasonal effects and common time trends. Matching functions are typically estimated in log-linear form, as in columns 1–2 in Table A.2. In columns 3–4, a Poisson GMM estimation technique is used to deal with the potential problem of biased estimates due to log transformation in combination with heteroskedastic residuals (cf. Silvana and Tenreyro, 2006). This estimation method does not rely on log-linearization, and the dependent variable is Q instead of lnQ. The reason for the IV approach (col 1–4) is that unemployment and vacancies are simultaneously reduced by matches, which biases the estimated coefficients. Therefore, the lags, which are predetermined, are used as instruments for the mean log stocks in the period.
The variables do not seem to be stationary but rather trend-stationary around local trends, according to Fisher and Hadri tests. Thus, I want to include local trends in the estimations. However, theory suggests a long-term linear relation between the three variables lnQ, lnU, and lnV. I test for cointegration between these variables and find that a cointegrating relation is most likely present using Westerlund ECM panel tests (Westerlund, Reference Westerlund2007) and using Johansen and Engle-Granger tests for the aggregate data. Hence, the time trends are probably not necessary in the estimation. Tables A.2 and A.3 show estimations with and without the local trends included.
Explaining the vacancy filling rate

Notes: Robust standard errors are in parentheses, clustered at the local labor markets. ***, **, and * denote significance at the 1%, 5%, and 10% levels, respectively. Monthly data for all local labor markets in Sweden in 1992–2011 from AF (PES). All variables are in logs. Fixed effects for local labor markets are included in all regressions. 2SLS estimations where the mean log stocks of the number of unemployed and vacancies
 ${{\rm (}\overline{{\rm lnU}}}_{{\rm n,t}}$
and
 ${\overline{{\rm lnV}}}_{{\rm n,t}}$
) are instrumented with initial log stocks each month. The local time trends are both linear and quadratic.
Explaining the vacancy filling rate, robustness

Note: Robust standard errors are in parentheses, clustered at the local labor markets. ***, **, and * denote significance at the 1%, 5%, and 10% levels, respectively. Monthly data from AF for all local labor markets in Sweden 1992–2011. All variables are in logs. IV estimations where the mean log stocks of unemployment and vacancies are instrumented with initial log stocks each month in columns 1, 2, 5, and 6, and the differences in the mean log stocks are instrumented with lags of stocks in columns 3–4. All time trends are both linear and quadratic except for the local trends in col 3–4, which are only linear after the differentiation.
The local trends remove some of the variation that can be used to identify the effects. The standard deviations of the log variables (lnV and lnU) after removing the variation explained by fixed effects for local labor markets, time dummies and local time trends are still at least 0.12, which indicates that this is not a significant concern.
Data for the Aggregate Vacancy Filling Rate (Q)
Figure 2 shows the monthly mean vacancy filling rate in Sweden each month 1970–2014, calculated using data from the Swedish Public Employment Service. The data include the stock of vacancies registered at the Public Employment Service at the beginning of each month and the inflow of new vacancies during the month.
 ${\rm Qtot} = \left({{{\rm V}}_{{\rm t}}{\rm +F}}^{{\rm m}}_{{\rm t}}{\rm -}{{\rm V}}_{{\rm t}{\rm +1}}\right){\rm \div }\frac{{{\rm V}}_{{\rm t}} + {{\rm V}}_{{\rm t}{\rm +1}}}{{\rm 2}}$
, where
 ${{\rm F}}^{{\rm m}}_{{\rm t}} = $
inflow of vacancies during the month beginning at time t, V
 ${}_{t~}$
= stock of vacancies at the beginning of month t, and the outflow of vacancies is
 ${{{\rm V}}_{{\rm t}}{\rm +F}}^{{\rm m}}_{{\rm t}}{\rm -}{{\rm V}}_{{\rm t}{\rm +1}}$
.
The mean of this vacancy filling rate is 1.6, which implies that a vacancy has usually been filled within slightly more than one-half month. This duration seems to be consistent with earlier findings. Edin and Holmlund (Reference Edin, Holmlund and Schioppa1991) found that the average duration of registered vacancies varied in the range of 2 to 4 weeks in Sweden in 1970–1988. In Blanchard and Diamond (Reference Blanchard and Diamond1989), the average duration of vacancies in the USA in 1968–1981 also varied between 2 and 4 weeks.
Many vacancies are never announced at the Public Employment Service, even though doing so is mandatory (for private employers, it has no been mandatory since 2008), but this measure of vacancies is the best available for a longer time period. The fact that not all vacancies are registered is a problem if these vacancies are not representative of all vacancies, considering how quickly they are filled.
If many vacancies are closed without becoming filled, this measure of the vacancy filling rate is too large and not very good. According to a survey conducted by AF in 2011, approximately 80% of the employers posting vacancies reported having received enough applications to hire. This result is consistent with the results in surveys conducted by the Confederation of Swedish Enterprise since the late 1990s pointing at approximately 20% of firms’ recruitment efforts failing. Edin and Holmlund (Reference Edin, Holmlund and Schioppa1991) referred to evidence indicating that the major part of the outflow of vacancies was associated with hiring; Farm (1989), for instance, found that only 10% of the posted vacancies were withdrawn because of failure to find a suitable worker.
Nonlinearity in the Matching Function
Explaining the vacancy filling rate, including quadratic terms

Notes: 2SLS. Robust standard errors are in parentheses, clustered at the local labor markets. ***, **, and * denote significance at the 1%, 5%, and 10% levels, respectively. Monthly data from AF (PES) for all local labor markets in Sweden in 1992–2011. All variables are in logs. Fixed effects for local labor markets are included in all regressions. The local time trends are both linear and quadratic. IV-estimations where the mean log stocks of vacancies and unemployment are instrumented with the initial stocks, and the quadratic terms are instrumented with their first lags. There seems to be some evidence of quadratic relations. The vacancy filling rate seems to be a bit more affected by the number of unemployed when this stock is at a lower level.
Appendix E: Comparing Measures from PES and Statistics Sweden
Different measures of vacancies and unemployed for Sweden.
Notes: Quarterly data in 2001–2014. AF is the Swedish Public Employment Service (the data used in this study). SCB is Statistics Sweden. The main series for vacancies from SCB is defined as the number of recruiting processes underway according to respondents in a survey. The alternative series is the share of these vacant jobs that are currently unmanned according to the same survey (this is the variable called vacancies by SCB). The main series for unemployment from SCB is from the AKU survey and includes, for example, students saying they are applying for a job for the summer vacation. The alternative measure of unemployed from SCB is the old definition used in the same survey (not including these students, etc.), which is not available after 2005. All series are seasonally adjusted.

Appendix F: Product Demand and the Market Price Variable
Product demand variable:
 \begin{align*}{\rm ln}{{\rm D}}_{{\rm i,t}}& = \left({\rm 1-}{\delta }_{{\rm i}}\right){{\rm lnD}}^D_{{\rm j,t}} + {\delta }_{{\rm i}}{{\rm lnD}}^I_{{\rm j,t}}\\{\rm ln}{{\rm D}}_{{\rm i,t}} & = \left({\rm 1-}{\delta }_{{\rm i}}\right)\!\left(\phi^{{\rm C}}_{{\rm j}}{{\rm lnC}}_{{\rm t}} {+} \phi^{{\rm G}}_{{\rm j}}{{\rm lnG}}_{{\rm t}} + \phi^{{\rm I}}_{{\rm j}}{{\rm lnI}}_{{\rm t}} + \left({\rm 1-}\phi^{{\rm C}}_{{\rm j}}{\rm -}\phi^{{\rm G}}_{{\rm j}}{\rm -}\phi^{{\rm I}}_{{\rm j}}\right){{\rm lnEX}}_{{\rm t}}\right) + {\delta }_{{\rm i}}\!\left(\sum_{{\rm m}}{{\omega }_{{\rm j,m}}{\rm ln}{{\rm Y}}^{{\rm F}}_{{\rm j,m,t}}}\!\right)\end{align*}
Competitors’ price variable:
 \begin{align*}{\rm ln}{{\rm P}}^{{\rm C}}_{{\rm i,t}} & = \left({\rm 1-}{\delta }_{{\rm i}}\right){\rm ln}{{\rm P}}^D_{{\rm j,t}} + {\delta }_{{\rm i}}{{\rm lnP}}^I_{{\rm j,t}}\\{\rm ln}{{\rm P}}^{{\rm C}}_{{\rm i,t}} & = \left({\rm 1-}{\delta }_{{\rm i}}\right){\rm ln}{{\rm P}}^D_{{\rm j,t}} + {\delta }_{{\rm i}}\left(\sum_{{\rm m}}{{\omega }_{{\rm j,m}}\left({{\rm lnE}}_{{\rm m,t}}{\rm +ln}{{\rm P}}^{{\rm F}}_{{\rm j,m,t}}\right)}\right)\end{align*}
The subscript i denotes firm, j denotes industry, t denotes year, and m denotes country.
Domestic and international product demand for the industry of the firm are weighted together using the firm’s mean export share. To avoid simultaneity due to unobserved industry specific shocks, industry production is not used to construct the measure of industry-specific domestic demand (
 ${{\rm lnD}}^D_{{\rm j,t}}$
). Fixed components of aggregate demand can be used instead.
 ${\delta }_{{\rm i}}$
is the fixed firm-specific (direct) export share, measured as the mean export share for each firm in the register data from Statistics Sweden.
 $\phi^{{\rm C}}_{{\rm j}}$
is the industry-specific share of output going to final private consumption in total domestic use.
 $\phi^{{\rm G}}_{{\rm j}}$
is the industry-specific share of output going to final public consumption in total domestic use.
 $\phi^{{\rm I}}_{{\rm j}}$
is the industry-specific share of output going to final investment in total domestic use.
 ${\rm 1-}\phi^{{\rm C}}_{{\rm j}}{\rm -}\phi^{{\rm G}}_{{\rm j}}{\rm -}\phi^{{\rm I}}_{{\rm j}}$
is the industry-specific share of output going to indirect export, that is, the share of output used as intermediate input to domestic products that are eventually exported. These shares are based on data from input-output tables from Statistics Sweden for 2005. I also have input-output tables for 1995 and 2000, but these tables do not include information on where products that are used as intermediates eventually end up. However, the shares for direct use are very similar in all the three tables and thus the shares including indirect use are probably also similar during the time period studied (1996–2008). The weights are kept fixed over time to make the variable as exogenous as possible.
 ${{\rm C}}_{{\rm t}}$
is real private consumption.
 ${{\rm G}}_{{\rm t}}$
is real public consumption.
 ${{\rm I}}_{{\rm t}}$
is real gross fixed investment.
 ${{\rm EX}}_{{\rm t}}$
is real exports. These four variables are all volume indexes from Statistics Sweden’s table for the gross national product from the user side.
 ${\omega }_{{\rm j,m}}$
is the share of industry j’s direct exports that goes to country m. Data are from Statistics Sweden for 2005. Some missing values are replaced with zero for completeness. For some industries, mainly in the public sector and private service sector, there are no data; for those, the export share
 ${\delta }_{{\rm i}}$
is set to 0. Included export countries are Germany, Norway, the United Kingdom, Denmark, Finland, the USA, France, the Netherlands, Belgium, Italy, and Spain.
 ${{\rm Y}}^{{\rm F}}_{{\rm j,m,t}}$
is an industry-specific production index for each export country. The variable used is value-added volumes from the OECD STAN database.
 ${{\rm P}}^{\rm D}_{{\rm{j,t}}}$
is an industry-specific domestic price index for Sweden.
 ${{\rm P}}^{{\rm F}}_{{\rm j,m,t}}$
is an industry-specific price index for each export country. The variable used is the value-added deflator for each industry from the OECD STAN database.
 ${{\rm E}}_{{\rm m,t}}$
is the exchange rate, SEK/foreign currency, using data from the OECD.
Similar definitions have been used and discussed in Eriksson and Stadin (Reference Eriksson and Stadin2017) and Carlsson et al. (Reference Carlsson, Eriksson and Gottfries2013). The OECD STAN database has not been updated for years after 2008, which is why the studied period ends in 2008.
Appendix G: Industries and Local Labor Markets
Local labor markets (2000 definition; Statistics Sweden)

Industries (SNI92; Statistics Sweden)

Note: At this two-digit level, SNI92 and SNI2002 are almost identical.