CRYPTOSPORIDIUM AND CRYPTOSPORIDIOSIS
Cryptosporidium spp. causing cryptosporidiosis are of medical and veterinary significance because the parasite leads to diarrhoeal disease for which no treatments or vaccines exist (Fayer, Reference Fayer, Fayer and Xiao2008; Checkley et al. Reference Checkley, White, Jaganath, Arrowood, Chalmers, Chen, Fayer, Griffiths, Guerrant, Hedstrom, Huston, Kotloff, Kang, Mead, Miller, Petri, Priest, Roos, Striepen, Thompson, Ward, Van Voorhis, Xiao, Zhu and Houpt2015). A study involving 22 500 children from Africa and Asia revealed that the protozoan parasite Cryptosporidium is one of four major pathogens causing diarrhoea in infants and toddlers (Kotloff et al. Reference Kotloff, Nataro, Blackwelder, Nasrin, Farag, Panchalingam, Wu, Sow, Sur, Breiman, Faruque, Zaidi, Saha, Alonso, Tamboura, Sanogo, Onwuchekwa, Manna, Ramamurthy, Kanungo, Ochieng, Omore, Oundo, Hossain, Das, Ahmed, Qureshi, Quadri, Adegbola, Antonio, Hossain, Akinsola, Mandomando, Nhampossa, Acacio, Biswas, O'Reilly, Mintz, Berkeley, Muhsen, Sommerfelt, Robins-Browne and Levine2013). Of the four, rotavirus, Cryptosporidium, Shigella bacteria and enterotoxigenic Escherichia coli, only Cryptosporidium has no effective drug or vaccine (Checkley et al. Reference Checkley, White, Jaganath, Arrowood, Chalmers, Chen, Fayer, Griffiths, Guerrant, Hedstrom, Huston, Kotloff, Kang, Mead, Miller, Petri, Priest, Roos, Striepen, Thompson, Ward, Van Voorhis, Xiao, Zhu and Houpt2015). In animals, Cryptosporidium spp. are highly prevalent, with close to 100% in young calves, for example (Santín et al. Reference Santín, Trout and Fayer2008; Santín, Reference Santín2013).
Cryptosporidium species infect almost all vertebrate species (Santín, Reference Santín2013). The genus has over 30 species formally described, with many potentially awaiting formal descriptions (Šlapeta, Reference Šlapeta2013). The majority of cases of human cryptosporidiosis are caused either by Cryptosporidium hominis or Cryptosporidium parvum ‘bovine genotype’ [=C. pestis]. Identification can be difficult because (i) species of Cryptosporidium vary in their host specificity and (ii) the morphological characteristics of the excreted oocysts are insufficient for species identification. Historically, two morphologically distinct parasites of the gastrointestinal tract were originally described by Ernest E. Tyzzer from mice (Cryptosporidium muris and C. parvum) (Tyzzer, Reference Tyzzer1910; Tyzzer, Reference Tyzzer1912; Šlapeta, Reference Šlapeta, Ortega-Pierres, Cacciò, Fayer, Mank, Smith and Thompson2009). Later, these two parasites were assumed to infect all mammals, including cattle (O'Donoghue, Reference O'Donoghue1985; Upton and Current, Reference Upton and Current1985). The default species affecting the mammalian intestine became C. parvum and for the mammalian stomach, C. muris (Upton and Current, Reference Upton and Current1985). However, such a scheme became untenable and it was suggested that each of the intestinal and gastric groups are assemblages of many different species that are virtually indistinguishable using oocyst characteristics (Morgan et al. Reference Morgan, Constantine, Forbes and Thompson1997; Peng et al. Reference Peng, Xiao, Freeman, Arrowood, Escalante, Weltman, Ong, Mac Kenzie, Lal and Beard1997; Xiao et al. Reference Xiao, Morgan, Limor, Escalante, Arrowood, Shulaw, Thompson, Fayer and Lal1999b).
In this review, I aim to show that the advances in species identification for the genus Cryptosporidium have benefited from the application of what is considered a DNA-barcoding approach, even before the term ‘DNA barcoding’ was formally coined. I will outline how both DNA barcoding and DNA taxonomy for Cryptosporidum are currently applied and demonstrate the limitations of using such an approach by concentrating on recent examples from the literature. I will conclude with the prospects of using DNA approaches in species identification for Cryptosporidium in formal taxonomical works. I argue that the objective to define the DNA barcode diversity of Cryptosporidium has been accomplished.
DNA-BARCODING WORKFLOW FOR CRYPTOSPORIDIUM
DNA barcoding is an approach to species identification that uses the statistical probability of nucleotide sequence homology, enabled by the relative ease of DNA isolation, PCR amplification and DNA sequencing. The approach starts with the selection of voucher specimens of formal taxa within a particular studied group of organisms, such as the genus Cryptosporidium, followed by DNA sequencing of a selected marker gene(s). DNA barcoding is viewed as a supporting tool of formal taxonomy, not a replacement (Hebert et al. Reference Hebert, Cywinska, Ball and deWaard2003; Hajibabaei et al. Reference Hajibabaei, Singer, Hebert and Hickey2007; Hansen et al. Reference Hansen, Bakke and Bachmann2007; Ondrejicka et al. Reference Ondrejicka, Locke, Morey, Borisenko and Hanner2014). The final phase of the approach for established taxa is an evaluation of the ‘genetic distance’ of the selected marker sequence for the given species and the genetic distance that separates species from each other. These criteria are termed, respectively, the ‘within’- and ‘between’-species distance(s). Once formal taxa are characterized by DNA sequences or DNA barcode(s) and the within- and between-species distance parameters are known, can a set of unknown specimens be DNA barcoded and identified, if they match the existing DNA barcode criteria associated with these formal species. If their DNA barcode(s) do not match any of the DNA barcodes, but are positioned within the range expected for within-species DNA distance, they can be considered a new genotype or a variant of that existing species. If the DNA barcode does not match the sequences of formal taxa, and falls outside the expected within-species DNA distance of any known species, this may suggest the existence of a novel species (Besansky et al. Reference Besansky, Severson and Ferdig2003; Siddall et al. Reference Siddall, Kvist, Phillips and Oceguera-Figuero2012).
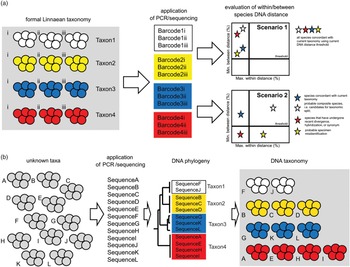
DNA-barcoding projects are built around formally identified specimens, hence Linnaean taxonomy (Fig. 1) (Hebert et al. Reference Hebert, Cywinska, Ball and deWaard2003; Hajibabaei et al. Reference Hajibabaei, Singer, Hebert and Hickey2007; Hansen et al. Reference Hansen, Bakke and Bachmann2007; Ondrejicka et al. Reference Ondrejicka, Locke, Morey, Borisenko and Hanner2014). DNA barcodes or DNA sequences are generated and evaluated on whether they are within and between the congeneric Linnaean species, which fall into a quadrant that delineates well-defined species (Fig. 1, inset). Such an approach tests whether the DNA locus chosen for the barcoding successfully resolves the formal Linnaean taxa. Assuming the marker is suitable, Scenario 1 (Fig. 1) depicts a situation that all formal Linnaean taxa represent well-defined species using the DNA barcode marker. On the other hand, Scenario 2 (Fig. 1) shows a situation where only one taxon is well defined (top left quadrant; Fig. 1, inset); while the other taxa within the remaining three quadrants are considered not well defined. It has been argued that plotting the minimum between congeneric taxon DNA marker distances against maximum within taxon DNA marker distances enables observers to identify composite or cryptic species (top right quadrant) (Hebert et al. Reference Hebert, Cywinska, Ball and deWaard2003). In addition, low minimum between taxa distance suggests either recently emerging species (bottom left quadrant) or probable specimen misidentification, particularly if the maximum within taxon distance is exceeded (bottom right quadrant). The fundamental question is: where to draw these thresholds in order to split the graph into the four quadrants? Ultimately, the threshold lies where the expert consensus opinion of those studying the group will consider biologically appropriate. For many parasites, such threshold is highly subjective and is epitomized in the discussion of ‘lumpers and splitters’ within the formal Linnaean taxonomy.
Differences between the DNA barcoding and DNA taxonomy workflows for Cryptosporidium. (a) DNA barcoding starts with taxonomically well-defined specimens/vouchers for which DNA barcodes are generated and within and between distances are evaluated for congruence with formal Linnaean taxonomy. For isolates assigned to a known species/taxon (groups of coloured oocysts), DNA barcodes are generated (i.e. for Taxon 1 there are Barcode1i-iii) followed by plotting maximum within Taxon1 genetic distance against minimum distance from all the other DNA barcodes from either Taxon2 or Taxon3 (between taxa distance). See the text for explanation of Scenario 1 and Scenario 2. Ideally the DNA barcodes are concordant with the existing taxonomy (Scenario 1). DNA barcoding, however, enables discovery of cryptic or misdiagnosed species (Scenario 2). (b) DNA taxonomy starts with unknown Cryptosporidium samples of which we generate DNA sequences that are then processed via phylogenetic workflow and Cryptosporidium species retrospectively assigned. On the left, groups of oocysts (grey circles) represent individual isolates. These isolates are of unknown taxonomical identity (grey). For an unknown species (taxa), DNA sequences are generated and phylogeny inferred and only then species (taxon) assigned.

SUPERIORITY OF USING THE DNA APPROACH IN IDENTIFICATION OF CRYPTOSPORIDIUM
For the entire Cryptosporidium genus, neither formal Linnaean taxonomy nor expected within- and between-species distances were agreed upon or known. In fact, those studying Cryptosporidium have looked to DNA sequencing to resolve suspected controversies (Carraway et al. Reference Carraway, Tzipori and Widmer1996; Peng et al. Reference Peng, Xiao, Freeman, Arrowood, Escalante, Weltman, Ong, Mac Kenzie, Lal and Beard1997; Xiao et al. Reference Xiao, Escalante, Yang, Sulaiman, Escalante, Montali, Fayer and Lal1999a, Reference Xiao, Morgan, Limor, Escalante, Arrowood, Shulaw, Thompson, Fayer and Lalb, Reference Xiao, Alderisio, Limor, Royer and Lal2000).
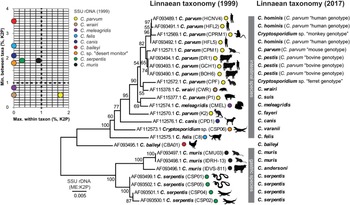
Early studies into Cryptosporidium were loosely applying a DNA-barcoding approach; the taxonomy, however, has always been in a state of flux, because of limited morphological or/and biological distinctness (Fig. 2). In the mid/late-1990s an initial consensus had been reached that C. muris and C. parvum are collective species of all specimens located in the stomach or intestine of mammals, respectively, and that C. baileyi parasitizes birds, and C. serpentis parasitizes reptiles. A study that first brought consistent DNA sequences of C. muris, C. parvum, C. baileyi and C. serpentis for SSU rDNA presented what could be considered DNA barcodes (Fig. 2) (Xiao et al. Reference Xiao, Escalante, Yang, Sulaiman, Escalante, Montali, Fayer and Lal1999a, Reference Xiao, Morgan, Limor, Escalante, Arrowood, Shulaw, Thompson, Fayer and Lalb). Generation of DNA sequences for some Cryptosporidium isolates and strains was welcomed, because it provided presumably unambiguous and easy to interpret patterns previously suggested by those that were detecting the parasites in animal feces and for medical or veterinary professionals dealing with the clinical condition (Carraway et al. Reference Carraway, Tzipori and Widmer1996; Peng et al. Reference Peng, Xiao, Freeman, Arrowood, Escalante, Weltman, Ong, Mac Kenzie, Lal and Beard1997). Once the SSU rDNA barcodes were available, it enabled confirmation of two suspected distinct transmission routes for what was then thought to be a single species called C. parvum (Fig. 2).
Cryptosporidium DNA barcoding in practice. The first consistent DNA sequences of C. muris, C. parvum, C. baileyi and C. serpentis for SSU rDNA presented what could be considered DNA barcodes (Xiao et al. Reference Xiao, Escalante, Yang, Sulaiman, Escalante, Montali, Fayer and Lal1999a, Reference Xiao, Morgan, Limor, Escalante, Arrowood, Shulaw, Thompson, Fayer and Lalb). DNA sequences for some Cryptosporidium provided presumably unambiguous detection of the parasites in animal and human feces. Between and within taxon (inset) DNA distance demonstrated what was considered C. parvum needed a thorough re-evaluation. The principal host is plotted next to the name and both the 1999 taxonomy as well as the current 2017 version is provided. The phylogenetic tree is based on Clustal aligned SSU rDNA sequences. The tree was inferred using the Minimum Evolution method. The percentage of replicate trees in which the associated taxa clustered together in the bootstrap test (1000 replicates) are shown next to the branches. The tree is drawn to scale, with branch lengths in the same units as those of the evolutionary distances used to infer the phylogenetic tree. The pairwise genetic distances were computed using the Kimura 2-parameter method and are in the units of the number of base substitutions per site.

The early data immediately called into question the formal Linnaean taxonomy (specifically C. parvum, see Fig. 2) and within- and between-species DNA distances. Leaving aside the taxonomy, the within- and between-species distances for Cryptosporidum presented a challenge, because the two distinct transmission cycles for human cryptosporidiosis were caused by what appeared to be two distinct Cryptosporidium DNA barcodes. The presence of two distinct DNA barcodes, for what was then called C. parvum, established what could be an acceptable within-species distance. Later, they were re-considered to be sufficient to establish a new formal taxon C. hominis (Morgan-Ryan et al. Reference Morgan-Ryan, Fall, Ward, Hijjawi, Sulaiman, Fayer, Thompson, Olson, Lal and Xiao2002).
The most studied host for Cryptosporidium species is human and the human Cryptosporidium spp. isolates were to define the taxonomy of the genus. The SSU rDNA of C. parvum ‘bovine’ genotype is 99·49% identical with C. parvum ‘human’ genotype across the alignment spanning 1753 nucleotide residues (Figs. 2 and 3) (Morgan-Ryan et al. Reference Morgan-Ryan, Fall, Ward, Hijjawi, Sulaiman, Fayer, Thompson, Olson, Lal and Xiao2002; Xiao et al. Reference Xiao, Sulaiman, Ryan, Zhou, Atwill, Tischler, Zhang, Fayer and Lal2002). Elevating C. parvum ‘human’ genotype to a species status (=C. hominis) meant that the between genotype distance, became between-species distance. Moreover, no genetic distance within what was called C. parvum ‘human’ genotype at SSU rDNA meant that the newly established C. hominis had no within-species variation at SSU rDNA.
Phylogeny of 33 named Cryptosporidium species using reference dataset of SSU rDNA sequences. The tree was inferred using the Minimum Evolution method (bootstrap test with 1000 replicates). All ambiguous positions were removed for each sequence pair. The tree is drawn to scale, with branch lengths in the same units as those of the evolutionary distances used to infer the phylogenetic tree. The evolutionary distances were computed using the Kimura 2-parameter (K2P) method and are in the units of the number of base substitutions per site. A minimum distance (%) to the closest Cryptosporidium species is indicated by a bar plot on the right (between taxa SSU rDNA genetic distance). GenBank accession number accompanies all species names, as well as public health significance. There is no SSU rDNA sequence available for C. nasoris (Species X) and C. scophthalmi (Species XXI). The alignment is publically available at http://dx.doi.org/10.6070/H43T9F9G.

The precedent with C. hominis opened a new ‘can of worms’. While epidemiology has prompted the recognition of the species, it was the DNA sequences that provided the heaviest weight in the species description. The Cryptosporidium field entered the phase of DNA taxonomy. The availability of molecular methods to sequence Cryptosporidium marker genes from animal samples, as well as environmental samples, led to hundreds of publications determining the extent of diversity (Xiao et al. Reference Xiao, Escalante, Yang, Sulaiman, Escalante, Montali, Fayer and Lal1999a; Sulaiman et al. Reference Sulaiman, Morgan, Thompson, Lal and Xiao2000); hence what could informally be called the Cryptosporidium diversity initiative. Over the past 15 years, we have seen new Cryptosporidium species molecularly characterized and formally described (Xiao et al. Reference Xiao, Fayer, Ryan and Upton2004; Šlapeta, Reference Šlapeta, Ortega-Pierres, Cacciò, Fayer, Mank, Smith and Thompson2009, Reference Šlapeta2013; Fayer, Reference Fayer2010). The issues that remain to be resolved are, ‘are there noticeable within-species distances, or do the SSU rDNA barcodes all represent un-described novel species?’
CRYPTOSPORIDIUM SPECIES IN THE AGE OF DNA TAXONOMY
The DNA taxonomy approach argues that the superior data used for taxonomic decisions is DNA sequences and proponents argue that DNA sequencing should be utilized, rather than traditional morphology or biology (Fig. 1). The approach applies a universal system based solely on reference DNA, therefore species are simply defined by sequence identity (Hajibabaei et al. Reference Hajibabaei, Singer, Hebert and Hickey2007; Ondrejicka et al. Reference Ondrejicka, Locke, Morey, Borisenko and Hanner2014).
There are 35 named species of Cryptosporidium that can be considered valid with valid names according to the International Code of Zoological Nomenclature (Table 1, Fig. 3). Only two are lacking a DNA barcode, both representing Cryptosporidium species originally described from fish (C. nasoris, C. scophthalmi). Because of the absence of comparative material, the Roman numeral system was suggested to address the potential unstable taxonomy (Šlapeta, Reference Šlapeta2013). The Roman numeral system is only introduced for the named species of Cryptosporidium and together with the accession numbers in primary DNA databases (GenBank: www.ncbi.nlm.nih.gov/genbank, EMBL: www.ebi.ac.uk/ena and DDBJ: www.ddbj.nig.ac.jp) serve as a straightforward DNA reference system, therefore a reliable barcoding platform for species identification (Table 1) (Šlapeta, Reference Šlapeta2017). The SSU rDNA reference alignment including all 33 DNA barcodes is publically available at http://dx.doi.org/10.6070/H43T9F9G.
Current taxonomic summary of Cryptosporidium species

Host range: M – mammal; B – bird; R – reptile; F– fish. n/a – no applicable, because it has not been characterised using any DNA signature. (Yes) – indicates extremely rare or experimental evidence; * accession numbers in primary DNA databases (GenBank: www.ncbi.nlm.nih.gov/genbank, EMBL: www.ebi.ac.uk/ena and DDBJ: www.ddbj.nig.ac.jp).
DNA BARCODING VS DNA TAXONOMY: EXAMPLES FROM THE LATEST ADDITIONS TO THE SPECTRUM OF CRYPTOSPORIDIUM SPECIES
Within the Cryptosporidium literature the distinction between DNA barcoding and DNA taxonomy is unclear (Fig. 1). To illustrate the mixing of DNA barcoding and DNA taxonomy concepts I will examine the latest additions to the growing spectrum of Cryptosporidium named species. I will revisit the within-species and between species-identity to reflect on the taxonomy issues using the five recently (re-)described Cryptosporidum species – C. proliferans (Species XXXIV), C. testudinis (Species XXXV), C. avium (Species XXXIII), C. rubeyi (Species XXXII) and C. huwi (=C. cichlidis Species XIII) (Table 1).
The recently described C. proliferans (Species XXXIV, Table 1) belongs to a gastric invading species (Fig. 3) (Kváč et al. Reference Kváč, Havrdová, Hlásková, Daňková, Kanděra, Ježková, Vítovec, Sak, Ortega, Xiao, Modrý, Chelladurai, Prantlová and McEvoy2016). The description is based on thorough comparative work with morphological, histopathological and experimental studies. Authors argue for morphological distinctness from its closest sister species C. muris (Species I, Table 1) (Kváč et al. Reference Kváč, Havrdová, Hlásková, Daňková, Kanděra, Ježková, Vítovec, Sak, Ortega, Xiao, Modrý, Chelladurai, Prantlová and McEvoy2016). The only meaningful comparative morphology applied in the genus Cryptosporidium are oocysts’ size and shape, therefore, authors argue for difference between C. proliferans strain TS03 oocysts (6·8–8·8 × 4·8–6·2 µm) and C. muris strain HZ206 oocysts (6·3–8·1 × 5·0–6·6 µm) (Kváč et al. Reference Kváč, Havrdová, Hlásková, Daňková, Kanděra, Ježková, Vítovec, Sak, Ortega, Xiao, Modrý, Chelladurai, Prantlová and McEvoy2016). Despite the thorough biological data delivered, authors applied the concept of DNA taxonomy stating that their, and previous, genetic work has demonstrated the presence of a new species. The DNA sequences originally obtained for C. proliferans coupled with minute 0·4% genetic distances from C. muris at SSU rDNA, initiated their thorough descriptive and taxonomical work (Kváč et al. Reference Kváč, Havrdová, Hlásková, Daňková, Kanděra, Ježková, Vítovec, Sak, Ortega, Xiao, Modrý, Chelladurai, Prantlová and McEvoy2016). The biology of C. proliferans is defined by a single laboratory maintained isolate; however, it remains to be tested if the claimed biological differences are shared by other isolates of the same species that are now defined by the DNA barcode.
The latest addition to the Cryptosporidium taxa is C. testudinis (Species XXXV, Table 1) (Ježková et al. Reference Ježková, Horčičková, Hlásková, Sak, Květoňová, Novák, Hofmannová, McEvoy and Kváč2016). Its identity was first revealed in a study from 2002 that demonstrated large numbers of undefined DNA barcodes/sequences (including SSU rDNA genotypes) (Xiao et al. Reference Xiao, Sulaiman, Ryan, Zhou, Atwill, Tischler, Zhang, Fayer and Lal2002). The 2002 study could be considered a DNA-barcoding study, because the authors aimed to match generated DNA barcodes with those of known taxa (Xiao et al. Reference Xiao, Escalante, Yang, Sulaiman, Escalante, Montali, Fayer and Lal1999a; Reference Xiao, Morgan, Limor, Escalante, Arrowood, Shulaw, Thompson, Fayer and Lalb). Unlike the above C. proliferans, C. testudinis is clearly delineated by 3·3% DNA distance at SSU rDNA from its closest Cryptosporidium species (Fig. 3). In the description, the valuable DNA-barcoding information is that C. testudinis from eight different species of tortoises was essentially identical at SSU rDNA (99·8% identity; 0·2% within-species identity) (Ježková et al. Reference Ježková, Horčičková, Hlásková, Sak, Květoňová, Novák, Hofmannová, McEvoy and Kváč2016). As described above for C. proliferans, authors reported that oocysts are larger compared to the only other tortoise Cryptosporidium species, but ultimately, DNA sequencing must be used to differentiate the taxa, thereby arguing in favour of DNA taxonomy.
The description and naming of C. avium (Species XXXIII, Table 1) is the latest case in support of the direct use of DNA taxonomy (Holubová et al. Reference Holubová, Sak, Horčičková, Hlásková, Květoňová, Menchaca, McEvoy and Kváč2016). While the experimental and morphological work is valuable, it did not elucidate the problem of cryptosporidiosis and diversity of Cryptosporidium species in birds. The study elevated a previously known genotype to a species level from a single host species and locality (Holubová et al. Reference Holubová, Sak, Horčičková, Hlásková, Květoňová, Menchaca, McEvoy and Kváč2016). Therefore, the within-species DNA distance remains ambiguous, especially, because a known avian genotype, genotype II, is closely related to both C. avium and C. baileyi (Species XI, Table 1). Similar to C. avium, the newly introduced species C. rubeyi (Species XXXII, Table 1) that was described and named from ground squirrels is another case where its distance of 2·5% from the closest species is deceivingly strong (Fig. 3) (Li et al. Reference Li, Pereira, Larsen, Xiao, Phillips, Striby, McCowan and Atwill2015). On the other hand, there are several closely related DNA barcodes or genotypes obtained from closely related squirrels (Pereira et al. Reference Pereira, Li, McCowan, Phillips and Atwill2010). Therefore, the within-species C. rubeyi DNA distance is ambiguous. The DNA taxonomy approach is even more obvious in the description and naming of Cryptosporidium species in fish, C. huwi (Species XIII, Table 1; the name is considered to be synonymous with C. cichlidis) (Šlapeta, Reference Šlapeta2013; Ryan et al. Reference Ryan, Paparini, Tong, Yang, Gibson-Kueh, O'Hara, Lymbery and Xiao2015). The genotype (DNA barcode, known as piscine genotype I) was simply elevated to the species status, using a demonstration of Cryptosporidium developmental stages in a histological section from an affected fish (Ryan et al. Reference Ryan, Paparini, Tong, Yang, Gibson-Kueh, O'Hara, Lymbery and Xiao2015). Similar to bird Cryptosporidium species, the Cryptosporidium fish species diversity is largely unknown (Yang et al. Reference Yang, Palermo, Chen, Edwards, Paparini, Tong, Gibson-Kueh, Lymbery and Ryan2015).
Together these five descriptions demonstrate issues surrounding the taxonomy and DNA barcoding of Cryptosporidium spp. in animals, and in particular the neglect towards understanding the within-species distance for a defined Cryptosporidium species. Currently, there are 35 named species considered valid (Table 1) (Šlapeta, Reference Šlapeta, Ortega-Pierres, Cacciò, Fayer, Mank, Smith and Thompson2009, Reference Šlapeta2011, Reference Šlapeta2012, Reference Šlapeta2013). If we accept that within- and between-species genetic distances are as low as 0·3%, as demonstrated for some of the zoonotic and human-infecting species, all the unique genotypes/DNA barcodes can be considered new candidate species. It appears that the intentions are there to name more species based on DNA sequences, with the only obstacle being a demonstration of oocysts/or tissue development. If such DNA taxonomy is the way forward for Cryptosporidium, the focus should be to aim at detecting the parasite in as the large proportion of potential susceptible hosts as has been done for C. testudinis (Ježková et al. Reference Ježková, Horčičková, Hlásková, Sak, Květoňová, Novák, Hofmannová, McEvoy and Kváč2016). Using a single strain to justify new description should not be adequate as it does not allow evaluation of the within-species DNA diversity. The within-species DNA diversity is especially valuable for hosts, such as birds and fish, where the diversity is less well known. The past 20–30 years have primarily focused on domestic animals and humans and their Cryptosporidium species, and the assessment of diversity preceded the taxonomical work. The DNA-barcoding approach is a favourable approach for non-farm or pet animals as well. The outstanding question is the absence of a universal catalogue that would be a proxy to the detected barcodes, enabling synthesis of past and current efforts to understand the species diversity of the genus Cryptosporidium.
All latest additions to the Cryptosporidium species list come from non-farm animals, implying that we have largely defined the diversity in human and farm animal cryptosporidia at species level (Li et al. Reference Li, Pereira, Larsen, Xiao, Phillips, Striby, McCowan and Atwill2015; Ryan et al. Reference Ryan, Paparini, Tong, Yang, Gibson-Kueh, O'Hara, Lymbery and Xiao2015; Holubová et al. Reference Holubová, Sak, Horčičková, Hlásková, Květoňová, Menchaca, McEvoy and Kváč2016; Ježková et al. Reference Ježková, Horčičková, Hlásková, Sak, Květoňová, Novák, Hofmannová, McEvoy and Kváč2016; Kváč et al. Reference Kváč, Havrdová, Hlásková, Daňková, Kanděra, Ježková, Vítovec, Sak, Ortega, Xiao, Modrý, Chelladurai, Prantlová and McEvoy2016). In human and farm animals, the attention now focuses on the within-host subspecies diversity of Cryptosporidium species and their possibility to exchange genetic material.
CRYPTOSPORIDIUM SPP. INFECTING MAMMALS: OBJECTIVE ACCOMPLISHED
Has the Cryptosporidium species diversity initiative met its milestone to define such diversity? It can be concluded that, as far as mammalian species, efforts have been exhaustive and the majority of dominant, if not all, Cryptosporidium species and genotypes are defined and their DNA sequence (i.e. SSU rDNA) is already in the public domain. The objective has been enabled by the ease of DNA isolation, PCR amplification and DNA sequencing. In fact, for humans as the host, the efforts have been exhaustive and apart from identification of C. viatorum in recent years, there has been no major revelation or change in Cryptosporidium species involved (Elwin et al. Reference Elwin, Hadfield, Robinson, Crouch and Chalmers2012; Bouzid et al. Reference Bouzid, Hunter, Chalmers and Tyler2013). DNA barcoding, and to some extent DNA taxonomy, has provided the needed framework to address questions revolving around the host susceptibility to infection as well as retrospectively zoonotic potential of individual Cryptosporidium species. Similarly, it can be concluded for major production animals such as cattle and swine (Kváč et al. Reference Kváč, Kestřánová, Pinková, Květoňová, Kalinová, Wagnerová, Kotková, Vítovec, Ditrich, McEvoy, Stenger and Sak2013; Santín, Reference Santín2013).
On the other side are Cryptosporidium species in birds and fish, of which there are a limited number of studies, some largely based on anecdotal evidence (Morgan et al. Reference Morgan, Monis, Xiao, Limor, Sulaiman, Raidal, O'Donoghue, Gasser, Murray, Fayer, Blagburn, Lal and Thompson2001; Alvarez-Pellitero and Sitjà-Bobadilla, Reference Alvarez-Pellitero and Sitjà-Bobadilla2002; Ng et al. Reference Ng, Pavlasek and Ryan2006; Zanguee et al. Reference Zanguee, Lymbery, Lau, Suzuki, Yang, Ng and Ryan2010; Barugahare et al. Reference Barugahare, Dennis, Becker and Šlapeta2011). In birds, C. baileyi and C. meleagridis are well characterized from chicken and turkeys (Current et al. Reference Current, Upton and Haynes1986; Akiyoshi et al. Reference Akiyoshi, Dilo, Pearson, Chapman, Tumwine and Tzipori2003), but some studies have demonstrated unprecedented diversity of avian Cryptosporidium even in single host species (Jellison et al. Reference Jellison, Distel, Hemond and Schauer2004; Zhou et al. Reference Zhou, Kassa, Tischler and Xiao2004). Fish infecting Cryptosporidium species are potential of production value in aquaculture (Sitjà-Bobadilla and Alvarez-Pellitero, Reference Sitjà-Bobadilla and Alvarez-Pellitero2003; Barugahare et al. Reference Barugahare, Dennis, Becker and Šlapeta2011). Experimental infections under controlled conditions will be relevant in establishing the relevance of cryptosporidiosis in fish, as well as resolving the complex diversity of C. molnari and related genotypes/species in fish. Laboratory models for fish species would be particularly valuable to elucidate age susceptibility and association of Cryptosporidium species involved. Utilizing economically significant farmed fish could be considered positively by the aquaculture industry.
GENOME SEQUENCE AS THE PROGRESSION FROM DNA-BARCODING OBJECTIVE
Although the objective of DNA barcodes for species identification was accomplished in human and farm animals, a new objective has emerged. It is not clear if the DNA-barcoded species/isolates remain stable as far as their genomic and phenotypic characteristics are concerned. In other words, is there the possibility to exchange genetic material between individual species or strains infecting concurrent hosts resulting in genotypic and phenotypic variants? The role of super-infection and the challenge or emergence of more virulent isolates is not understood (Grinberg and Widmer, Reference Grinberg and Widmer2016). Experimental infections are potentially achievable with recently developed gene manipulation technologies, but require biosafety controlled environments (Vinayak et al. Reference Vinayak, Pawlowic, Sateriale, Brooks, Studstill, Bar-Peled, Cipriano and Striepen2015).
Ease and availability of whole-genome DNA sequencing of the relatively small Cryptosporidium genome offers an initial perspective on the intra-host diversity (Hadfield et al. Reference Hadfield, Pachebat, Swain, Robinson, Cameron, Alexander, Hegarty, Elwin and Chalmers2015; Ifeonu et al. Reference Ifeonu, Chibucos, Orvis, Su, Elwin, Guo, Zhang, Xiao, Sun, Chalmers, Fraser, Zhu, Kissinger, Widmer and Silva2016; Troell et al. Reference Troell, Hallstrom, Divne, Alsmark, Arrighi, Huss, Beser and Bertilsson2016; Feng et al. Reference Feng, Li, Roellig, Kelley, Liu, Amer, Tang, Zhang and Xiao2017). Highly complete genomes of the principally isolated species of Cryptosporidium and their isolated variants have recently been made public, thereby enabling determination of the status quo for an assumed single strain/isolate. Single cell strains of Cryptosporidium are technically unachievable due to the absence of reliable culture techniques, thus field isolates are often assumed as strains if passed in the next host animal, or even directly assumed as strains if other evidence suggests no other strain was involved. The opportunity emerges to apply a metagenomic approach to purified field/clinical Cryptosporidum isolates and such metagenomes established to define the degree of heterogeneity or plasticity of the Cryptosporidium metagenome. The whole-genome perspective has the opportunity to move from the potentially biased single gene/locus genotyping to the discovery of regions of metagenome synteny that are particularly variable in field isolates or as the infection progresses (Oberstaller et al. Reference Oberstaller, Joseph and Kissinger2013; Andersson et al. Reference Andersson, Sikora, Karlberg, Winiecka-Krusnell, Alm, Beser and Arrighi2015; Guo et al. Reference Guo, Li, Lysen, Frace, Tang, Sammons, Roellig, Feng and Xiao2015; Hadfield et al. Reference Hadfield, Pachebat, Swain, Robinson, Cameron, Alexander, Hegarty, Elwin and Chalmers2015; Ifeonu et al. Reference Ifeonu, Chibucos, Orvis, Su, Elwin, Guo, Zhang, Xiao, Sun, Chalmers, Fraser, Zhu, Kissinger, Widmer and Silva2016; Troell et al. Reference Troell, Hallstrom, Divne, Alsmark, Arrighi, Huss, Beser and Bertilsson2016; Feng et al. Reference Feng, Li, Roellig, Kelley, Liu, Amer, Tang, Zhang and Xiao2017).
The outstanding problem remains that a reliable definition of a Cryptosporidium phenotype – a measurable outcome of the genetically identified strain of the parasite within its host (niche) – is lacking. Unlike a genotype that is defined by the nuclear DNA sequence of Cryptosporidium spp. strain, the phenotype is the combination of the genotype and the circumstances of the infection inside the host as well as the circumstances preceding the infection. The complementary experimental infections and metagenome approach will need to be applied simultaneously to address issues surrounding the definition of the Cryptosporidium phenotype. Careful attention to chosen clinical evaluations enabling evaluation of oocyst output, morbidity and identification of virulence factors or other characteristics should also be focused on in order to resolve the matter.
Cryptosporidium and cryptosporidiosis research has entered a new phase of opportunities, because of the renewed public health sector interest (Checkley et al. Reference Checkley, White, Jaganath, Arrowood, Chalmers, Chen, Fayer, Griffiths, Guerrant, Hedstrom, Huston, Kotloff, Kang, Mead, Miller, Petri, Priest, Roos, Striepen, Thompson, Ward, Van Voorhis, Xiao, Zhu and Houpt2015). The traditional parasitology experimental procedures that include parasite purification and enumeration, as well as experimental infections are highly relevant to both animal models for cryptosporidiosis as well as culture models (Vinayak et al. Reference Vinayak, Pawlowic, Sateriale, Brooks, Studstill, Bar-Peled, Cipriano and Striepen2015). The parasitology community has to offer intervention solutions for relevant species of Cryptosporidium of public health significance, similarly to the period of intense leadership in defining the routes of transmission during the 1980s and 1990s (Fayer, Reference Fayer1997). The DNA-barcoding objective for Cryptosporidium was accomplished; the success should be a motivation for the new objective of associating the phenotype with the genotype of Cryptosporidium.
FINANCIAL SUPPORT
This research received no specific grant from any funding agency, commercial or not-for-profit sectors.