INTRODUCTION
Variability in rainfall is a key climate risk for production and is the principal source of fluctuations in global food production, particularly in the semi-arid tropical countries of the developing world (Meinke et al. Reference Meinke, Nelson, Kokic, Stone, Selvaraju and Baethgen2006; Cooper et al. Reference Cooper, Dimes, Rao, Shapiro, Shiferaw and Twomlow2008; Aggarwal et al. Reference Aggarwal, Baethegan, Cooper, Gommes, Lee, Meinke, Rathore and Sivakumar2010; Balaghi et al. Reference Balaghi, Badjeck, Bakari, De Pauw, De Wit, Defourny, Donato, Gommes, Jlibene, Ravelo, Sivakumar, Telahigue and Tychon2010; Coe & Stern Reference Coe and Stern2011). In most of these regions there is limited scope to access extra land and water for agriculture. Indeed, many farmers are facing a contraction of resources due to urban expansion and resource degradation. Managing climate variability involves measuring or otherwise assessing agro-meteorological risk and uncertainties and then developing strategies to cope with these risks (Jarraud Reference Jarraud, Sivakumar and Motha2007; Aggarwal et al. Reference Aggarwal, Baethegan, Cooper, Gommes, Lee, Meinke, Rathore and Sivakumar2010). While a major source of productivity gains must come from managing the variable and changing rainfall patterns on existing land, improving the management of climate risk, particularly in the semi-arid tropics, is an ongoing challenge for the application of climate science (Sivakumar et al. Reference Sivakumar, Das and Brunini2005). Added to this challenge is analysis suggesting increasing variability in rainfall in the sub-continent with significant increases in the frequency of dry spells and intensity of wet spells (Singh et al. Reference Singh, Tsiang, Rajaratnam and Diffenbaugh2014).
The World Meteorological Organisation (WMO) has increasingly emphasized the need for end-user engagement in delivering weather and climate information (WMO 2014). Engaging stakeholders is an essential ingredient in the mobilization of any science to real world problems and the case has been strongly made for stakeholder participation in the application of climate science to agriculture (Cash et al. Reference Cash, Clark, Alcock, Dickson, Eckley, Guston, Jager and Mitchell2003; Sivakumar et al. Reference Sivakumar, Das and Brunini2005; Meinke et al. Reference Meinke, Nelson, Kokic, Stone, Selvaraju and Baethgen2006). Brown & Baroang (Reference Brown and Baroang2011) argue that the involvement of farmers is a critical aspect of risk assessment, as they are knowledgeable about the consequences and to an extent an understanding of likelihoods of historical events and their judgement is valuable in ranking risks that cannot be easily quantified.
Reed (Reference Reed2008) reviewed the history of stakeholder participation in development. This includes awareness raising and the critique of the transfer of technology paradigm in the 1960s to incorporating local perspectives in data collection in the 1970s. Chambers (Reference Chambers1983) discussed the ‘Farmer First’ notion of bringing the farmer to the forefront in participatory research, to the situation where participation is mainstreamed using methods such as participatory rural appraisal. Participation has been integrated into formal definitions of sustainable development following the Brundtland report and subsequent meetings of the United Nations conferences on Environment and Development in Rio 1992 and Johannesburg 2002 (Richards et al. Reference Richards, Blackstock and Carter2004). Nevertheless, many who have been involved in participative approaches express some caution on theoretical and practical grounds (Hickey & Mohan Reference Hickey and Mohan2001; Agrawal Reference Agrawal2002; Christens & Speer Reference Christens, Speer, Cooke and Kothari2006; Raymond et al. Reference Raymond, Fazey, Reed, Stringer, Robinson and Evely2010).
There is no doubt that meaningful stakeholder participation with applied science is more difficult to implement than first thought. A challenge that is addressed in the current paper is the significant difference between local and scientific knowledge. On the one hand local knowledge on climate risk is tacit, implicit, informal, qualitative and context-specific. Scientific knowledge on the other hand is quantitative, formalized and more easily generalized. One solution is to use local knowledge to provide a rich qualitative description of the impact of weather and climate events and leave the quantification to science. While stakeholder context is essential in understanding risk, quantification of risk is a valuable and powerful step in risk analysis (Hardaker et al. Reference Hardaker, Huirne and Anderson1997; Sivakumar et al. Reference Sivakumar, Das and Brunini2005; Cooper & Coe Reference Cooper and Coe2011). In the current paper, farmers’ ability to contribute both qualitative and quantitative information that can then be used in co-learning with science is explored. It is this philosophy of co-learning that is the key ingredient to successful stakeholder engagement (Reed Reference Reed2008). The focus of the current work, therefore, is to assess the climate risk perceptions of farmers in a bottom-up approach in so far as it impacts crop production.
Climate risk has been defined by a number of authors (Helm Reference Helm1996; Gommes Reference Gommes1998; Brooks Reference Brooks2003; Jones & Boer Reference Jones and Boer2004; Sivakumar & Motha Reference Sivakumar, Motha, Sivakumar and Motha2007) as a function of probability (chance of occurrence) of an event and its impact, in this case a negative impact on production or crop yield.
The current paper aims to integrate farmer perception of climate risks to their crops, climate data and crop calendars to provide a better understanding of climate risks. Farmers’ experience with climate risks in the period 2001–10 with long-term data as a means to understand if these risks have increased in the recent past is explored. While this comparison is not intended to provide evidence to suggest that 2001–10 was more variable or climatically risky than previous decades, it has been useful to stimulate discussion on managing increased climate variability with farmers. While the results are case-study-specific, the methodology provides useful insights for end-user engagement to better target the delivery of weather and climate information.
STUDY AREA
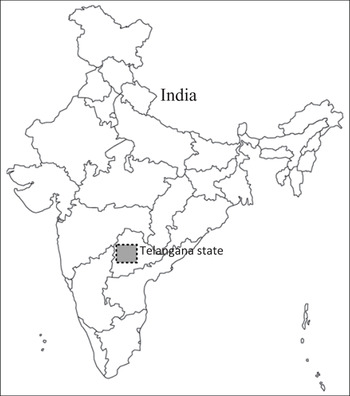
The two case study villages, Bairanpalli and Gorita, are located in the Telangana state of south India (Fig. 1). The main growing season in the region is called kharif, which is the period of the south-west monsoon during June to October. The dry season, called the rabi season, is between November and March. Crops grown in the rabi season are mostly dependent on irrigation. Bairanpalli (18°4′N, 79°36′E, altitude ~300 m asl, Warangal district) has a mean growing season rainfall of 910 mm, with better soils than Gorita. The soils are mainly vertisols, cropping includes cotton, maize, paddy rice and high-value crops (vegetables, turmeric). Famers use bore wells for paddy irrigation. Farmers are entrepreneurial, committed to agriculture and keen to adapt their farming to manage climate risks of increased dry and wet spells via crop and varietal choices, investing in irrigation sources, alternative crops, shifts in cropping windows among others. Gorita (16°37′N, 78°9′E, altitude ~500 m asl, Mahboobnagar district) has a growing season rainfall of 615 mm and groundwater-based irrigation resources are confined to vertisols in drainage depressions. Upland soils are mainly poorer red granitic Alfisols and Ultisols. Farmers in both regions are generally risk-averse, given the low rainfall and erratic monsoon conditions. Cotton and paddy rice are some of the key kharif (June–October) crops in the region. Paddy rice is grown under irrigated conditions, mostly using groundwater pumped from bore wells. Cotton is predominantly rainfed. The average holding size in the area is ~2 ha with predominantly smallholder farmers.
Study region

MATERIALS AND METHODS
A triangulation approach was used to validate farmers’ perceptions with rainfall analysis and crop modelling using crop calendars. The idea of using the crop calendar as a means of bridging the gap between farmers and researchers is broadly consistent with the ‘boundary object’ concept enunciated by Star & Griesemer (Reference Star and Griesemer1989) and Star (Reference Star2010). The risk-based approach was then applied to quantify climate-influenced production risks for two major crops, paddy rice and cotton, for the monsoon season (June to October) in two case study locations in south India. The risk-based approach provides a direct functional link between assessing exposure to adverse climatic events and identification, prioritization and retrospective evaluation of management intervention designed to reduce anticipated consequences to tolerable levels (Hay Reference Hay, Sivakumar and Motha2007).
Daily rainfall data for the period 1978–2010 were sourced via the local Agricultural University (ANGRAU, now PSTSAU) from the India Meteorological Department (IMD) station closest to the study locations. Farmers’ experience on climate risk and the rules they used for sowing were derived from a semi-structured questionnaire which was administered during December 2010 and subsequent interactions with participating farmers during September 2011 and December 2011 and November 2013 in the study villages. Crop calendar data were provided by PSTSAU based on their studies in the region and from farmer inputs.
Characterizing rainfall variability
Growing season rainfall variability with respect to mean
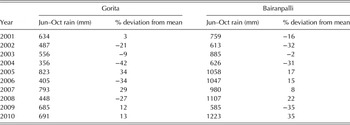
Growing season rainfall variation with respect to the long-term mean was calculated and presented as a percentage change from the mean (Table 1). The IMD use the per cent of normal rainfall during the south-west monsoon season (June to October) to describe rainfall conditions (Murty & Takeuchi Reference Murty, Takeuchi, Murty and Takeuchi1996, quoted in Mavi & Tupper Reference Mavi and Tupper2004). While seasonal rainfall totals and their season-to-season variability are in themselves important, the nature of ‘within season’ (monthly) variability can also have a major impact on crop productivity (Cooper et al. Reference Cooper, Dimes, Rao, Shapiro, Shiferaw and Twomlow2008). The within-season data on mean and s.d. of kharif rainfall provide a summary of the rainfall characteristics of the study locations (Table 2).
Growing season rainfall and % deviation from mean

Gorita and Bairanpalli mean monthly rainfall and s.d. for the 5 months of the growing season (mm)

To confirm if rainfall variability was the key determinant to the water-limited yield potential of rainfed cotton, a correlation between yields and growing season rainfall was analysed.
The cropping model APSIM (Keating et al. Reference Keating, Carberry, Hammer, Probert, Robertson, Holzworth, Huth, Hargreaves, Meinke, Hochman, McLean, Verburg, Snow, Dimes, Silburn, Wang, Brown, Bristow, Asseng, Chapman, McCown, Freebairn and Smith2003; Holzworth et al. Reference Holzworth, Huth, deVoil, Zurcher, Herrmann, McLean, Chenu, van Oosterom, Snow, Murphy, Moore, Brown, Whish, Verral, Fainges, Bell, Peake, Poulton, Hochman, Thorburn, Gaydon, Dalgliesh, Rodriguez, Cox, Chapman, Doherty, Teixeira, Sharp, Cichota and Vogeler2014) with APSIM-Ozcot (Hearn Reference Hearn1994) was used to simulate cotton in the present study. The APSIM model was chosen primarily for its ability to mimic farmer management actions closely through its flexible Manager module. Climate data, including daily minimum and maximum temperatures and rainfall were available from the IMD's long-term records at Warangal, which is the long-term weather station closest to Bairanpalli and included the years 1978–2010. The APSIM climate files also require solar radiation, vapour pressure and evapotranspiration. These variables were predicted from rainfall and temperature using empirical relationships based on National Centers for Environmental Prediction (NCEP) reanalysis climate data for locations close to each climate station.
The simulation was set up with soil parameters determined from the characterization data of a local Vertosol and crop genetic coefficients calibrated from growth stage observations of the local cotton variety, Ankur, against weather data, where both were recorded in Bairanpalli village. A continuous cotton–fallow–cotton rotation was simulated with a dry profile at the start of the first crop. Crops were sown annually when cumulative rainfall after 1 Jun was equal to 75 mm and were deemed to be completed when 100% of the bolls had opened.
Comparing 2001–10 weekly rainfall with the previous decades (1978–2000)
Weekly rainfall distribution at different crop stages was calculated for paddy rice and cotton in both case study locations using the crop calendar as a reference. The reason for the comparison was to understand if farmers had experienced climatic variability in the 2001–10 decade that was different to previous decades. The weekly distribution over the 2001–10 period was used, starting from 3 June and continuing until the end of the growing season. These data were plotted as box plots with the box in the range 20th–80th percentile, whiskers in the non-outlier range, outliers and extremes. To compare these data with the long-term weekly data of 1978–2000 the 1978–2000 weekly data as lines (3 weekly running mean) for the median, 20th and 80th percentile were plotted. These lines were overlaid on the box plots for comparison. The crop stages considered for paddy were transplanting, flowering and harvest stages and for cotton these were sowing, blossom and harvest stages. Farmers’ reported experience from 2001 to 2010 was then compared with that of the historical climate record of 1978–2000.
Climate risk assessment approach
Climate risk assessment with farmers was carried out in the two case study locations initially during November–December 2010 and subsequently in 2012 and 2013. Ten farmers in each village were selected for the semi-structured interviews. Since farmers’ experience of climate impact on their farming for the last 10 years was required, only farmers who had been farming for 10 years or more were selected. Out of this group, farmers with 50% or more of their income derived from farming activities were selected based on the assumption that they would be more keenly aware of the climatic events impacting their livelihood than farmers who spend only a small part of their time on agriculture and may therefore be less keenly aware of the key climatic events that influenced their crops’ yields.
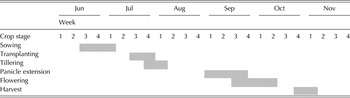
Farmers were questioned about the impact of climate on their crop production during the last 10 years. Based on discussions with participating farmers, paddy and cotton were shortlisted for analysis as key crops in the region. The discussion was based on the crop calendars (Tables 3 and 4) that were available from the local agricultural university and state extension agents. For each of the crop stages of cotton (such as sowing, square bud, blossom, boll and harvest) farmers were asked to identify climatic events (such as dry spells or excess wetness for cotton) that had an adverse impact on their crop's yields. They were then asked to estimate the number of times that such climatic events occurred in the last 10 years (chance of occurrence) and their assessment on the impact on yield (impact) of each event. For paddy, different stages of crop development such as transplanting, tillering, panicle extension, flowering and harvesting stages were discussed. Some of these farmers had kept records of farm operations for a number of years and could refer to the data from their documents. For some of the farmers, rainfall data for the past 10 years was a useful prompt to recollect the climatic events.
Crop calendar for cotton

Crop calendar for paddy

Farmers reported their local rules for sowing paddy and cotton in the two case study locations. In the higher rainfall case study village of Bairanpalli, farmers start their paddy nursery during the local season ‘Rohini’ between 1 and 20 June, using groundwater. In the low-rainfall study village of Gorita, farmers start their paddy nursery during ‘Rohini-Mrigasira’ between 8 June and 15 July. In both the case study villages, for cotton in vertisols their sowing rule is to test if the top 10–15 cm of their soil is sufficiently wet to form a soil ball. This soil-wetting rule was also expressed as a requirement for about ‘60 mm cumulative rainfall in 7–10 days and a dry spell not exceeding 15–20 days following sowing’. In the case of red soils, the local farmer soil-wetting rule of thumb is similar as for cotton and a ’dry spell not exceeding 7–15 days after sowing’.
Based on the farmer survey of climate events and their impact on crops, as well as their sowing rules, the climate records were analysed for both the case study villages. Probability of Exceedance (PoE) of a climatic event occurring (either a day of the year or rainfall amount) was used as a means of corroborating farmers’ reported experience of climate events. The crop calendar was used as a reference to relate farmers’ reporting of a climatic event affecting crops (at a particular stage of crop development). Instat software (University of Reading 2008) was used to analyse the daily climate records. Thus, when farmers reported rules describing moisture deficit at sowing for cotton, PoE graphs were generated that described PoE of the rainfall amounts specified in their rule during the specified crop calendar period. When farmers reported excess rainfall events that had impacted their crops for both cotton and paddy, the PoE of specified amounts of rainfall (over a 3-day period) were used to relate to farmers’ reporting to the climate data.
Farmers' experience of ‘poor’ and ‘good’ seasons (for kharif) from the last 10 years in relation to the growing seasonal rainfall point of view was also gathered. Farmers also provided information on yields, independently of this list of poor and good seasons. The yield data for cotton and paddy in relation to the good and poor seasons as reported by the farmers were analysed.
RESULTS
Rainfall variability
The period of interest for this study (2001–10) had high inter-annual rainfall variability (Table 1). This provided a unique opportunity to analyse and understand how farmers have coped with such variability in rainfall. Table 2 depicts the mean and s.d. of monthly rainfall for the two study villages and highlights the monthly rainfall variability with which farmers have to cope and to manage the risks associated with either deficit or excess rainfall. The IMD defines +20 and –20% difference from the mean to indicate excess and deficient rainfall, respectively. In Gorita (mean 615 mm) 4 out of 10 years were deficient and 2 out of 10 years had excess rainfall; in Bairanpalli (mean 910 mm), 3 out of 10 years were deficient and 2 out of 10 were excessive.
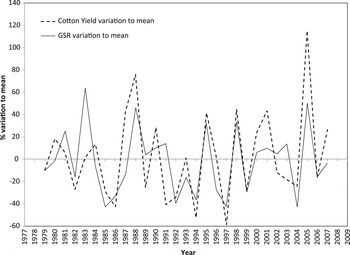
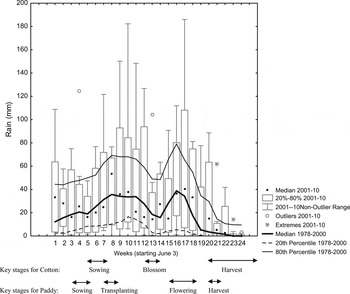
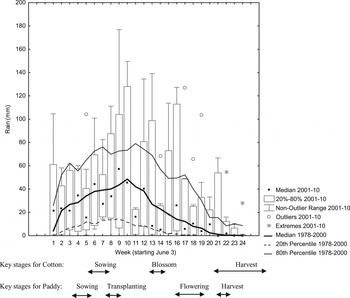
In relation to understanding the rainfall variability correlation with yield, the simulated cotton yield and growing season rainfall variation to mean for one case study village are presented in Fig. 2 as an example (coefficient of correlation between rainfall and simulated yield was 0·6). The result highlights the fact that rainfall variability is a major factor in determining the water-limited yield potential of rainfed cotton crops in the case study village. Having established that the study villages have experienced significant rainfall variability and this variability affects crop yields, the results of farmers’ experience of climatic events are reported. In order to compare farmers’ experience of climatic events during 2001–10 with the previous decades (1978–2000), weekly rainfall analysis was used. Within-season rainfall variability at different cropping stages for cotton and paddy for the two case study villages are presented in Figs 3 and 4. The box plots in these figures relate to the period in which farmers reported their experience of the seasons 2001–10, while the weekly moving average lines relate to longer-term data from 1978 to 2000. Key crop stages for cotton and paddy are included for reference. In Fig. 3, weekly rainfall data corroborate Gorita farmers’ reporting of increased rains at flowering and harvest for cotton. The 2001–10 median rainfall was above the long-term median rainfall (1978–2000) for these periods, also two extreme recordings occurred during this period. In the case of cotton sowing, the 2001–10 weekly median rainfall was below the long-term median, which broadly coincides with farmers’ reporting. In the case of paddy rice, farmers’ reporting of dry spells at transplanting does not show a significant variation with the long-term median values. However, farmers’ reporting of wet spells at flowering and harvest is clearly evident, with higher weekly median values compared with long-term weekly median values for the same period of the crop calendar. The 20th and 80th percentile lines for the 1978–2000 period are consistent with the median analysis reported above.
% variation from the mean for GSR and simulated cotton yields for Gorita.

Gorita weekly rainfall distribution, box plots depict rainfall for 2001–10, the period for which farmers reported their experience of the climatic events impacting their crops, the lines overlaid on the box plots are three weekly moving average depicting longer term data from 1978 to 2000.

Bairanpalli weekly rainfall distribution, box plots depict rainfall for 2001–10, the period for which farmers reported their experience of the climatic events impacting their crops, the lines overlaid on the box plots are three weekly moving average depicting longer term data from 1978 to 2000.

In the case of Bairanpalli paddy (see key crop stages in Fig. 4), farmers have reported dry spells at sowing for cotton and increased wet spells at blossom and harvest stages. From Fig. 4 it is evident that the median values of 2001–10 were below the long-term median weekly rain for the sowing stage. For blossom and harvest stages, the weekly median values for 2001–10 were above the long-term median weekly rainfall relating to the farmers’ reported experience for rainfall during these crop stages. In the case of paddy, farmers’ reporting of dry spells at transplanting stage during the 2001–10 period agrees with below long-term median weekly rainfall for this crop stage. The crop calendar periods for flowering and harvest for 2001–10 seem to be wetter than the long-term median, which is consistent with farmers’ reports.
Farmer perceptions of good and poor seasons
Farmers identified rainfall as a significant factor among the reasons for a year being indicated as good or poor, impacting crop yield and consequently income. Nomination of a year as good or poor varied between the two study villages and also among farmers in the same village. For example, 2004 was a poor year for farmers in both villages and climate data revealed that Bairanpalli's growing season rainfall was 31% below the long-term mean while Gorita's growing season rainfall was 42% below the long-term mean. In contrast, 2005 was also rated as poor by farmers in both study locations, due to excess rainfall which was 17 and 34% above the long-term mean for Bairanpalli and Gorita, respectively. The dry year 2009 also provides useful insights into farmer experience with seasonal rainfall, with some farmers in Bairanpalli and Gorita reporting it as a good year while for some it was a poor year. In a year such as this, farmers reported that those who had access to irrigation water via groundwater pumps were able to reduce the impact of the dry spell on production, with some farmers shifting to growing vegetables. The market price of crops was also reported to have been higher, due to low levels of production.
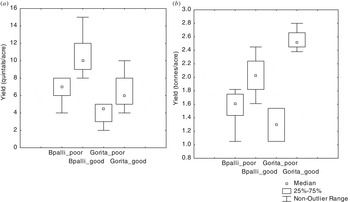
Yields reported by farmers for the 2001–10 period were plotted against these perceived poor and good years (Figs 5(a) and (b)). For both cotton and paddy, the box plots clearly demonstrate a positive relationship between yields and the corresponding poor or good years as identified by the farmers. In Bairanpalli and Gorita, the yield difference for cotton in poor and good years is clearly differentiated. For cotton, a good season yield was 1·5–1·65 times higher than a poor season average, while for paddy a good season was 1·3–1·9 times higher than a poor season.
(a) Cotton yields in ‘poor’ and ‘good’ years as reported by farmers in Bairanpalli and Gorita. (b) Paddy yields in ‘poor’ and ‘good’ years as reported by farmers in Bairanpalli and Gorita.

Farmer experience of climate risk
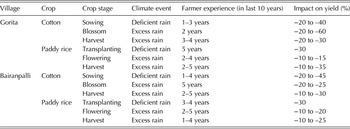
For each of the crop stages in cotton and paddy, farmers identified climatic events that had an adverse impact on their crop yield. The data are presented in Table 5. For cotton, farmers identified deficient rains at sowing and excess rains at blossom and harvest stages as climatically risky and impacting negatively on yields. For paddy, adverse climate events were identified as deficient rains at transplanting and excess rains at flowering and harvest. These data were then linked to the climate data using the crop calendars and PoE curves were developed to link farmer reports and climate data. The results are detailed below.
Climate risk assessment by farmers and link to crop calendars

Gorita cotton
Farmers identified deficit rains at sowing (1–3 years in the last 10 years) with yield losses ranging from 20 to 40% as a consequence; excess rains at blossom (2 years in the last 10 years) with yield losses ranging from 20 to 60%; and harvest (picking) 3–4 years in the last 10 years with yield losses ranging from 20 to 30%.
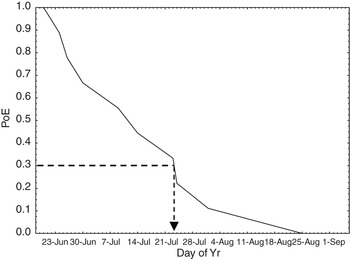
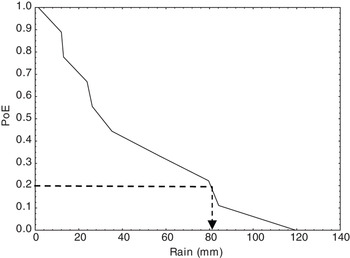
The climate record related to farmers’ reporting period was analysed (Figs 6 and 7). Figure 6 presents the PoE of the sowing rule for cotton in Gorita (60 mm over 10 days (10–15 cm wetting) with a dry spell not exceeding 15 days following sowing (for black soils) in the sowing window of the 1st to 3rd week of July). From this figure it can be deduced that there is a 30% (or 3 out 10) chance that the sowing rule is realized beyond 21 July (3rd week of July). This broadly correlates with the experience reported by farmers of 1–3 out of 10 years having insufficient rains at sowing (Table 4). Likewise for excess rains at blossom, which was a climate risk reported by farmers, climate analysis in Fig. 7 shows there was a 20% chance that a 3-day rain event in the blossom crop calendar window will exceed 80 mm cumulative rain, which can negatively impact yields and quality. In the case of excess rains at harvest that there was a 30–40% probability of exceeding 25 mm rain in a 3-day period. In the case of cotton, excess moisture at picking stage (harvest) impacts on the quality.
Gorita cotton sowing (in black soils): PoE of the sowing rule for cotton in Gorita (60 mm over 10 days (10–15 cm wetting) with a dry spell not exceeding 15 days following sowing (for black soils) in the sowing window of the 1st to 3rd week of July). From this figure we can deduce that there is a 30% (or a 3 out of 10) chance that the sowing rule is realized beyond 21 July (3rd week of July).

Gorita cotton blossom stage: PoE of rain during a 3-day period in the nominated blossom stage period.

Gorita paddy
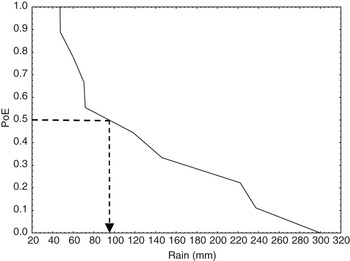
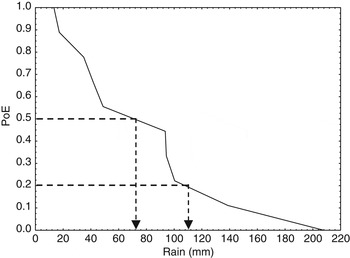
From Table 5, deficit rains at transplanting has been a significant climate risk (5 out of 10 years) expressed by farmers, with reported yields losses of up to 30%. The transplanting window as per the crop calendar is in the 3rd and 4th weeks of July. The mean rainfall for this period from the climate record is 132 mm. From Fig. 8 it can be seen that there is a 50% chance (Y-axis) that rainfall will be <98 mm (or 74% of mean, i.e., a deficit for this period). This analysis corroborates the reported frequency of deficit rains at transplanting by farmers of 5 out of 10 years (Table 5). Excess rains at the flowering stage has been reported by farmers as occurring in 2–4 years out of the last ten seasons with yield losses of c. 10–15%. The chance of a 3-day cumulative rain with 62–115 mm is between 20 and 40% (i.e., 2–4 years in a 10-year period), which farmers have experienced as damaging to the crop. Excess rains at harvest, reported by farmers in the range of 2–5 years in the last 10 years, have a negative impact on yields in the 10–35% range. Climate analysis indicates 20–35 mm 3-day cumulative rain events occurring in the 2–5 years that farmers reported.
Gorita paddy transplanting stage: PoE of certain amount of rain in the nominated transplanting stage.

Bairanpalli cotton
Farmers had identified deficit rains at sowing in 1–4 years in the last 10 years with yield losses ranging from 20 to 45% as a consequence, but excess rains at blossom in 5 of the last 10 years, with yield loss ranging from 20 to 25%, and at harvest (picking) in 2 to 5 of the last 10 years, with a yield loss ranging from 10 to 30%.
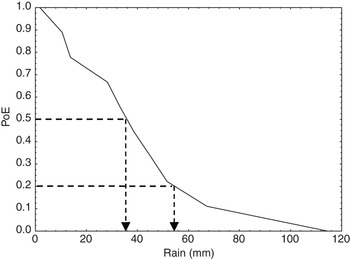
The sowing window from the crop calendar is the first 3 weeks in July. Climate analysis indicates that in 3 out of 10 years the conditions for the farmers’ sowing rule are not met before the 3rd week of July, which broadly relates to the farmer experience of 1–4 out of 10 years having deficit rains at sowing. For excess rains at blossom, as reported by farmers (5 out of 10 years), climate analysis shows there is a 50% chance that a 3-day rain event in the blossom crop calendar window will have 40 mm rain (4 out of 10 years were >65 mm rain) which can negatively impact yields and quality of cotton. At the harvest stage, Bairanpalli received about 38–58 mm rain in 2–5 out of 10 years (Fig. 9), which concurs with farmer experience of these wet spells.
Bairanpalli cotton harvest stage: PoE of rain during a 3-day period in the nominated harvest stage.

Bairanpalli paddy
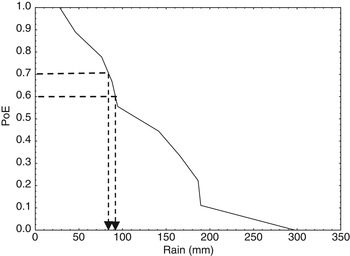
Deficit rains during transplanting was a major climate risk that farmers reported (Table 5) with 3–4 out of 10 years of deficit rain during the 3–4 week transplanting window in July. The mean rainfall for this time frame is 130 mm and as can be seen from the climate analysis in Fig. 10, there is a 30–40% chance that rainfall will be <90 mm (70% of the mean, i.e., a deficit for this period).
Bairanpalli paddy transplanting stage: PoE of certain amount of rain in the nominated transplanting stage.

Farmers indicated that the flowering stage was a climatically risky growth stage with 2–5 years out of 10 impacted with excess rain and losses in the range of 10–20%. From the climate analysis in Fig. 11, it can be seen that in 4 out of 10 years (40% chance) 3-day cumulative rain events in the 1–3 week flowering window in September was in the range of 75–115 mm, which can be damaging to the crop. This analysis is in line with farmers’ reported experience. Farmers also considered that rains at harvest damage yields, in the range of 10–25% and with a frequency of 1–4 years in the last 10 years. From the climate analysis it is seen that there is a 40% chance of 3-day cumulative rain exceeding 40 mm during this period of harvest.
Bairanpalli paddy flowering stage: PoE of rain during a 3-day period in the nominated flowering stage.

DISCUSSION
There are differences of world view between the quantitative analysis of risk from climate science and the qualitative actual experience of resource-poor farmers. If the argument that there are benefits of interaction between these two worlds is accepted, the question is raised of how this engagement can be meaningful. The present study reports an experience in engagement with low and high rainfall villages in south India. This engagement has a cost in terms of time and resources and takes both researchers and farmers out of their respective comfort zones, where farmers are asked to quantify their assessment of risk and researchers are asked to consider qualitative aspects. The methods used to find a meeting point between these two worlds were: (1) using one-on-one interviews to elicit the ranking farmers gave to rainfall and profit over the past decade, (2) the crop calendar as a boundary object to discuss climate and weather risk and (3) codifying rules of thumb used to manage risk.
Despite the general agreement between rainfall and seasons ranked as good or poor, there were differences between farmers’ reporting for some years. These exceptions to the broad relationship are interesting. A good example is the season 2009, which was a very dry year but with high prices, so those farmers who were able to access supplementary irrigation had a profitable year. Other farmers were able to switch to alternative crops or vegetables in 2009 and this also turned out to be a profitable choice. The example of 2009 highlights the heterogeneity of climatic impact on agricultural productivity and points to the complexity of what is meant by good or poor years from the perspective of different farmers. Being able to rapidly identify 2009 as an anomaly and ask farmers for the reason highlights the benefit of combining quantitative and qualitative enquiry.
Using a crop calendar as a boundary object to elicit farmers’ experience of the impacts of rainfall events on their crops at key crop phenology stages was particularly powerful. Farmers were familiar with the crop calendar through integrated pest management. The process of encouraging farmers to identify the timing of key stages of crop development placed them as the expert. Farmers were more comfortable recollecting and articulating their experiences of a range of climatic events in the recent past than was anticipated and the crop calendar served as a framework for this discussion. More importantly, the crop calendar encouraged discussion to move beyond impact assessment and lead to the management of risks. This was evident for both rice and cotton crops.
Since groundwater is used to irrigate the rice and the nursery must have access to groundwater, the key decision is the area of paddy that will be transplanted. Farmers adapt depending on how the season progresses. They would either proceed with transplanting the area planned for a good season, or would scale back the area to be transplanted if the season turns out to be unfavourable. While this risk can be managed, the damage from excess rains at flowering and harvest times is difficult to mitigate because the resources have already been allocated.
In the case of cotton, dry spells after sowing (in the first 3 weeks of July) were reported as damaging to the crop. Farmers reported experiencing this in 3 out of 10 years, which matched with the climate analysis. As an adaptation measure, farmers resorted to supplementary irrigation. However, this water for supplementary irrigation is only available to some of the farmers who face this risk. Analysing historical data for Gorita shows that in 3 out of 10 years the farmers’ rule of thumb for sowing was not met by 3rd week of July, which is their identified window. Almost 1 in 3 years is a high frequency for failure of a sowing rule to be met. In discussions with farmers, some reported that they were considering reducing paddy areas to conserve water that then may be diverted to supplement irrigation for other crops such as cotton or maize.
It was useful to compare the rainfall during key crop stages for cotton and paddy for the periods 2001–10 (farmer reporting period) and the long-term record. This comparison corroborates farmers’ experience, especially wetter conditions at flowering and harvest. It would be a mistake to suggest this difference of one decade offers any meaningful analysis of detection of climate change, much less attribution of climate change. Nevertheless this analysis stimulated discussion on managing increased climate variability with farmers. The heterogeneity of the farmer's experience of a year such as 2009 being good or poor enriches the discussion and highlights the complexity of risks and opportunities for rural livelihoods. This analysis provides useful information for targeted advice and support of extension and agro-advisory service providers. A context-sensitive quantitative approach to climate risk focuses seasonal climate forecasters on the priorities for the farming communities regarding the climate variables and timing of the forecasts that are most useful. The differences in climate risk assessment across the low and high rainfall villages provide an opportunity for agro-meteorology services to use the two ends of the spectrum (low and high rainfall locations) in their discussion for services in the region.
CONCLUSIONS
The results of the present study show the importance of integrating farmer's knowledge and experience to provide important bottom-up feedback to the agro-met advisories on climate risk assessment and management. Experienced farmers in this region were able to articulate and report climate risks with clarity and confidence and with reasonable accuracy. The close match between farmers’ reporting and analysis of historical climate data suggests that engaging farmers complements scientists’ perspectives on climate risks. This also challenges the notion that farmer knowledge is tacit. Of course farmers have a rich sense of risk and, like all of us, know more than can be easily written down or articulated. However, the approach of using crop calendars as a boundary object has facilitated farmers to express their perceptions of the impact of climatic events’ impact at various crop stages. The climate record has provided a way to codify farmer knowledge and assist with interpretation of climate records. These farmer rules can be used as a benchmark in studies of adaptation to climate variability and climate change. Without such a benchmark, adaptations are merely normative.
We thank Michael Roberston and Rick Llewellyn, CSIRO for their valuable comments. This work is part of the Australian Centre for International Agricultural Research (ACIAR) and CSIRO Climate Adaptation Flagship funded project on ‘Developing multi-scale climate change adaptation strategies for farming communities in Cambodia, Laos, Bangladesh and India’. ACIAR and CSIRO are acknowledged for their support. Climate data were accessed from ANGRAU (now PJTSAU) with permission from India Meteorological Department (IMD) which is thankfully acknowledged. Farmers in the study villages participated enthusiastically and shared their experiences with the project team for which we are very thankful. We thank the anonymous reviewers for their valuable comments and suggestions that helped to improve the manuscript.