INTRODUCTION
Certified organic agriculture is a relatively new practice in western Canada, with only 0·14 of the total cropland in Alberta, Saskatchewan and Manitoba currently registered as organic (Statistics Canada 2001; Macey Reference Macey2005). A dichotomy exists between the extensive nature of Prairie grain farming (average farm size=424 ha; Statistics Canada 2001; Macey Reference Macey2005) and the more intensive nature of organic farming (average farm size in North America=82 ha) (United States Department of Agriculture 2002; Macey Reference Macey2005). Organic grain producers on the Canadian Prairies (average farm size=132 ha; Macey Reference Macey2005) must employ many non-chemical agronomic techniques to remain viable. The potential losses due to pests (weeds, insects and diseases) in organic systems are quite large (Oerke Reference Oerke2006). Wherever possible, every operation has more than one duty. For example, spring tillage is used to loosen the soil, prepare the seedbed and kill weeds before planting (Bond & Grundy Reference Bond and Grundy2001; Rasmussen Reference Rasmussen2004). Crop species and varieties are chosen not only for yield potential, but also as part of complex crop rotations to control weeds, insects and diseases (Teasdale et al. Reference Teasdale, Mangum, Radhakrishnan and Cavigelli2004).
Avenues for producers to reduce chemical inputs include the breeding of several disease resistance genes into a single variety (Jones et al. Reference Jones, Murray and Allan1995), crop rotations and agronomic practices to diminish the prevalence of diseases and pests. The use of variety mixtures (mechanical mixtures of different varieties of the same species at seed level) may provide an additional practical alternative (Phillips & Wolfe Reference Phillips and Wolfe2005), because of their simplicity and ease of implementation (Finckh et al. Reference Finckh, Gacek, Goyeau, Lannou, Merz, Mundt, Munk, Nadziak, Newton, de Vallavieille-Pope and Wolfe2000). They have been reported to prevent disease outbreaks (Finckh et al. Reference Finckh, Gacek, Goyeau, Lannou, Merz, Mundt, Munk, Nadziak, Newton, de Vallavieille-Pope and Wolfe2000) and buffer against extreme environmental stress (Shaalan et al. Reference Shaalan, Heyne and Lofgren1966), which may occur in low-input agriculture. Wheat variety mixtures have also been reported to reduce insect and disease damage (Emmens Reference Emmens2003), minimize risk and maximize exploitation of limited resources such as moisture, nutrients or space (Smithson & Lenné Reference Smithson and Lenné1996). Additional benefits of variety mixtures may include stability of performance (Shaalan et al. Reference Shaalan, Heyne and Lofgren1966) and increased soil organic matter levels through greater above-ground biomass production (Sarandon & Sarandon Reference Sarandon and Sarandon1995). Such characteristics may render variety mixtures useful for both organic and conventional producers.
Wheat variety mixtures may involve any combination of two or more varieties, in any ratio. They have been reported to have yields equal to or more than monocultures (Manthey & Fehrmann Reference Manthey and Fehrmann1993). Some characteristics generally associated with successful wheat variety mixtures include equi-proportional mixture ratios (Manthey & Fehrmann Reference Manthey and Fehrmann1993), the use of tall or competitive varieties (Klages Reference Klages1936; Finckh & Mundt Reference Finckh and Mundt1993) with good mixing ability (Knott & Mundt Reference Knott and Mundt1990) and more, rather than fewer, components (Mundt et al. Reference Mundt, Brophy and Schmitt1995). Studies have reported many mixtures that have higher yields than their mid-component average (weighted mean of the components grown in monoculture) and, rarely, even higher than their highest-yielding component (Sage Reference Sage1971; Finckh & Mundt Reference Finckh and Mundt1992; Akanda & Mundt Reference Akanda and Mundt1997).
Wheat variety mixtures may result in yield stability over environments. For practical purposes, stability is the ability of a crop to perform well over a wide range of environmental conditions (Dubin & Wolfe Reference Dubin and Wolfe1994). Wheat variety mixtures may offer the benefits of the strengths of each component while compensating for weaknesses of each variety (Ciha Reference Ciha1984). The mixture advantage results from increased adaptability to, and buffering of, unpredictable environmental variation (Gates et al. Reference Gates, Westcott, Burdon and Alexander1986; Finckh et al. Reference Finckh, Gacek, Goyeau, Lannou, Merz, Mundt, Munk, Nadziak, Newton, de Vallavieille-Pope and Wolfe2000). Several studies have shown that variety mixtures have superior stability to pure stands (Aslam & Fischbeck Reference Aslam and Fischbeck1993; Sharma & Dubin Reference Sharma and Dubin1996). Since varieties behave differently in mixtures than in monoculture, greater gains in stability would occur from a systematic search for components that exhibit a high degree of buffering capacity when mixed, rather than composing variety mixtures based on yield capability alone (Gupta & Virk Reference Gupta and Virk1984).
The objectives of the present study were firstly to determine the performance of a chosen subsample of potential wheat variety mixtures on the northern Canadian prairies under both organic and conventional management, secondly to study the stability of performance of variety mixtures across a range of environmental conditions and thirdly to examine which agronomic traits might contribute to yield potential and weed suppression of successful wheat variety mixtures. It was hoped to identify specific wheat variety mixtures that could be implemented by producers immediately and to determine characteristics that could be used to compose effective wheat variety mixtures in the future.
MATERIALS AND METHODS
Field trials were conducted both on conventionally and organically managed fields in two locations at the University of Alberta Edmonton Research Station in Edmonton, Alberta, Canada (53°34′N, 113°31′W, 668 m asl) from 2003 to 2005 and at a certified organic farm near New Norway, Alberta, Canada (52°52′N, 112°56′W, 739 m asl) in 2004 and 2005. Thus, there were three trials on conventional land in Edmonton, three on organic land in Edmonton and two on a certified organic farm near New Norway. The soils in Edmonton were classified as Orthic Black Chernozemics, typical of central Alberta, and soils at New Norway were classified as an Eluviated Black Chernozemics (AAFRD 2005). The conventional land at the Edmonton Research Station (Edmonton Conventional) had fertilizer added as urea (46–0–0: N–P2O5–K2O) broadcast to give 67–73 kg/ha total N in 2003, at a rate of 45 kg/ha N and 20 kg/ha P, as urea and ammonium phosphate (11–52–0) in the seed row in 2004, and at 28 kg/ha as ammonium phosphate banded with the seed in 2005. The organic land at the Edmonton Research Station (Edmonton Organic) had compost (comprised of dairy manure, sawdust, wood chips and straw) added at a rate of 50–62 t/ha each year. The certified organic land in New Norway (Certified Organic) had no external inputs of fertilizer, but the fields had ploughdown crops containing legumes on them the previous year. Moisture was sufficient in Edmonton in 2004 and 2005, but there was a mild drought in 2003 in Edmonton and in 2005 in New Norway (Environment Canada 2004).
Trials were seeded into cultivated and harrowed soil that was tilled both in the autumn and in the spring prior to seeding. Organically managed land had an additional tillage operation performed to kill weeds immediately before seeding. In 2003, the plots were four rows wide (0·23 m row spacing) and 4 m long, seeded with a self-propelled, double-disc plot drill (Fabro Enterprises Ltd, Swift Current, SK, Canada), while in 2004 and 2005 plots were six rows wide (0·23 m row spacing) and 4 m long, and seeded with a self-propelled, no-till, double-disc plot seeder (Fabro Enterprises Ltd, Swift Current, SK, Canada).
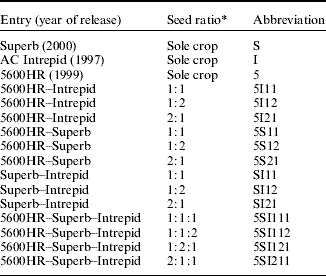
The experiment was planted as a strip-plot arrangement of a randomized complete block design, with four blocks. Horizontal and vertical factors were entries and competition treatments, respectively. Entries were 13 two- and three-way wheat variety mixtures, and the three varieties used to comprise the mixtures (Table 1) were randomized into four blocks, with each block comprising two identical tiers of the 16 entries planted to plot sizes described above. One randomly chosen tier within each block was cross-seeded with Oriental mustard (Brassica juncea L.) at a rate of 60 seeds/m2, while the other tier was not cross-seeded. Entries were composed on a kernel-number basis of pure seed to plant at a standard rate of 300 seeds/m2. The three component varieties were chosen on the basis of height, time to maturity, yield potential and tillering capacity; all were registered in Canada after 1990 (Table 1).
Wheat variety mixtures and sole-crop entries used in trials conducted in north-central Alberta from 2003 to 2005
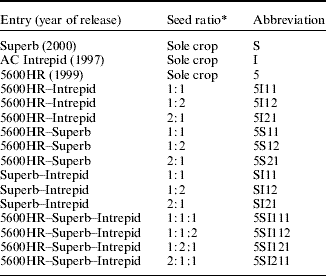
* Variety mixtures were composed on a kernel number basis to achieve a standard seeding rate of 300 seeds/m2.
Each of the eight experimental trials consisted of four blocks of 32 entries each – 16 entries with imposed B. juncea competition (competition) and 16 without (non-competition) – representing a continuum of increasing competition from the non-competition treatment at Edmonton Conventional (almost no weed pressure) to the competition treatment at the Certified Organic Farm (extreme weed pressure). Non-competition plots on conventional land were the only ones to receive herbicide application. They were treated with Dyvel (active ingredients MCPA and Dicamba) applied at 1235·5 ml/ha at the recommended crop (2–4 leaf) and weed (emergence to 3 leaf) growth stages (Brook Reference Brook2006).
Data collection
Emergence counts of both crop and B. juncea were taken before the onset of tillering (1–3 leaf stage). Plots were scored for early season vigour (ESV) 1 month after seeding. ESV ratings were based on visual assessments of plant leaf size, number and overall form, and were scored on a scale of 1 (low vigour) to 5 (highly vigorous). At Edmonton Conventional and Edmonton Organic in 2004 and 2005, heading and maturity were recorded when 0·75 of a given plot was fully headed and at physiological maturity, respectively. Light interception readings were recorded with a LI-191 Line Quantum Sensor (LI-COR Environmental, Lincoln, Nebraska) as close to 21 June (the longest day of the year) as possible. Leaf area index (LAI) was measured at this time as well, using an LAI-2000 Plant Canopy Analyser (LI-COR Environmental, Lincoln, Nebraska). Weed and B. juncea samples were collected separately from each plot using 0·25 m×0·25 m quadrats when the crop had reached physiological maturity. Disease ratings were recorded for naturally accruing leaf spotting diseases on a scale from 0 (no leaf spot disease present) to 5 (flag leaf 0·75 covered with disease), while powdery mildew (Erysiphe graminis f. sp. tritici) and stripe rust (Puccinia striiformis Westend. f. sp. tritici) were scored following the modified Cobb's scale (Peterson et al. Reference Peterson, Campbell and Hannah1948). Stripe rust ratings were recorded in 2005 only, as that was the only year to have a measurable infestation of stripe rust. Tillers were counted in a randomly chosen 1-m segment within each plot. Lodging ratings were recorded throughout the season, particularly in 2004, when heavy winds and an early snowfall caused widespread lodging. Degree of lodging (angle) was rated on a 0 (no lodging present) to 9 (plot completely flat) scale. Once the entries were fully mature, but prior to harvest, ten spikes were randomly collected from each plot to determine kernels/spike and kernel weight.
A Wintersteiger plot combine harvested the entire plot for yield, which was determined after each sample was cleaned and dried to 130–140 g moisture/kg. B. juncea and other small weed seeds were removed from the plot yields using a 2 mm sieve and a fan, which also removed chaff. In 2004, plot yields from the certified organic farm in New Norway were infested with wild oats to such a degree that they had to undergo hand cleaning on a sub-sample of 150 g. Test weight was determined using a 0·6 litre grain sub-sample, and the protein content of the grain was determined using a FOSS 6500 spectrometer (FOSS NIRSystems 6500, Silver Springs, Maryland) and WinISI II software (FOSS NIRSystems 6500, Silver Springs, Maryland).
Data analysis
For the purposes of examining differences in the eight location-years, a preliminary simple analysis of variance over all environments was performed using the MIXED procedure (Littell et al. Reference Littell, Milliken, Stroup and Wolfinger1996) of SAS (version 8.2; SAS Institute 1999), where location-year, entry and competition were considered fixed, and replication and replication interactions were considered random. In this analysis, the eight location-years differed (P<0·01) for grain yield (data not shown). Mean yields at the Certified Organic Farm were low (1·27 t/ha in 2004 and 0·89 t/ha in 2005), compared with Edmonton Organic (3·62, 3·24 and 3·39 t/ha in 2003, 2004 and 2005, respectively) and Edmonton Conventional (3·36, 4·46 and 5·51 t/ha in 2003, 2004 and 2005, respectively). Due to the large differences in location precipitation, soils, grain yield and management practices, subsequent analyses of yield and agronomic indices were conducted and are presented by location combined over years.
Separate analyses of variance for each of the three locations (Edmonton Organic, Edmonton Conventional and Certified Organic Farm) were performed using the MIXED (Littell et al. Reference Littell, Milliken, Stroup and Wolfinger1996) procedure of SAS, where year, replication within year and entry×year effects were considered random. Entry, competition and their interactions were considered fixed. The mid-component average yield of a variety blend is the combined average for the sole-crop yield of the components in that blend, weighted according to ratio. Single degree of freedom contrasts, weighted by proportion seeded (e.g. 1:1, 2:1 or 1:2), were conducted to compare variety blend means with mid-component averages. Pearson's coefficients of correlation were computed within each location using the least-squares means of entries from each of the locations with the CORR procedure of SAS (SAS Institute 1999).
Entry×environment and stability analyses
In order to study the stability of yield performance of the three varieties and their mixtures across the range of environmental conditions, adjusted least-square means from single-location analyses were computed to form an entry by environment matrix, in which the eight location-years×two competition levels were considered as 16 environments. Stability analysis was performed using a joint linear regression method, in which a regression coefficient (Finley & Wilkinson Reference Finlay and Wilkinson1963; Eberhart & Russell Reference Eberhart and Russell1966) and deviation from regression were used as stability parameters within the mixed model framework following Piepho (Reference Piepho1999). A combined analysis of variance was performed in the MIXED procedure of SAS (SAS Institute 1999), with entry as fixed effect and environment in the REPEATED statement of the Mixed procedure. The stability parameters λi (Eberhart and Russell's regression coefficient) and σ2(f)i (Eberhart and Russell's deviation variance) and corresponding standard errors (s.e.) were computed for variance–covariance structures by inclusion of TYPE=FA(1) in the REPEATED statement (Piepho Reference Piepho1999) of the MIXED procedure of SAS (SAS Institute 1999).
The eight location-years×two competition levels were considered as 16 environments for the purposes of entry×environment and stability analyses. The combination of location-years and competition treatments provided a range of environmental variation ranging from the Certified Organic Farm under competition in 2005 (mean yield 0·99 t/ha) to Edmonton Conventional no competition in 2005 (mean yield 4·81 t/ha). Entries were different in terms of their overall yield and the value of stability parameters in the range of environmental conditions (Table 6). Entries with a λi close to average (±s.e.) were grouped as entries with average stability, while those with higher or lower λi were grouped as entries with below- or above-average stability, respectively. Entries with above-average overall yield and λi close to average were grouped as entries well adapted to all environments, while those with above-average yield and above-average λi were grouped as responsive to favourable environment.
Additionally, entry×environment interactions were studied by subjecting the data to analyses by the site regression model (SREG) with two principle components (PC) (Cornelius et al. Reference Cornelius, Crossa, Seyedsadr, Kang and Gauch1996). The SAS codes developed by CIMMYT Biometrics Group, available at http://www.cimmyt.org/english/wps/biometrics/index.htm (verified 5 Nov 2008) were used to subject the data to singular value decomposition and to compute the PC in the SREG model for the entries and environments. The entry main effect (G) plus entry×environment (GE) biplot (henceforth referred to as GGE biplot) was generated by plotting PC1 v. PC2 values for the entries and environments. The graphical method introduced by Yan et al. (Reference Yan, Hunt, Sheng and Szlavnics2000) was implemented for interpretation of the GGE biplot. A polygon was formed on the biplot by connecting markers of the most responsive entries (entries farthest from the origin of the biplot). The biplot was then divided into sectors by drawing perpendicular lines from the origin of the biplot to the sides of the polygon.
RESULTS
Precipitation at Edmonton was c. 30% below the regional 30-year average (334 mm) in 2003 (235 mm) and 2005 (285 mm) rainfall for the region, while it was c. 20% above average in 2004 (414 mm). At the Certified Organic location, precipitation was below the 30-year average for the region (323 mm) in 2004 (280 mm) and 2005 (200 mm).
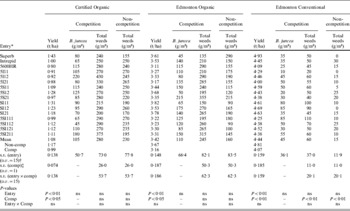
The main effects of entry and competition were significant (P<0·01) for grain yield at all three locations, while the interaction of competition×entry was not (P>0·05) (Table 2). No variety blend yielded greater (P>0·05) than its respective mid-component average, nor did any of the sole crops yield significantly more grain than their respective mixtures (Table 2).
Least-square means of grain yield and weed biomass for three wheat varieties and 13 resulting variety mixtures grown with and without B. juncea competition at three locations in north-central Alberta between 2003 and 2005

* See Table 1 for a list of abbreviations.
† Standard error of the difference between two means.
‡ Standard error of the difference between competition and non-competition main effects.
ns=not significant.
Sole-crop Superb, the three Superb–Intrepid mixtures and 5S12 were among the highest-yielding entries at all three locations (Table 2). Sole-crop 5600HR had the lowest average yield at all locations (Table 2), yielding less grain than all entries except for 5I11, 5I21 and 5SI111.
The artificial competition treatment reduced yield at all locations (Table 2). Total weed biomass did not differ significantly between entries at any location (Table 2). This may have been the result of large inherent variation in weed biomass in the field. Although variety mixtures varied for grain yield, they did not suppress weeds better than their sole-crop components (P>0·05) at any location.
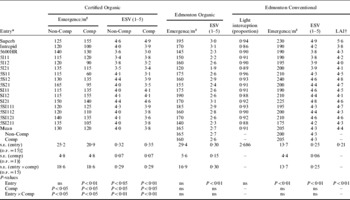
Mean emergence was 125 plants/m2 at the Certified Organic location compared with 163 and 203 plants/m2 at the Edmonton Organic and Conventional locations, respectively (Table 3). Entries differed (P<0·01) for emergence at the Edmonton Conventional location, with Superb and the mixtures 5S12 and SI21 exhibiting the greatest emergence proportions. The entry×competition interaction was significant for emergence at Certified Organic. Some entries exhibited decreased emergence in the competition treatment (e.g. 5S11 and sole-crop Intrepid), while others exhibited increased emergence (e.g. sole-crop Superb and SI12). Under competition, both 5S11 and 5S21 had significantly lower emergence than their mid-component averages at the Certified Organic Farm. ESV was 65% higher at Edmonton Conventional than at Edmonton Organic, with Superb and SI21 generally having the highest ESV (Table 3). ESV had a significant entry×competition interaction at the Certified Organic Farm, with most entries exhibiting decreased vigour in competition treatment. However, sole-crop Superb and the three Superb–Intrepid mixtures exhibited increased vigour in the competition treatment.
Least-square means of plant emergence, ESV, LAI and light interception for three wheat varieties and 13 resulting variety mixtures grown with and without B. juncea competition at three locations in north-central Alberta between 2003 and 2005

* See Table 1 for a list of abbreviations.
† LAI and light interception values are from non-competition Edmonton Conventional only.
‡ Standard error of the difference between two least-square means.
§ Standard error of the difference between competition and non-competition main effects.
ns=not significant.
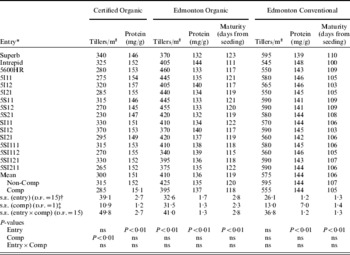
Entries differed (P<0·01) for spikes/m2 at the Edmonton Organic location only (Table 4). Competition reduced spikes/m2 (P<0·01) at Edmonton Conventional and Certified Organic, but not at Edmonton Organic. Mean spikes/m2 at the Certified Organic location was roughly half that of the Edmonton Conventional location. Only two variety mixtures had significantly fewer tillers than their mid-component average: 5S21 at Certified Organic (P<0·05) and 5SI112 at Edmonton Organic (P<0·01). Entries growing at Edmonton Organic matured 13 days later than Edmonton Conventional plants. Intrepid matured earliest and Superb the latest, regardless of location or management (Table 4). Competition did not alter (P>0·05) days to maturity at any location. SI11, 5I11 and 5SI211 all matured later (P<0·05) than their mid-component averages.
Least-square means of number of tillers/m2, maturity and protein content for three wheat varieties and 13 resulting variety mixtures grown with and without B. juncea competition at three locations in north-central Alberta between 2003 and 2005

* See Table 1 for a list of abbreviations.
† Standard error of the difference between two least-square means.
‡ Standard error of the difference between competition and non-competition main effects.
ns=not significant.
Mean lodging was negligible at the Certified Organic Farm, with location averages of 4 on a 0–9 rating scale at both Edmonton locations. The main effects of entry and competition from B. juncea were not significant (P>0·05) for lodging at any location (data not shown). Lodging may have been negligible at the Certified Organic Farm because of overall lower growth and yield potential of this location. There were no differences in disease rating between entries on any of the locations (data not shown). Overall disease was lowest at Certified Organic (dry, low-nutrient conditions) and highest at Edmonton Conventional (moist, high-nutrient conditions). Disease tended to be greater under competition, but the increase was significant at Edmonton Conventional only (P<0·05).
Mean grain protein was lowest at the Edmonton Organic location (136 mg protein/g) compared with the Edmonton Conventional (144 mg protein/g) and Certified Organic (151 mg protein/g) locations (Table 4). Among the varieties tested, Intrepid generally had high protein regardless of location and Superb had low protein. At the Certified Organic and Edmonton Conventional locations, no variety blend differed from their mid-component averages, but at Edmonton Organic, both 5I11 and SI11 had significantly lower protein levels (P<0·05) than their mid-component averages, perhaps because of the high protein content of Intrepid at that location.
LAI and light interception data are presented from the non-competition treatment plots at Edmonton Conventional, so these values are not influenced by the presence of weeds. Entries differed in their LAI (Table 3). However, even though the sole crops differed (Superb 5.6, 5600HR 4.3 and Intrepid 3.8) for LAI (P<0·01), the 13 variety mixtures were not statistically different in LAI (Table 3).
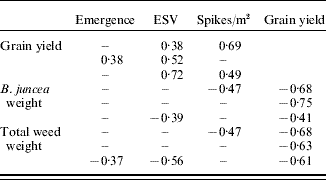
ESV was positively correlated with yield at all locations, with the correlation increasing as competition and stress increased from the Edmonton Conventional location to the Certified Organic Farm (Table 5). There was a negative correlation between B. juncea biomass and total weed biomass and yield at every location, indicating the important effect weed competition has on yield. On the Certified Organic Farm, ESV had the strongest negative correlation with both weed and B. juncea weight, suggesting that ESV is associated with weed suppression under organic management. At the Edmonton Conventional location, however, spikes/m2 and maturity had the strongest negative correlation with weed and B. juncea weight.
Pearson's coefficients of correlation (P<0·05) among grain yield, weed biomass and various agronomic characters for 16 entries grown at Edmonton Conventional (top), Edmonton Organic (middle) and Certified Organic (bottom) locations between 2003 and 2005
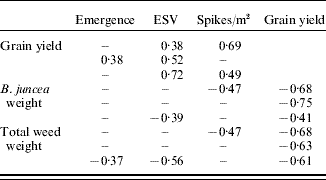
– Correlation coefficient not significant (P>0·05).
Entry×environment interaction and stability analysis
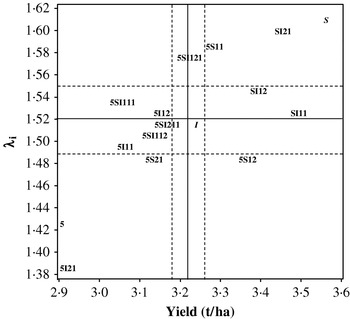
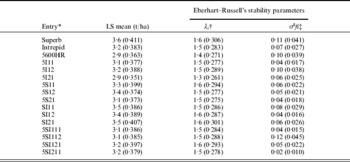
Superb and 5600HR were the highest and lowest yielding entries, respectively, while Intrepid yielded around the average (Table 6). The value of the stability parameter (λi) for Superb was significantly higher than average, indicating lower than average stability, lower than average for 5600HR, indicating greater than average stability and around the average for Intrepid, indicating average stability (Table 6; Fig. 1). Among the variety mixtures, entries SI11 and SI21 yielded above the average with λi close to average, indicating that these entries were well adapted to the range of environmental variation. The blend SI21 yielded above the average and, similar to Superb, had above-average λi, indicating that these entries responded better than other entries to favourable environments (Fig. 1). The two blend entries SI11 and SI21 also had smaller variance of deviations (σ2fi) and were therefore more stable compared with Superb (Table 6).
The relationship between variety adaptation and variety mean yield for three wheat varieties and 13 resulting variety mixtures grown in 16 environments. Solid lines indicate mean values and dotted lines represent ±s.e. See Table 1 for a list of abbreviations used for the markers of entries.

Least-square means (LS mean±s.e.) of grain yield for three wheat varieties and 13 resulting variety mixtures combined over competition treatments of with and without B. juncea and three locations over the 3 years and the corresponding estimates of Eberhart and Russell's (Reference Eberhart and Russell1966) stability parameters (±s.e.) as proposed by Piepho (Reference Piepho1999) for variance–covariance structure of different stability models

* See Table 1 for a list of abbreviations.
† Regression coefficient stability parameter.
‡ Variance of deviations from regression.
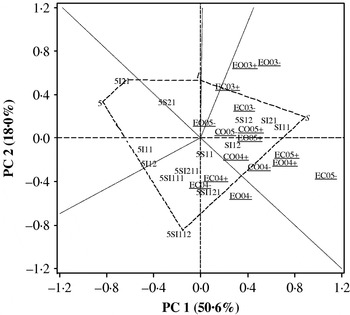
The relatively large contribution of location to overall variation in yield (0·77), which is irrelevant to differences among the entries, justifies the application of the SREG model, because it focuses on entries and entry×environment interaction but discards location effect (Yan et al. Reference Yan, Hunt, Sheng and Szlavnics2000). In the SREG analysis, both PC1 and PC2 were significant (P<0·01) and accounted for 0·51 and 0·18 of the variation, respectively. The PC1 and PC2 together accounted for 0·69 of the total entry+entry×environment interaction, which makes up the GGE biplot (Fig. 2). Therefore, the SREG model with the first two PC was the most predicatively accurate member of its model family.
The entry main effect plus entry×environment interaction biplot resulting from site regression analysis of mean yield for three wheat varieties and 13 resulting variety mixtures grown in 16 environments under organic and conventional management in Alberta, Canada. See Table 1 for abbreviated form of entries. Environment markers are underlined with + representing ‘with B. juncea’ and − representing ‘without B. Juncea’ treatments, EC and EO representing Edmonton Organic and Edmonton Conventional and CO representing Certified organic in New Norway, respectively, and 03, 04, and 05 representing the year. Varieties or mixtures at the vertices of the polygon are the most responsive entries, while lines from the origin of the biplot perpendicular to the edges of the polygon delimit subsets of environments and entries with reduced crossover interaction.

According to the graphical method introduced by Yan et al. (Reference Yan, Hunt, Sheng and Szlavnics2000) and Crossa et al. (Reference Crossa, Cornelius and Yan2002), the entries at the vertex of the polygon are the best performing entries in the environments included between the two corresponding perpendiculars. For example, Superb was the best performer in the Certified Organic field in 2004 and 2005 with and without competition, Edmonton Conventional 2003 and 2005 with and without competition, Edmonton Organic 2003 with and without competition and Edmonton Organic 2004 with competition (Fig. 2). Vertex entries with any environment in their sector (5600HR and 5I21) were not the best performer in any environment, and entries within the polygon were less responsive than the vertex entries.
The correlation between PC1 scores and entry main effects was near perfect (r=0·97; P<0·001). This allows the examination of the environments for their discriminating ability and also the assessment of entries for their yielding ability and stability. Entries Superb, SI11 and SI21 were the highest-yielding (large PC1) and most stable (near zero PC2) entries over 16 environments.
DISCUSSION
The present paper reports on the performance of wheat variety mixtures composed of agronomically diverse varieties in different blending ratios, grown in environmental conditions ranging from low-input competitive environments under organic management to optimum growing conditions under conventional management. Previous studies have reported decreased yield in semi-dwarf wheat varieties when blended with tall varieties, or otherwise placed under competition (McKenzie & Grant Reference McKenzie and Grant1980). In the present study, the semi-dwarf Superb yielded well in all environments, even under severe competition, and was the highest-yielding entry. Each of the three wheat varieties responded differently when blended with other varieties. 5600HR yielded less than at least three of its mixtures at every location. Superb yielded more grain than the three Superb–Intrepid mixtures at any location, and Intrepid yielded similarly to most of its mixtures. Variety mixtures did not lodge or resist diseases any better than the sole-crop varieties in the present study. Wheat variety mixtures are often used for disease mitigation and control (Strzembicka et al. Reference Strzembicka, Gacek, Węgrzyn and Nadziak1998). Many studies use at least one resistant variety to obtain noticeable disease reduction (Wolfe & Barrett Reference Wolfe and Barrett1980; Cox et al. Reference Cox, Garrett, Bowden, Fritz, Dendy and Heer2004), while varieties for the present study were chosen based on agronomic potential which differed slightly in leaf spotting disease resistance.
One of the goals of wheat variety mixtures is to combine varieties with differing morphology and rooting structure in a ratio that will minimize intraspecific competition and produce yields higher than the components in monoculture (Sarandon & Sarandon Reference Sarandon and Sarandon1995). Of all the mixtures tested, the Superb–Intrepid mixtures were consistently the highest yielding. The 1:1 and 1:2 Superb–Intrepid entries were also the most stable of all entries tested. These variety mixtures combined the semi-dwarf (0·90 m tall) and elevated LAI (LAI=5·6) characteristics of Superb, with the early maturing (100 days from planting), medium height (0·99 m tall) and low LAI (3·8) characteristics of Intrepid. Even though Superb was the highest-yielding entry at most environments, 1:1 and 1:2 Superb–Intrepid entries never yielded significantly less than sole-crop Superb; they also yielded more grain than sole-crop Intrepid under low-input conditions at the Certified Organic Farm. While Superb was the most responsive of all entries to favourable environments, the two Superb–Intrepid mixture entries were found as being more stable and perhaps better suited to low-input competitive environments than Superb.
Sage (Reference Sage1971) believed that for a variety mixture to be considered viable by producers, it should yield as well as, or better than, its mid-component average. None of the variety mixtures in the current experiment yielded more grain than their mid-component average. Thus, no variety tested exhibited elevated blending ability. The general consensus in the literature is that the more components a variety mixture has, the higher yielding it will be (Mundt et al. Reference Mundt, Brophy and Schmitt1995; Strzembicka et al. Reference Strzembicka, Gacek, Węgrzyn and Nadziak1998). In the present experiment, the two-way variety mixtures yielded more than the three-way variety mixtures at one organic location (averaged over 3 years), but were not different at the other organic (averaged over 2 years) and conventional (averaged over 3 years) locations. In addition to yielding well, organic producers require crops that are highly competitive and can suppress weeds (Bàrberi Reference Bàrberi2002), but the present study found no particular mixture or sole crop that suppressed weeds significantly better than any of the others. Even though none of the entries suppressed weeds, Superb and the Superb–Intrepid mixtures could be classified as tolerant to weed competition, since they maintained their yield even under severe competition. This is a detriment to the adoption of these particular entries by organic producers, since they cannot risk intensification of weed infestations from growing crops that do not actively suppress weeds.
Sage (Reference Sage1971) suggested that competitiveness of variety mixtures against weeds would be greatest when phenotypic differences in height and earliness are great between component varieties (e.g. when one component is tall and the other is early maturing). This may explain how variety mixtures composed of Superb (late-maturing variety, semi-dwarf, elevated LAI and ESV) and Intrepid (early-maturing variety, tall, low LAI and moderate ESV) exhibited elevated yield, high stability and tolerated weed pressure. Superb also consistently yielded the most grain of all the sole crops, regardless of weed pressure or soil nutrient status. Of all the entries, sole-crop Superb had the highest LAI, which may contribute to the high yield of this variety under both organic and conventional management (Lemerle et al. Reference Lemerle, Verbeek, Cousens and Coombes1996).
However, the highest-yielding and most stable variety mixtures were of Superb and Intrepid, two varieties that vary widely in maturity, height, LAI and ESV. In the present experiment, a 1:1 ratio of a highly vigorous semi-dwarf mixed with an early-maturing average height variety combined high yield and stability and was the best out of all mixture entries tested under both organic and conventional management.
Tillering capacity and height are often considered important competitive traits in wheat, particularly in organic systems (Bond & Grundy Reference Bond and Grundy2001; Mason & Spaner Reference Mason and Spaner2006; Mason et al. Reference Mason, Goonewardene and Spaner2008). Generally, in the present experiment, tillering and yield decreased from conventional to organic production, presumably from increased competition and decreased soil moisture and nutrients. Because of the need for multiple tillage operations to control weeds, seeding dates on organic land are usually later than on conventional land (Bond & Grundy Reference Bond and Grundy2001). Delayed seeding seemed to affect maturation times for the organic crops, causing them to reach maturity almost 2 weeks later than conventional crops. This is most probably due to the fact that the conventional crops were in their most rapid growth stage (tillering to stem elongation) around 21 June, when day length (and thus, photosynthetic activity) was at its maximum (Slafer et al. Reference Slafer, Abeledo, Miralles, Gonzalez and Whitechurch2001).
Overall grain protein content increased from Edmonton Organic to Edmonton Conventional to Certified Organic. The highest-yielding sole crop (Superb) had the lowest protein content. The strong negative correlation between protein content and yield has been well documented (Kibite & Evans Reference Kibite and Evans1984). The variety mixtures (particularly the Superb–Intrepid mixtures) generally had greater protein content than Superb, but not often as high as Intrepid. This is one aspect of variety mixtures that holds promise for both conventional and organic producers, as high protein wheat is worth more under the Canadian grading system. Variety mixtures with yield not significantly different from the highest-yielding component but with significantly higher protein levels would give producers a better economic return, all other aspects remaining equal.
Lemerle et al. (Reference Lemerle, Verbeek, Cousens and Coombes1996) reported that competitive wheat varieties shared certain characteristics, including above-average height, high early biomass accumulation (ESV), a large tillering capacity and high LAI. Of the agronomic traits examined in the present study, ESV appeared to be important for yield production, especially in heavily stressed and competitive environments. The significant entry×competition effect for ESV and emergence under organic management may suggest the importance of choosing the right variety or variety mixture under competitive environments. Sole-crop Superb had high ESV ratings at all locations and was not tall or high tillering, but appeared to be among the most competitive of the entries tested. Of all the agronomic traits observed, ESV was the only one to be positively correlated with yield at all three locations. In addition, ESV was the one trait associated with weed suppression on organic land. Most of the higher yielding entries also had comparatively high emergence in all locations, indicating the importance of a well-prepared seedbed (Nasr & Selles Reference Nasr and Selles1995), high-quality seed (Xue & Stougaard Reference Xue and Stougaard2002) and high seeding rates (Gooding et al. Reference Gooding, Pinyosinwat and Ellis2002) to overcome weed pressure.
In conclusion, the present experiment examined the potential of spring wheat variety mixtures under organic and conventional management systems. Growing variety mixtures may have several advantages over sole crops under either management system. Some of the high-yielding semi-dwarf spring wheat varieties are known to have lower protein content compared with other varieties in the Canadian hard-red spring wheat class. Grain protein content may be improved if used in a variety mixture with higher protein content varieties. Under organic management, competition has a large negative effect on yield and thus both weed suppression and high yield must be considered when choosing a variety mixture. Considering that unpredictable environmental variation factors (year-dependent) are the main impediment in choosing the right variety or variety mixture, then stability of performance might be the greatest advantage of variety mixtures. The present study indicates that of the variety mixtures with above-average yield and stable performance, the 1:1 mixture of a highly vigorous semi-dwarf variety and an average height, early maturing variety may be the most stable variety mixture, with little or no reduction in yield. Such variety mixtures also had one of the lowest total weed biomass in its plots, indicating improved competitive ability. However, further studies are needed to determine which specific varieties commonly used on the Canadian prairies can potentially be good choices to be used as components of variety mixtures. If wheat variety mixtures are to be profitably employed by organic producers, they must be competitive enough to suppress weeds to the same degree as, or preferably more than, sole-crop wheat.
The authors wish to acknowledge the technical assistance of Brian Bowen, Byron Cordero, Travis Eldstrom, Dione Litun, Layne Manson, Dan Stanton and Klaus Strenzke. Special thanks to Steven Snider of Little Red Hen Mills, New Norway, Alberta. Amelia Kaut received a post-graduate scholarship from the Natural Sciences and Engineering Research Council of Canada (NSERC). This research was also supported by grants to the University of Alberta wheat breeding program from Alberta Agricultural Research Institute and Alberta Crop Industry Development Fund Ltd, the Canadian Wheat Board, the Organic Agriculture Centre of Canada and an NSERC Discovery Grant.