


Introduction
Rice (Oryza sativa L.) is one of the major food crops in the world and more than half of the world's inhabitants rely on it as their staple food. Nitrogen (N) is one of the most important nutrients for rice growth, development and yield. However, excessive N application to rice causes environmental pollution, reduces N use efficiency, increases the cost of farming and increases rice susceptibility to lodging and diseases (Ju et al., Reference Ju, Xing, Chen, Zhang, Zhang, Liu, Cui, Yin, Christie, Zhu and Zhang2009; Peng et al., Reference Peng, Buresh, Huang, Zhong, Zou, Yang, Wang, Liu, Hu, Tang, Cui, Zhang, Dobermann, Lichtfouse, Hamelin, Navarrete and Debaeke2011; Zhang et al., Reference Zhang, Wu, Wu, Ding, Li, Li, Weng, Liu, Tang, Ding and Wang2016). Evaluating plant N content and accumulation are key issues for analysing, monitoring and managing crop systems (Naylor and Stephen, Reference Naylor and Stephen1993; Senanayake et al., Reference Senanayake, Naylor and DeDatta1996; Jaggard et al., Reference Jaggard, Qi and Armstrong2009). A reliable estimate of crop N requirement allows the optimization of N management to improve both rice production and N use efficiency, thereby reducing impacts on the environment (Ghosh et al., Reference Ghosh, Mandal, Mandal, Lodh and Dash2004). For these reasons, different technologies supporting N management have been developed. Plant-based analytical techniques such as chlorophyll metres and remote sensing have been developed to assess N deficiencies in crops and can be used for N management to attain high profitability and sustainability in crop production based on the dynamics of critical plant N.
The critical N (Nc) dilution curve is a plant-based analytical technique that diagnoses plant N status by Nc concentration, i.e. Nc is the minimum N concentration required for maximum crop growth. Nitrogen nutrition index (NNI) and accumulated N deficit were developed to assess crop N status based on the concept of Nc (Justes et al., Reference Justes, Mary, Meynard, Machet and Thelier-Huché1994; Ata-Ul-Karim et al., Reference Ata-Ul-Karim, Yao, Liu, Cao and Zhu2013). This approach has also been widely used in crop models (Godwin and Jones, Reference Godwin, Jones, Hanks and Ritchie1991; Gayler et al., Reference Gayler, Wang, Priesack, Schaaf and Maidl2002; Jones et al., Reference Jones, Hoogenboom, Porter, Boote, Batchelor, Hunt, Wilkens, Singh, Gijsman and Ritchie2003; Bouman and Van Laar, Reference Bouman and Van Laar2006; Zhao et al., Reference Zhao, Wang, Wang, Zang, Liu and Angus2014b) due to its flexibility, successful application to different spatial scales and suitability for scenario analysis. Existing rice models also adopt this approach widely. The Nc curves in these models are expressed as a function of phasic development (Singh et al., Reference Singh, Ritchie and Godwin1993; Hasegawa and Horie, Reference Hasegawa, Horie, Kropff, Teng, Aggarwal, Bouma, Bouman, Jones and van Laar1997; Yin and van Laar, Reference Yin and Van Laar2005; Bouman and Van Laar, Reference Bouman and Van Laar2006; Fumoto et al., Reference Fumoto, Kobayashi, Li, Yagi and Hasegawa2008) and dilution law (Brisson et al., Reference Brisson, Mary, Ripoche, Jeuffroy, Ruget, Nicoullaud, Gate, Devienne-Barret, Antonioletti, Durr, Richard, Beaudoin, Recous, Tayot, Plenet, Cellier, Machet, Meynard and Delécolle1998; Tang et al., Reference Tang, Zhu, Hannaway, Meng, Liu, Chen and Cao2009). Most of the Nc curves in the existing crop models were established more than 20 years ago, so new Nc curves from recent studies should be applied in crop models for different varieties and climatic areas.
Plant N demand and uptake would be under-estimated when Nc is used to calculate N demand of the plant under the conditions of high-N supply. This under-estimation is due to the excessive uptake of N by plants at high-N fertilization conditions. After a plant reaches its Nc, N uptake will continue up to the maximum plant N concentration (Nmax) (Justes et al., Reference Justes, Mary, Meynard, Machet and Thelier-Huché1994; Ata-Ul-Karim, et al., Reference Ata-Ul-Karim, Yao, Liu, Cao and Zhu2013). The Nmax is a determinant in the estimation of maximum N accumulation capacity of shoots (Lemaire and Gastal, Reference Lemaire, Gastal and Lemaire1997; Zhao et al., Reference Zhao, Wang, Wang, Zang, Liu and Angus2014b) and can be considered as the estimate of a maximum N dilution curve (i.e. a curve corresponding to the maximum N uptake). Plant growth rate is not limited by N when plant N is between Nc and Nmax, because no significant difference is observed between the corresponding dry matter (Justes et al., Reference Justes, Mary, Meynard, Machet and Thelier-Huché1994; Ata-Ul-Karim, et al., Reference Ata-Ul-Karim, Yao, Liu, Cao and Zhu2013). This value could be introduced to calculate the maximum N demand of the plant. This process is not simulated in the existing rice models that use the concept of the Nc curve (also called optimal or maximum curve in some models), such as ORYZA2000 (Bouman and Van Laar, Reference Bouman and Van Laar2006), CERES-rice (Godwin and Singh, Reference Godwin, Singh, Tsuji, Hoogenboom and Thornton1998) and H/H (Hasegawa and Horie, Reference Hasegawa, Horie, Kropff, Teng, Aggarwal, Bouma, Bouman, Jones and van Laar1997). It is also important to simulate N status of individual plant organs, especially leaves and panicles (grains), as leaf N is highly responsive to N fertilization and grain N is the key index of protein content. Plant luxury N uptake affects the distribution of N among different plant organs, thus N accumulation and translocation among organs should be estimated under the circumstance of luxury N uptake. The N dilution curves for specific plant organs (e.g. leaves and stems) could be used to quantify the amount of N that flows to the corresponding organ (Ata-Ul-Karim, et al., Reference Ata-Ul-Karim, Yao, Liu, Cao and Zhu2014; Yao et al., Reference Yao, Ata-Ul-Karim, Zhu, Tian, Liu and Cao2014a, Reference Yao, Zhao, Tian, Liu, Ni, Cao and Zhub; Zhao et al., Reference Zhao, Yao, Tian, Liu, Ata-Ul-Karim, Ni, Cao and Zhu2014a). Application of Nc, Nmax and Nmin curves of shoots and organs to a rice model could be a better alternative way to simulate N uptake in rice and improve prediction accuracy of those rice models which simulate N dynamics based only on Nc curves. It is also of benefit for understanding N accumulation and translocation within plants during vegetative and reproductive growth periods in rice.
RiceGrow is an eco-physiological process-based simulation model for rice growth and was developed by quantifying the fundamental growth processes and their response to environmental factors, genotypic parameters and management practices (Tang et al., Reference Tang, Zhu, Hannaway, Meng, Liu, Chen and Cao2009). It has been evaluated and applied in different ecological conditions and future scenarios (Liu et al., Reference Liu, Wang, Zhu and Tang2012, Reference Liu, Wang, Zhu, Tang and Cao2013; Li et al., Reference Li, Hasegawa, Yin, Zhu, Boote, Adam, Bregaglio, Buis, Confalonieri, Fumoto, Gaydon, Marcaida, Nakagawa, Oriol, Ruane, Ruget, Singh, Singh, Tang, Tao, Wilkens, Yoshida, Zhang and Bouman2015; Hasegawa et al., Reference Hasegawa, Li, Yin, Zhu, Boote, Baker, Bregaglio, Buis, Confalonieri, Fugice, Fumoto, Gaydon, Kumar, Lafarge, Marcaida Iii, Masutomi, Nakagawa, Oriol, Ruget, Singh, Tang, Tao, Wakatsuki, Wallach, Wang, Wilson, Yang, Yang, Yoshida, Zhang and Zhu2017). However, RiceGrow presently simulates the plant N demand based only on the shoot Nc curve and only shoot N is simulated: no organ N dynamics within the plant are simulated. The current study aims to develop a new process-based sub-model within RiceGrow (Tang et al., Reference Tang, Zhu, Hannaway, Meng, Liu, Chen and Cao2009) for simulating plant N uptake and distribution based on Nc, Nmax and Nmin curves (Ata-Ul-Karim et al., Reference Ata-Ul-Karim, Yao, Liu, Cao and Zhu2013, Reference Ata-Ul-Karim, Yao, Liu, Cao and Zhu2014; Yao et al., Reference Yao, Ata-Ul-Karim, Zhu, Tian, Liu and Cao2014a). The specific objectives are: (1) to quantify N luxury uptake of rice plant when N supply from soil and fertilization is at a high level; and (2) to simulate the dynamics of N uptake and translocation in the whole rice plant and individual organs in the RiceGrow model.
Materials and methods
Model description
Overview of the RiceGrow model
RiceGrow was developed by analysing and integrating the relationships among rice growth, development and environment conditions (Tang et al., Reference Tang, Zhu, Hannaway, Meng, Liu, Chen and Cao2009). The model contains seven sub-models: phenology, morphology and organ formation, photosynthesis and biomass accumulation, biomass partitioning, yield and grain quality formation, water, and N balance. In general, RiceGrow simulates the observed phenology, biomass and yield as interactive effects of rice cultivar, climate and management factors (cultivar, fertilizer, irrigation) (Liu et al., Reference Liu, Wang, Zhu and Tang2012, Reference Liu, Wang, Zhu, Tang and Cao2013). The model has been evaluated under different conditions and compared with the existing rice models in the Agricultural Model Inter-comparison and Improvement Project (AgMIP) (Li et al., Reference Li, Hasegawa, Yin, Zhu, Boote, Adam, Bregaglio, Buis, Confalonieri, Fumoto, Gaydon, Marcaida, Nakagawa, Oriol, Ruane, Ruget, Singh, Singh, Tang, Tao, Wilkens, Yoshida, Zhang and Bouman2015; Hasegawa et al., Reference Hasegawa, Li, Yin, Zhu, Boote, Baker, Bregaglio, Buis, Confalonieri, Fugice, Fumoto, Gaydon, Kumar, Lafarge, Marcaida Iii, Masutomi, Nakagawa, Oriol, Ruget, Singh, Tang, Tao, Wakatsuki, Wallach, Wang, Wilson, Yang, Yang, Yoshida, Zhang and Zhu2017). Soil N is divided into different sub-pools based on their present forms and availability. Soil N balance includes the processes of soil organic matter mineralization and immobilization, the decay of crop residues, fertilization, nitrification and denitrification, leaching and plant uptake (Ye et al., Reference Ye, Liu, Zhu and Cao2007). Algorithms were developed on the processes of transformation between the sub-pools, movement with soil water, root uptake and plant distribution. Plant N demand is presently calculated based on the Nc dilution curve (Ata-Ul-Karim, et al., Reference Ata-Ul-Karim, Yao, Liu, Cao and Zhu2013). If plant N is higher than Nc, the plant does not take up N; if shoot N is lower than Nc, plant N uptake is equal to the minimum between plant N demand based on the Nc dilution curve and N supplied by the soil. The N factor is quantified by NNI as calculated by the ratio of actual N content to Nc.
General description of the new plant nitrogen sub-model
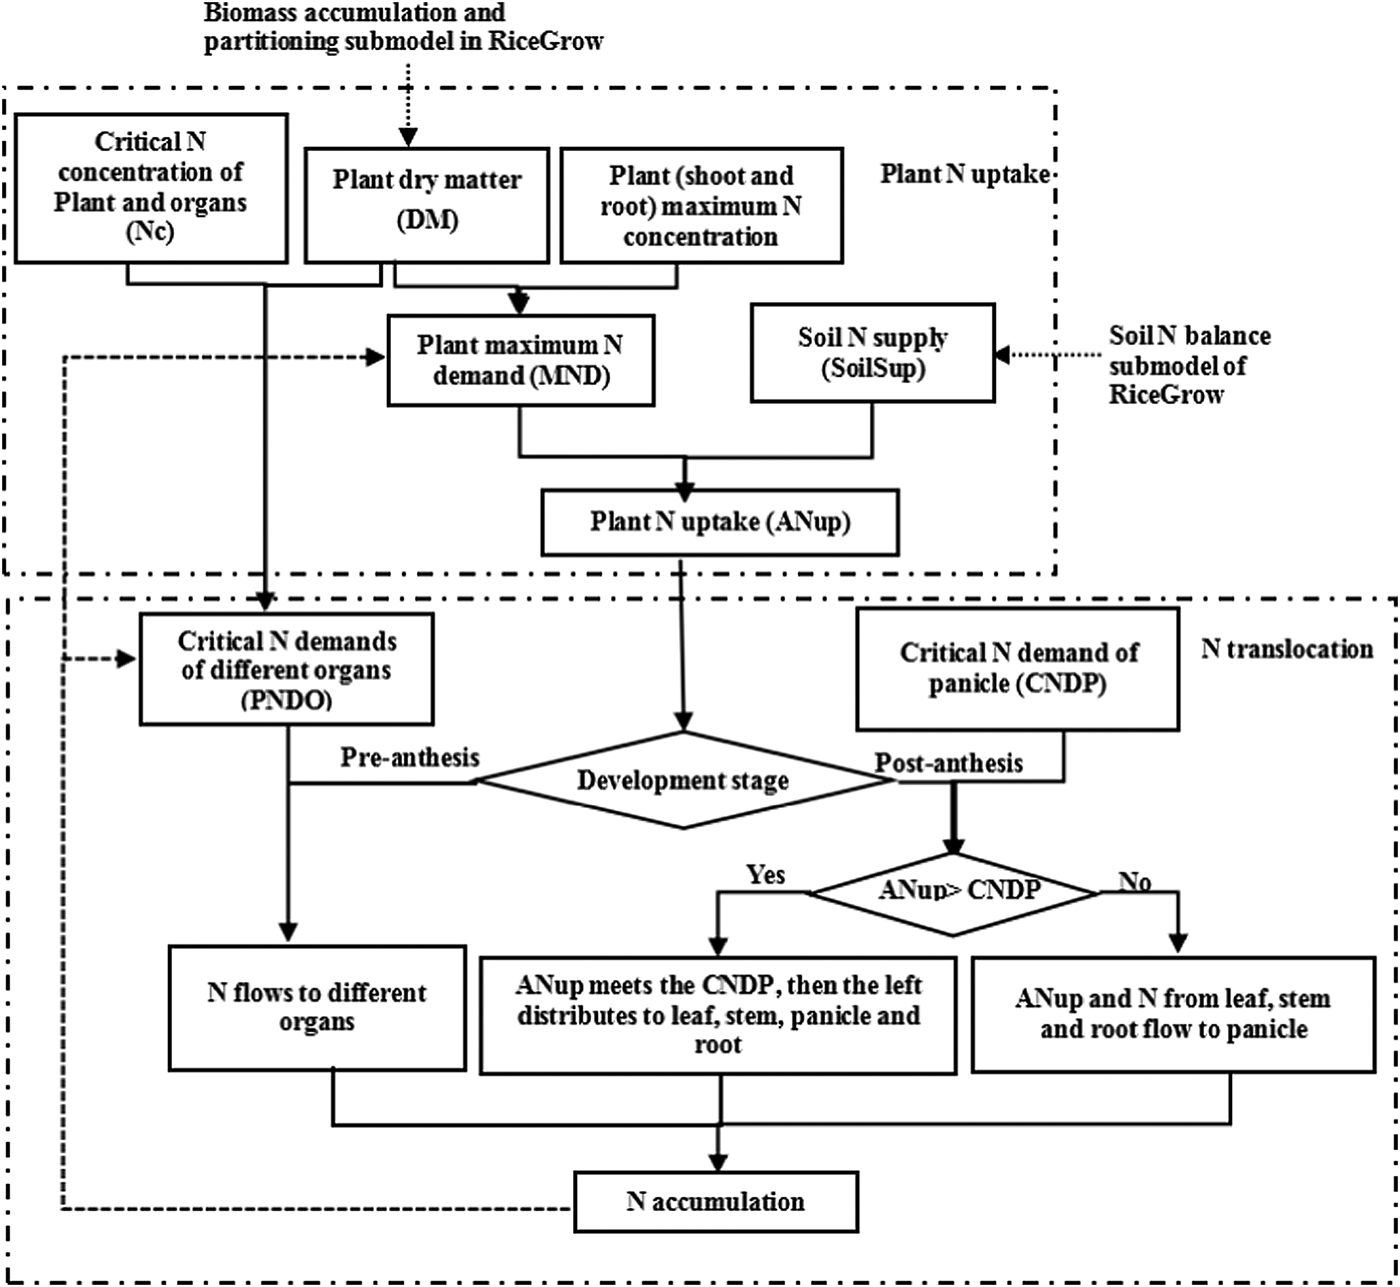
The current study focuses on improving simulation accuracy and optimizing plant N uptake and distribution processes in the RiceGrow model. The three sub-routines of the model simulate N demand, N uptake and N distribution and translocation within rice plant. Firstly, the maximum and Nc demand (obtained from the Nmax and Nc curves) of shoot and root and Nc demand of organs (leaf, stem and panicle) are calculated from N concentration, biomass and N accumulation. Secondly, the amount of plant N uptake depends on plant N demand and N supply from the soil, which is calculated in the soil N balance sub-model of RiceGrow. Finally, N distribution among organs is computed differently pre- and post-anthesis. Pre-anthesis distribution is determined by maximum N demand with no priority among organs. In post-anthesis distribution, the panicle demands are met first and then the remaining N is allocated to other organs without priority. The entire framework of the model is shown in Fig. 1 and the algorithms and variables are presented in Tables 1 and 2.
Structural framework of plant N uptake and translocation.
Description of variables

Equations in plant N sub-model of RiceGrow

Plant nitrogen demand
The model firstly calculates the maximum N accumulation demand of the plant. The maximum N curve (Nmax, g/g) is an estimate of the maximum N accumulation capacity of shoot and root, regulated by mechanisms associated with growth either directly or indirectly via N metabolism (Eqns (1) and (2)) (Ata-Ul-Karim et al., Reference Ata-Ul-Karim, Yao, Liu, Cao and Zhu2013). The Nmax of root equals 35% of leaf Nmax, based on data from multiple experiments. After plant N concentration reaches Nc, rice plants continue to incorporate N until Nmax is reached, if the soil has enough available N. Nc is used to calculate the Nc demand of the whole plant (CND, kg/ha) (Eqns (3) and (4)). The Nc of the root is estimated from experimental data as 35% of leaf Nc. Nc demands of organs also calculated (CNDP, kg/ha) by using Nc dilution curves of leaf (Yao et al., Reference Yao, Ata-Ul-Karim, Zhu, Tian, Liu and Cao2014a) stem (Ata-Ul-Karim, et al., Reference Ata-Ul-Karim, Yao, Liu, Cao and Zhu2014) and panicles (Jones et al., Reference Jones, Kiniry and Dyke1986) (Eqn (5)).
Nitrogen uptake
Actual plant N uptake (ANup, kg/ha) is the minimum between N supply in the soil (SoilSup) and maximum N demand of the plant (MND, kg/ha). When plant N concentrations are between Nmax and Nc, N uptake is determined by mineral N availability in soil and is independent of plant growth rate. If plant N concentrations are below the Nc dilution curve, N uptake is only limited by mineral N availability in soil and determines growth rate (Eqn (6)).
Nitrogen distribution and translocation
Nitrogen distribution and translocation are calculated using different approaches pre-anthesis and post-anthesis. Before anthesis, if ANup ⩽ CND, the amount of N flowing to leaves, stems, panicles and roots (ANupO, kg/ha) is determined by the ratio of ANup to CND (Eqns (7) and (8)). If ANup > CND, ANupO is determined by the ratio of actual organ N accumulation (NaccuO) to total plant N (Eqns (9) and (10)). After anthesis, if N uptake from soil could meet panicle demand but not the whole plant Nc demand, e.g. CNDP < ANup < CND, N allocation firstly meets panicle demand and any remaining is allocated proportionally to the other organs according to the N demand of those organs (Eqns (11) to (13)). If CNDP < CND < ANup, N allocation meets panicle demand and the remainder is allocated proportionally to different organs (including panicles) according to the N accumulation of those organs (Eqns (14) to (16)). If N uptake from the soil cannot meet panicle demand, then N reserved in other organs is translocated to the panicle. Potential N transported (PTRAN, kg/ha) from leaves, stems and roots is calculated by the minimum N (NminO) (Eqn (17)), and a translocation ratio (TR, TR ⩽ 1) is introduced to calculate the actual N translocation (ATRAN) from leaves, stems, and roots (Eqns (18) and (19)). Then the amount of N flowing to panicles (ANupP, kg/ha) is calculated as the sum of ANup and the actual N translocation (ATRAN) from leaves, stems and roots (Eqn (20)). Actual N accumulation of different organs (NaccuO) is calculated by the ATRANi subtracted from NaccuOi (Eqn (21)).
Experimental design
Five field experiments were conducted in Jiangsu province of eastern China and at the International Rice Research Institute (IRRI), Los Baños, Philippines with N rates ranging from 0 to 375 kg N/ha with various splits using urea fertilizer. Details of the experiments are shown in Table 3. Cultivars grown included Japonica rice inbred Wuxiangjing14 (WXJ14) in China and Indica inbred IR72 in the Philippines. Nitrogen application was spilt into basal and three top-dressings (approximately at growth stages [GS] 21, 30 and 40 according to Zadoks et al. (Reference Zadoks, Chang and Konzak1974), Table 3). There were four replicates in the Philippines and three in China. Soil at 0–20 cm depth was sampled before transplanting. In the Philippines, 12-day-old seedlings were transplanted at five seedlings per hill and 25 hills/m2. Crop samples were taken during the growth period from each treatment to determine biomass of stems, green leaves and panicles and leaf N concentration. In China, seedlings of about 30 days old were transplanted at two seedlings per hill and 22.2 hills/m2. Weeds, insects and diseases were controlled intensively by pesticides when required. Crop samples were taken during the growth period to determine biomass and N concentration of stems, green leaves and panicles.
Field experiment information

Model input
Daily weather data needed as input for the model included precipitation, daily maximum and minimum temperature, and daily radiation or hours of sunshine. Also required were soil properties at different soil layers (cm) before transplanting including dry soil bulk density (g/cm3), initial soil moisture content (g/g), field moisture capacity content (g/g), soil saturated moisture content (g/g), soil wilting moisture content (g/g), soil organic matter (g/kg), N concentration (g/kg) and ammonium and nitrate N content (mg/kg). Water and N management practices such as daily irrigated water amount, N fertilization rate and application time were also required to run the model.
Data analysis
Model evaluation
The model was run using the actual N regimes, sowing dates, transplanting dates, plant densities, soil data and daily weather data. Model calibration was done manually by adjusting input parameters to minimize the difference between simulated and observed plant biomass, and N accumulation in the shoot, leaf, stem and panicle during whole growth period. For variety WXJ14, data used to calibrate the model came from two experiments conducted in China in 2011 and 2012 that consisted of nine N fertilizer rates ranging from 0 to 370 kg N/ha (assumed excessive N). Different N fertilization splits were also included in the dataset from 2011. For variety IR72, calibration data came from experiments conducted in 1991 in IRRI that consisted of three N fertilizer rates.
Data used to validate the model for WXJ14 came from an independent experiment conducted in China in 2013 which included six levels of N fertilizer ranging from 0 to 375 kg N/ha. Validation data for the IR72 variety came from an independent experiment conducted in 1992 in the Philippines that included four N rates with several N splits (Table 3). Genetic parameters of WXJ14 and IR72 are shown in Table 4: detailed explanations of these parameters can be found in Tang et al. (Reference Tang, Zhu, Hannaway, Meng, Liu, Chen and Cao2009).
Model genetic parameters

LAI, leaf area index; CH2O, formaldehyde.
a See Tang et al. (Reference Tang, Zhu, Hannaway, Meng, Liu, Chen and Cao2009) for the explanation of variety parameters.
Graphs and statistical measures were used to evaluate the results of the model. Measured and simulated biomass and N accumulation were compared based on 1 : 1 line. Then the slope (a), intercept (b), adjusted coefficient of correlation (R 2) of the linear regression, mean relative error (RE) and normalized root mean square error (NRMSE) were derived from the difference between measured and simulated values. The simulations are considered to perform best when a and R 2 are 1, and b is 0. The simulation is considered excellent when NRMSE < 10%, good at 10–20%, fair at 20–30% and poor >30% (Jamieson et al., Reference Jamieson, Porter and Wilson1991).
Maximum and minimum plant nitrogen concentration and Nc curves
The Nmax, Nc and Nmin curves of plant and organs are used in the current work to predict plant N demand. The basic method used was proposed by Justes et al. (Reference Justes, Mary, Meynard, Machet and Thelier-Huché1994) and has been followed in many studies for a number of different crops including winter wheat (Justes et al., Reference Justes, Mary, Meynard, Machet and Thelier-Huché1994; Yue et al., Reference Yue, Meng, Zhao, Li, Chen, Zhang and Cui2012), potato (Greenwood et al., Reference Greenwood, Lemaire, Gosse, Cruz, Draycott and Neeteson1990; Bélanger et al., Reference Bélanger, Walsh, Richards, Milburn and Ziadi2001), winter oilseed rape (Colnenne et al., Reference Colnenne, Meynard, Reau, Justes and Merrien1998), maize (Ziadi et al., Reference Ziadi, Brassard, Bélanger, Cambouris, Tremblay, Nolin, Claessens and Parent2008), grain sorghum (Van Oosterom et al., Reference Van Oosterom, Carberry and Muchow2001), tomato (Tei et al., Reference Tei, Benincasa and Guiducci2002) and spring wheat (Ziadi et al., Reference Ziadi, Bélanger, Claessens, Lefebvre, Cambouris, Tremblay, Nolin and Parent2010). For high-yielding Indica rice, this allometric function was estimated by Sheehy et al. (Reference Sheehy, Dionora, Mitchell, Peng, Cassman, Lemaire and Williams1998) and Confalonieri et al. (Reference Confalonieri, Debellini, Pirondini, Possenti, Bergamini, Barlassina, Bartoli, Agostoni, Appiani, Babazadeh, Bedin, Bignotti, Bouca, Bulgari, Cantore, Degradi, Facchinetti, Fiacchino, Frialdi, Galuppini, Gorrini, Gritti, Gritti, Lonati, Martinazzi, Messa, Minardi, Nascimbene, Oldani, Pasqualini, Perazzolo, Pirovano, Pozzi, Rocchetti, Rossi, Rota, Rubaga, Russo, Sala, Seregni, Sessa, Silvestri, Simoncelli, Soresi, Stemberger, Tagliabue, Tettamanti, Vinci, Vittadini, Zanimacchia, Zenato, Zetta, Bregaglio, Chiodini, Perego and Acutis2011). The Nmax, Nc and Nmin curves of plant and organs of rice was developed in the Yangtze River Reaches as shown in Fig. 2 (Ata-Ul-Karim et al., Reference Ata-Ul-Karim, Yao, Liu, Cao and Zhu2013; Reference Ata-Ul-Karim, Yao, Liu, Cao and Zhu2014; Yao et al., Reference Yao, Ata-Ul-Karim, Zhu, Tian, Liu and Cao2014a). As the biomass of leaves and stems decline gradually after anthesis, the Nc and Nmin of leaf and stem are treated as the minimum N concentration of Nc and Nmin before anthesis.
Maximum (Nmax), critical (Nc) and minimum (Nmin) N concentration curves against shoot and organ biomass (Ata-Ul-Karim et al., Reference Ata-Ul-Karim, Yao, Liu, Cao and Zhu2013; Ata-Ul-Karim, et al., Reference Ata-Ul-Karim, Yao, Liu, Cao and Zhu2014; Yao et al., Reference Yao, Ata-Ul-Karim, Zhu, Tian, Liu and Cao2014a). Ncl and Ncs are the minimum N concentration required for maximum crop growth of leaf and stem, Nminl and Nmins are the low limit N concentration of leaf and stem, respectively.

Results
Model calibration
The statistical results of model simulations from the calibration dataset are shown in Table 5. Comparisons between simulated and measured biomass and N accumulation of shoot, panicles, leaves and stems are given for the calibration data in China (Figs 3 and 4) and the Philippines (Figs 3 and 5). The 1 : 1 line is shown as a solid line and the dashed lines indicate the ‘good’ range of NRMSE (the 1 : 1 line±20%). Generally, the dynamics of biomass and N of shoot are simulated better than that of organs due to the superposition error (organ biomass is simulated based on shoot biomass partitioning). The calibration results show most of the data points fall within the ±20% lines and indicate that the performance of the model is good. The biomass in both countries is generally simulated well (Fig. 3). The slopes (a) of shoot, stem and panicle are higher than 1 and the intercepts (b) are relatively high (Table 5), indicating that the three variables are over-estimated, this is due mainly to the over-estimation of shoot biomass under 200 and 300 N kg/ha treatments in 2011 in China (Fig. 3). In the experiments of 2011 and 2012 in China, according to the R 2, RE and NRMSE, the N accumulation of shoot and panicle was simulated well; however, simulation of the N accumulation of stems and leaves was relatively poor (Table 5). For leaf N concentration in the Philippines, several points are beyond the 20% line (Fig. 5), and NRMSE and RE are close to 30% (Table 5), respectively, indicating that the performance of the model for leaf N concentration was only ‘fair’.
Simulated v. measured biomass of shoot, panicle, leaf and stem for the calibration dataset of 2011 and 2012 in China and 1991 in the Philippines. Solid lines are the 1 : 1 line, dotted lines are ±20% around the 1 : 1 line. PHI-N0, PHI-N80 and PHI-N110 represent N treatments of 0, 80 and 110 kg/ha in the Philippines, respectively. CHN-0N, CHN-N170, CHN-N270, CHN-N370, CHN-N200 and CHN-N300 represent N treatments of 0, 170, 270, 370, 200 and 300 N kg/ha in China, respectively.

Simulated v. measured N accumulation of shoot, panicle, leaf and stem for the calibration dataset of 2011 and 2012 in China. Solid lines are the 1 : 1 line, dotted lines are ±20% around the 1 : 1 line. N0, N200, N300, N170, N270 and N370 represent N treatments of 0, 200, 300, 170, 270 and 370 N kg/ha, respectively.

Simulated v. measured N concentration of leaf for the validation dataset of 1992 in the Philippines. Solid lines are the 1 : 1 line, dotted lines are ±20% around the 1 : 1 line.

Calibration and validation results of RiceGrow simulations for biomass and N

Xmean, the mean of observed values (kg/ha); Xsim, the mean of simulated values (kg/ha); SD, standard deviation (kg/ha); a, slope of linear relation; b, intercept of linear relation; RE, mean relative error (%); R 2, adjusted coefficient of correlation; RMSE, root mean square error; NRMSE, normalized root mean square error (%).
a The dataset from both countries.
b The dataset from China.
c The dataset from Philippines.
Model validation
The validation results showed that the model simulated the biomass and N of shoots and organs satisfactorily. The slopes are close to 1 and R 2 values are relatively high for all evaluated variables, with NRMSEs < 30% (Table 5). Compared with the calibration dataset, simulation results were less scattered away from the 1 : 1 lines in the validation dataset, and most of the data lie between the ±20% lines. Figure 6 compares simulated with measured shoot, leaf, stem and panicle biomass for the validation set of the two countries, and shows the simulations are generally quite good. However, simulated values for stem biomass are relatively poor (Table 5): in particular, the values simulated at IRRI are over-estimated (Fig. 6). For the 2013 validation dataset in China, all the shoot and organ N accumulations are simulated well, except for leaf N accumulation, according to the R 2, RE and NRMSE values (Table 5), especially under the no N application treatment (Fig. 7). For leaf N concentration validated in the Philippines (Fig. 5, Table 5) the points scatter away from the 1 : 1 line, the R 2 is low and NRMSE is close to 30%, indicating a large spread in the data and poor performance of the model.
Simulated v. measured biomass of shoot, panicle, leaf and stem for the validation dataset of 2013 in China and 1992 in the Philippines. Solid lines are the 1 : 1 line, dotted lines are ±20% around the 1 : 1 line. PHI-N0, PHI-N30, PHI-N80 and PHI-N110 represent N treatments of 0, 30, 80 and 110 kg/ha in the Philippines, respectively. CHN-0N, CHN-N75, CHN-N150, CHN-N225, CHN-N275, CHN-N300 and CHN-N375 represent N treatments of 0, 75, 150, 225, 300 and 375 N kg/ha in China, respectively.

Simulated v. measured N accumulation of total above-ground panicle, leaf and stem for the validation dataset of 2013 in China. Solid lines are the 1 : 1 line, dotted lines are ±20% around the 1 : 1 line. 0N, N75, N150, N225, N300 and N375 represent N treatments of 0, 75,150, 225, 300 and 375 N kg/ha in China, respectively.

Model comparison
The original model (RiceGrowold) and the improved model established in the current study (RiceGrownew) were compared using the dataset from the 2013 experiment (Fig. 8). The simulation accuracy of shoot N accumulation was improved by using RiceGrownew compared with the original model, especially after the middle of the growth period. The simulation results of the original model and its adapted form showed no significant difference under 225 N kg/ha: the predicted values of two models are very similar (Fig. 8(a)). However, at higher N levels (375 kg/ha), the NRMSE of shoot N for RiceGrowold and RiceGrownew were 33.91 and 17.19%, respectively, and the shoot N predicted by RiceGrowold is significantly lower than RiceGrownew and is apparently under-estimated (Fig. 8(c)).
The simulated N accumulation of total above-ground in 2013 with higher N rates: 225 kg/ha (a), 300 kg/ha (b) and 375 kg/ha (c). ‘RiceGrowold’ is the original model and ‘RiceGrownew’ is the improved model.

Discussion
The original model, which simulates plant N demand, is based only on shoot Nc dilution curves and simulated only shoot N. RiceGrownew, however, simulates the dynamics of N uptake and translocation in the whole rice plant as well as within plant organs based on Nc, Nmax and Nmin curves, which should allow a better understanding of the process of N distribution within the plant during vegetative and reproductive growth periods in rice. RiceGrowold simulated plant N demand using the Nc curve as maximum N uptake; no N is incorporated when the plant N concentration is the same as the critical concentration. However, N uptake continues in RiceGrownew when the N concentration is higher than the critical concentration but lower than maximum N concentration. The comparison results confirm that RiceGrowold under-estimates N accumulation in the plant and RiceGrownew shows a better prediction under high-N fertilization conditions, which conforms to the observations in many studies (Justes et al., Reference Justes, Mary, Meynard, Machet and Thelier-Huché1994; Lemaire and Gastal, Reference Lemaire, Gastal and Lemaire1997; Ata-Ul-Karim et al., Reference Ata-Ul-Karim, Yao, Liu, Cao and Zhu2013).
During the late growth period, observed leaf N accumulation decreases quickly, but the simulated leaf N accumulation hardly changes, indicating that the leaf senescence part of the model should be improved further. Due to the over-estimation of leaf N accumulation, the RiceGrownew model shows lower accuracy of prediction than RiceGrowold. The simulated results were not as good for the 2012 dataset from China, which could be due to the warmer temperatures experienced in 2012, and the model failed to simulate the effects of high temperature stress adequately. The results demonstrate that the model can simulate N uptake well in conditions where N is non-limited (excessive). The results of the dynamics of biomass and N concentration of the leaf in the Philippines are relatively poor, especially for the data where no N was applied. This is because the model failed to simulate the rapid reduction of leaf biomass after anthesis and the relatively high biomass would result in low N concentration.
The Nc concentration curve for rice was developed based on Japonica rice in the Yangtze River Reaches of China (Ata-Ul-Karim et al., Reference Ata-Ul-Karim, Yao, Liu, Cao and Zhu2013). Previous reports have pointed out that there were inter-specific and intra-specific dissimilarities in the Nc curve (Justes et al., Reference Justes, Mary, Meynard, Machet and Thelier-Huché1994; Bélanger et al., Reference Bélanger, Walsh, Richards, Milburn and Ziadi2001). The Nc curve also varies with experimental site (Greenwood et al., Reference Greenwood, Lemaire, Gosse, Cruz, Draycott and Neeteson1990). Nitrogen dilution curves for different species from different regions could be used as a genotype-specific parameter for more precise simulation, which is not a part of most existing crop models. Since plant N dilution curve based NNI is also used as a common plant N diagnosis tool for crop N management, more N dilution curves for plant and organs will be developed with the rapid development of N monitoring, diagnosis and regulation (Colnenne et al., Reference Colnenne, Meynard, Reau, Justes and Merrien1998; Tei et al., Reference Tei, Benincasa and Guiducci2002; Debaeke et al., Reference Debaeke, Oosterom, Justes, Champolivier, Merrien, Aguirrezabal, González-Dugo, Massignam and Montemurro2012; Ata-Ul-Karim et al., Reference Ata-Ul-Karim, Yao, Liu, Cao and Zhu2013; Zhao et al., Reference Zhao, Yao, Tian, Liu, Ata-Ul-Karim, Ni, Cao and Zhu2014a). Further universal (global) or more particular (local) Nc concentrations for rice plant and organs should be developed for more precise N prediction and management. Different N routines, algorithms, parameters and results of different rice models should be further compared by multi-model inter-comparison studies (Li et al., Reference Li, Hasegawa, Yin, Zhu, Boote, Adam, Bregaglio, Buis, Confalonieri, Fumoto, Gaydon, Marcaida, Nakagawa, Oriol, Ruane, Ruget, Singh, Singh, Tang, Tao, Wilkens, Yoshida, Zhang and Bouman2015; Confalonieri et al., Reference Confalonieri, Bregaglio, Adam, Ruget, Li, Hasegawa, Yin, Zhu, Boote, Buis, Fumoto, Gaydon, Lafarge, Marcaida, Nakagawa, Ruane, Singh, Singh, Tang, Tao, Fugice, Yoshida, Zhang, Wilson, Baker, Yang, Masutomi, Wallach, Acutis and Bouman2016a; Yin et al., Reference Yin, Kersebaum, Kollas, Manevski, Baby, Beaudoin, Öztürk, Gaiser, Wu, Hoffmann, Charfeddine, Conradt, Constantin, Ewert, De Cortazar-Atauri, Giglio, Hlavinka, Hoffmann, Launay, Louarn, Manderscheid, Mary, Mirschel, Nendel, Pacholski, Palosuo, Ripoche-Wachter, Rötter, Ruget, Sharif, Trnka, Ventrella, Weigel and Olesen2017). The calibration method used in the current study is to try the parameters in their physiological ranges to find the best parameter set manually, which also could be regarded as a ‘trial and error’ method, as many crop models are used. This may cause uncertainty in modelling results due to different users and methods (Confalonieri et al., Reference Confalonieri, Orlando, Paleari, Stella, Gilardelli, Movedi, Pagani, Cappelli, Vertemara, Alberti, Alberti, Atanassiu, Bonaiti, Cappelletti, Ceruti, Confalonieri, Corgatelli, Corti, Dell'Oro, Ghidoni, Lamarta, Maghini, Mambretti, Manchia, Massoni, Mutti, Pariani, Pasini, Pesenti, Pizzamiglio, Ravasio, Rea, Santorsola, Serafini, Slavazza and Acutis2016b). Standard calibration procedures should be developed for RiceGrow in the future.
In conclusion, a new sub-model in RiceGrow was developed in the current study that simulates N uptake and translocation processes in the whole rice plant as well as within plant organs based on Nc, Nmax and Nmin curves of shoot and organs. Overall, results for calibration and validation of the established model showed that the model could simulate the processes of N uptake and translocation well under different N fertilizer treatments. Biomass and N accumulation of the shoot is estimated better than that of organs: in particular, simulation of biomass and N of leaves was relatively poor and should be further evaluated and improved in the future. This improved model works better under excessive N application conditions than the original model, which only simulates shoot N dynamics based on the Nc curve. This improvement would lead to better predictions of N uptake and optimization of N management.
Financial support
This work was supported by the National Key Research and Development Program of China (2016YFD0300110), the National Science Foundation for Distinguished Young Scholars (31725020), the National Science Foundation of China (31571566), the Natural Science Foundation of Jiangsu province (BK20151435), the 111 Project (B16026), and the Priority Academic Program Development of Jiangsu Higher Education Institutions (PAPD).
Conflict of interest
None.
Ethical standards
Not applicable.



