

Introduction
The Solutrean (c. 22–18ka) is the earliest-known period of the European Palaeolithic to yield evidence for the intentional use of heat to treat stone for knapping (Bordes Reference Bordes1967, Reference Bordes1969). Until the recent announcement of heat-treated, coarser-grained silcrete from southern Africa, possibly dating to c. 164ka at Pinnacle Point (Brown et al. Reference Brown, Marean, Herries, Jacobs, Tribolo, Braun, Roberts, Meyer and Bernatchez2009), it was believed to be the oldest culture anywhere in the world that practised heat treatment (Tiffagom Reference Tiffagom1998; Inizan & Tixier Reference Inizan and Tixier2001). Nevertheless, along with the Siberian Dyuktai culture (Flenniken Reference Flenniken1987), the Solutrean appears to have provided some of the earliest examples of heat treatment found among finer-grained rocks such as flint and chert.
Bifacial laurel-leaf points, or feuilles de laurier, are the type-fossil of the Solutrean, and are also the most commonly found artefacts from this period to bear evidence of heat treatment. The production of some of these thin points involved a further step of pressure knapping to refine their shape (Aubry et al. Reference Aubry, Walter, Robin, Plisson and Ben-Habdelhadi1998), thereby requiring a relatively high level of technical skill. The appearance of these objects during the Last Glacial Maximum marks the earliest evidence for the pressure-flaking technique in Europe (Darmark Reference Darmark and Desrosiers2011). Several examples from south-western France (Bordes Reference Bordes1969) and Spain (Tiffagom Reference Tiffagom1998) document thermal treatment as part of the later stages of the chaîne opératoire associated with their production. The benefits (and in some cases, perhaps requirement) of heat alteration of flint for pressure flaking has been detailed by several authors (e.g. Crabtree & Butler Reference Crabtree and Butler1964; Flenniken Reference Flenniken1987; Darmark Reference Darmark and Desrosiers2011). Heat treatment has therefore traditionally been considered as an expression of high technical skill and investment, associated with the production of an elaborate tool kit.
The exceptional degree of technical skill and considerable investment of time and effort given over to Solutrean tool manufacture is apparent in the famous laurel-leaf points of the Volgu cache in eastern France (commonly called ‘feuilles de Volgu’). The points reach up to 350mm in length without exceeding 10mm in thickness, and are among the largest and most skilfully worked of all known Solutrean points. Furthermore, although some of them may have been produced using only direct percussion, others are reported to show traces of pressure flaking (Bordes Reference Bordes1968). This raises the question of whether Solutrean knappers also heat-treated their raw materials to help in the production of these extraordinary tools. If the Volgu points were knapped from heat-treated flint, the overall investment required for their production must have been even greater than previously thought. If they were knapped from unmodified flint, we must rethink the assumed association between pressure flaking and heat treatment in the Solutrean, and adjust our understanding of the role of the latter, considering it either as a technical necessity or as a sophisticated optional approach applied to specific raw materials. In order to answer this question, we present the results of a novel and non-invasive method for detecting past heating events in the fine-grained silica rocks used for the Volgu points curated at the Musée Vivant Denon in Chalon-sur-Saône (France).
Methods and materials
The Volgu points and their origin
The Volgu points were discovered in 1874 during construction work in the hamlet of Volgu, in the commune of Rigny-sur-Arroux, 80km west of Mâcon, France (Chabas Reference Chabas1874). Initially believed to be Neolithic in date (Rutot Reference Rutot1905), they are now widely recognised as belonging to the Solutrean techno-complex, based on the technological and typological affinities of the assemblage established by Abbe Henry Breuil (Reference Breuil1908). They were found beneath approximately 1m of sediment deposited on the east bank of the Arroux River, a tributary of the Loire. The find has been the subject of many publications and theses since its discovery (e.g. Bonnet Reference Bonnet1904; Jost Reference Jost1927; Cabrol Reference Cabrol1940; Armand-Calliat Reference Armand-Calliat1950; Smith Reference Smith1966; Blake Reference Blake2010; Inada Reference Inada2014), most of them concerning the age, the number of points found or the nature of the archaeological context. Today, 13 Volgu points are housed in the Musée Denon in Chalon-sur-Saône (France), one in the British Museum and another in the Musée d'Archéologie nationale in St Germain-en-Laye near Paris. There are also reports of at least one other Volgu point, about two-thirds of which are preserved (Jost Reference Jost1927: fig. 1), but the original number of points may even have been higher: up to 30 pieces are mentioned in some sources (e.g. Cabrol Reference Cabrol1940). Another point, housed in the Muséum d'histoire naturelle in Lyon, was originally believed to belong to the Volgu collection, but has subsequently been identified as Mesoamerican in origin (Masson Reference Masson1984).
The Volgu points were found arranged upright and side-by-side in a manner suggesting that this was an intentional deposit or cache. Such caches are known in larger numbers from the North American Clovis culture (Kilby Reference Kilby, Huckell and Kilby2014a & b), where they have been interpreted as either utilitarian or ritual deposits. Several other Solutrean sites have also been found in the vicinity of Volgu (Peyrouse & Desbrosse Reference Peyrouse and Desbrosse2007; Peyrouse et al. Reference Peyrouse, Aubry, Pelegrin, Desbrosse, Mangado Llach and Walter2013), but none of them show any obvious connection with the cache and the Volgu points.
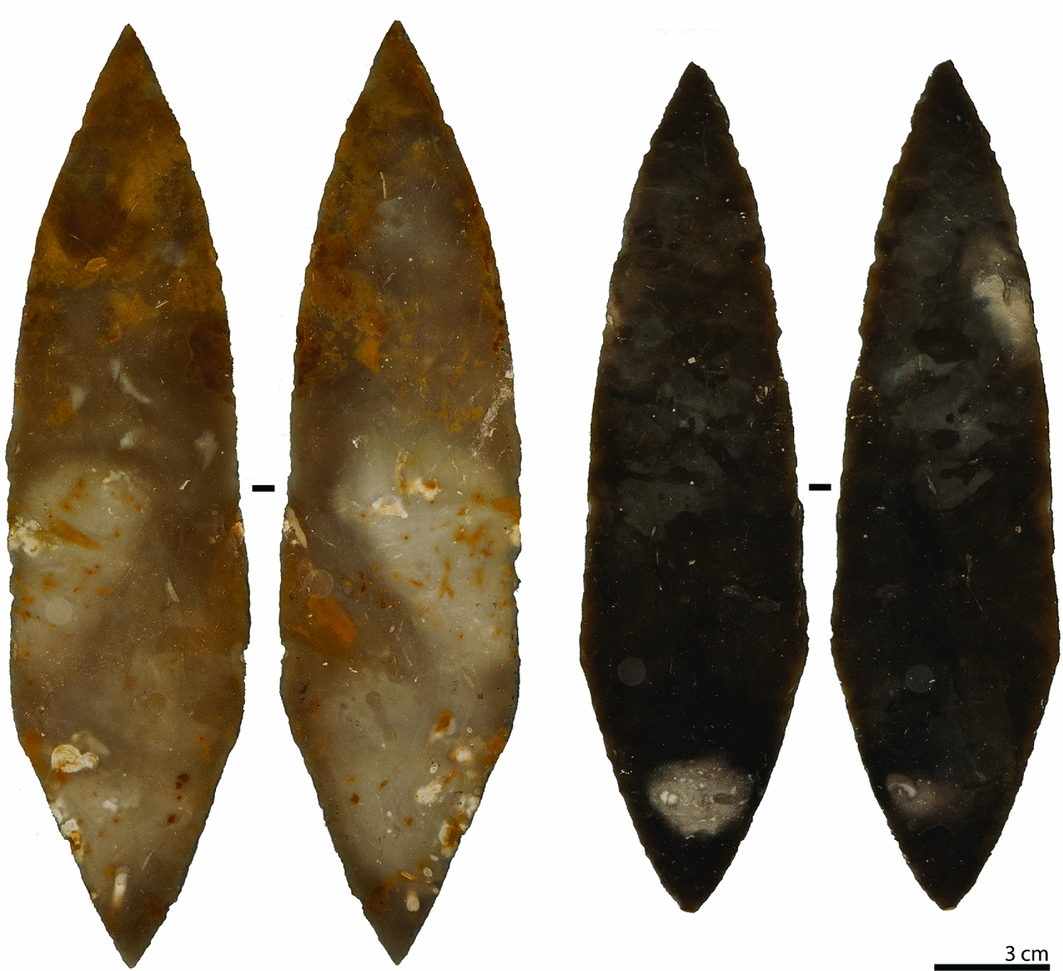
Recently, the points have been the subject of detailed technological studies (Inada Reference Inada2014) and raw material provenance analysis. The sourcing studies sought to embed the Volgu cache within a network of Solutrean migration strategies between the regions around Tours, Gien and the Saône River (Aubry et al. Reference Aubry, Peyrouse and Walter2003; Peyrouse et al. Reference Peyrouse, Aubry, Pelegrin, Desbrosse, Mangado Llach and Walter2013). The 13 points housed in the Musée Denon in Chalon-sur-Saône were made from two types of raw materials, a yellowish, light-brown flint (‘silex blond’) and a darker, grey-black flint. Although other sites from western France have yielded larger laurel-leaf points, the Volgu cache is exceptional for the combination of the size, high quality and preservation of its points (12 of which are still intact). For the present study, we have analysed seven of the Volgu points curated in Chalon-sur-Saône. Of these, five are made of yellowish, light-brown flint, and two from grey-black flint (Figure 1; Table 1).
Photographs of both faces of two of the Volgu points (left: 2011-0-12-4; right: 2011-0-12-5) made from the two raw material classes. The photographs were taken in water so that removal negatives are not visible and that features in the raw materials can be appreciated (photographs by Patrick Schmidt).
Geological samples
To calibrate the method used for detecting heat treatment (Schmidt et al. Reference Schmidt, Léa, Sciau and Fröhlich2013), we collected raw material samples and compared them with the Volgu points. Aubry et al. (Reference Aubry, Peyrouse and Walter2003) previously identified the raw material of the five yellowish, light-brown points as a type of flint from the Lower Turonian chalk layers around Gien, about 150km to the north-west of Volgu (micro-facies group 1; Aubry et al. Reference Aubry, Peyrouse and Walter2003). The provenance of the raw material used for the two grey-black points (microfacies group 3) was not identified with certainty by Aubry et al. (Reference Aubry, Peyrouse and Walter2003), and only the notion that these flints have a similar texture to the others can be found in Aubry et al. (Reference Aubry, Peyrouse and Walter2003). We have recently been made aware of a possible, yet so far unpublished, assignment of one of the Volgu points to another raw material origin in the Cher Valley (also Lower Turonian) (J.-B. Peyrouse pers. comm.). At present, it remains unclear which point this concerns, and because the new data potentially relate to points excluded from our analysis, we would not anticipate major changes to the outcome of the present study. Aubry et al.’s (Reference Aubry, Peyrouse and Walter2003) raw material provenance scheme thus provides the most secure data for our study at this time.
Thierry Aubry (pers. comm.) kindly provided the locus of the group 1 material between the towns of Gien and Briare. During fieldwork at this primary outcrop, we observed two types of flint directly associated with the profile: type 1, a yellowish, light-brown flint; and type 2, a grey-black flint. Parts of flint type 1 macroscopically resemble the raw material used for the five lighter Volgu points, in that they are similar in colour and contain lighter matt parts and micro-fossil inclusions. Although Aubry et al. (Reference Aubry, Peyrouse and Walter2003) distinguished the raw material of the two darker coloured Volgu points from the others, flint type 2 macroscopically resembles them. A detailed micro-palaeontological analysis of these raw materials lies beyond the scope of our study. The results obtained from the two grey-black points are just indications, and their confirmation must await the secure assignment of the origin of the darker raw material. Twenty-seven samples were collected from a primary position reflective of the variability in the macroscopic appearance of the flint from this outcrop. Thirteen were yellowish, light-brown flint, and 14 were grey-black flint. Although no systematic knapping experiments were undertaken, it appeared clearly during collecting and testing these samples (tentatively fracturing the samples with a hammer) that they have excellent properties for knapping.
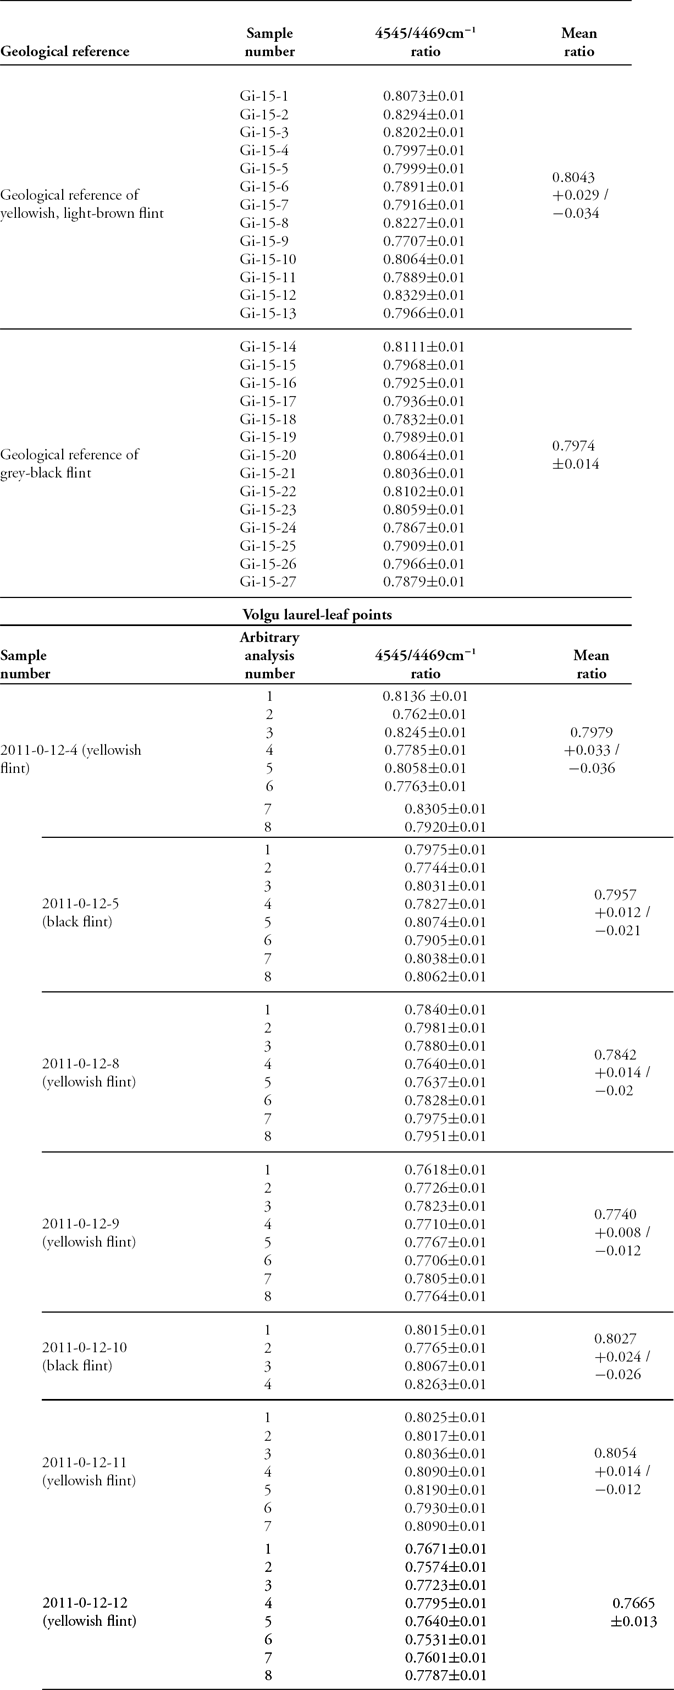
Results of the near-infrared 4545/4469cm−1 ratio of geological reference samples and the seven Volgu laurel-leaf points. The ±0.01 range of single ratio values reflects the measurement error. ‘Mean ratio’ refers to the average of all 4545/4469cm−1 ratio values from within a given group (sample or geological reference samples group). Ranges stated after these mean ratio values were calculated as maximum and minimum extensions of all ratio values used to calculate the mean.

Methods and experimental set-up
All artefacts were first inspected for two proxies of heat treatment: gloss contrast and overall gloss intensity. In the case of the Volgu points, the only two observable proxies would be 1) gloss contrast: the coexistent presence of matt pre- and shinier or glossier post-heating removal scars on one side of an artefact. The presence of such gloss contrast on an artefact is the most secure macroscopic criterion for identifying heat treatment because it unambiguously indicates that the fracture mechanics of the rock were modified between the detachment of the matt and shiny removals. The absence of gloss contrast does not, however, indicate that the material was not heat-treated because knapping or retouch after heat treatment, if invasive, may remove all pre-heating removal scars, leaving behind a homogeneous glossy surface. In such a case, the only macroscopic criterion is 2) overall gloss intensity: the qualitative estimation of the overall magnitude of the surface lustre of all removal scars on an artefact. The identification of weak, intermediate or strong surface gloss on an artefact may permit estimation of whether it was knapped after heat treatment.
The Volgu points were then analysed for evidence of heat treatment using infrared light transmission. Only a brief summary of the method is provided here; further details can be found in Schmidt et al. (Reference Schmidt, Léa, Sciau and Fröhlich2013). The method measures the transmittance of near-infrared radiation through stone, if sufficiently thin. In the case of the Volgu points, which are both thin and made of translucent flint, it is possible to examine almost the entire volume of each point. The non-invasive measurements produce an infrared absorption spectrum in the range of a SiOH combination band (between 4000 and 4800cm−1). The shape of this band is influenced by the quantity of water held in the interconnected open pores of the samples. The reason for this is the chemical interaction (hydrogen bonding) between pore water and surface SiOH on the pore walls. Greater amounts of pore water causes the SiOH band to shift to lower wavenumbers, while less pore water causes a shift to higher wavenumbers (Schmidt et al. Reference Schmidt, Badou and Fröhlich2011). The shape of this absorption band is measured as the ratio between two linear absorbance values at 4545cm−1 and 4469cm−1. The 4545/4469cm−1 ratio is then an indirect measure of the quantity of water held in open pores.
In order to take these measurements, all available pore space is artificially saturated with water. The ratio is then a measure of the total volume of the open pore space of the sample. Such measurements can be used to detect past heating events because pore space is gradually lost when stone such as flint and chert are heat-treated (Roqué-Rosell et al. Reference Roqué-Rosell, Torchy, Roucau, Lea, Colomban, Regert, Binder, Pelegrin and Sciau2010; Schmidt et al. Reference Schmidt, Masse, Laurent, Slodczyk, Le Bourhis, Perrenoud, Livage and Fröhlich2012). Interpretation of the ratio must be made through a direct comparison with a corresponding value obtained from a reference sample of the same material that has not been heated. The two samples compared in this way (the one tested for past heating, and the reference) must undergo an identical protocol that allows the open pore spaces to be totally saturated with deionised or distilled H2O. If a higher value of the 4545/4469cm−1 ratio is found in the tested sample to that of the reference sample, then this indicates that the tested sample was subjected to heating. Thus, this method uses comparative measurements of the open pore space to detect past heating events. It is entirely non-destructive and allows for fast and cost-effective analyses.
To apply this method to the seven selected Volgu points and 27 geological reference samples, each was hydrated in deionised H2O for 72 hours at 20°C and at an ambient pressure to saturate their open pore space with water. Spectra were acquired directly after the points were removed from the water, the surface dried with paper, so that the pore space had no time to dehydrate. Measurements were taken in two stages. The seven artefacts were analysed at the Musée Vivant Denon (Chalon-sur-Saône), and the geological reference samples were analysed in the MONARIS Lab (Paris). The same conditions (temperature and duration of the hydration) were maintained to ensure the comparability of results.
Analytical equipment and experimental error
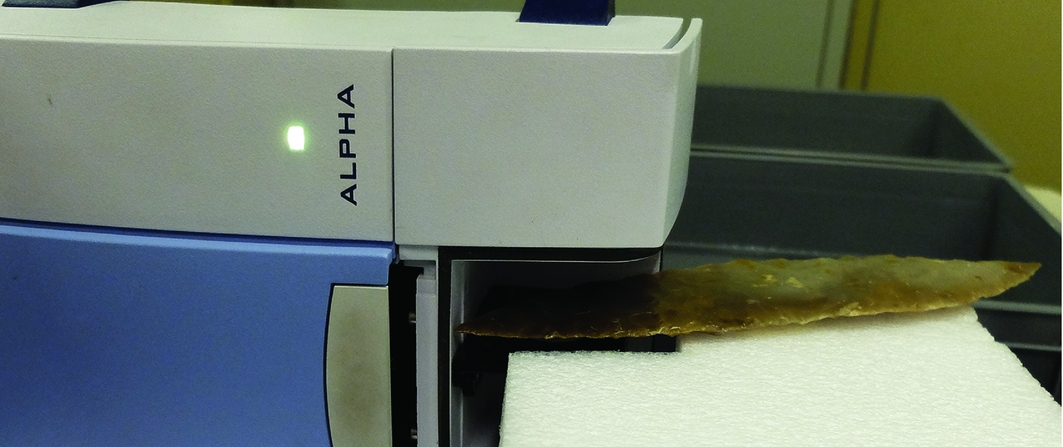
The infrared transmittance was recorded through the samples at normal incidence using the unpolarised light of a portable Bruker ALPHA spectrometer. Spectra were acquired between 4000 and 5000cm−1 with a resolution of 8cm−1. For the measurements, the portable spectrometer was placed on one of its lateral sides so that the entrance to the sample chamber was oriented horizontally. The Volgu points were then placed on a pedestal in front of the spectrometer, with the extremities where the measurements were to be performed pointing into the sample chamber (Figure 2). No other sample preparation was necessary, and the analyses of all archaeological samples were completely non-destructive. For each artefact, several measurements (between 4 and 8, see Table 1) were taken at different locations in order to encompass the possible range of variability within the raw material and to assess the consistency of the results. Experimental errors on the 4545/4469cm−1 ratio were taken from Schmidt et al. (Reference Schmidt, Léa, Sciau and Fröhlich2013) as a fixed ratio value of ±0.01.
Photograph showing the set-up and position of the spectrometer, and the placement of the Volgu points within this arrangement (photograph by Patrick Schmidt).

Results
Description of the artefacts
Six of the analysed pieces are intact laurel-leaf points; the seventh is broken with approximately two-thirds extant. The points are broadly symmetrical along their longitudinal axis and have an elongated and flat sub-oval cross-section. The six intact pieces measure 230–340mm in length, 62–94mm in breadth and 7–12mm at their thickest points. The intact points each weigh 128–181g, and the broken fragment weighs 190g, indicating that it was originally a much larger point. The mostly sub-parallel removal negatives on the Volgu points are indicative of direct soft-hammer percussion (Pelegrin Reference Pelegrin1981), although some of the pieces have been interpreted to show indications of pressure flaking on their distal ends (J. Pelegrin pers. comm.). Negatives on the top and bottom sides of the Volgu points are similarly arranged with no obvious differences between the two faces. Traces of cortex are rare.
Regarding the possible proxies of heat treatment, macroscopic observation of the seven Volgu points in different vertical- and raking-light conditions revealed no indication of gloss contrast. The distal ends of each of the points were examined and also showed no contrast of shininess or light reflectivity. The overall gloss intensity of all seven points resembles that of the 27 raw material samples. On the basis of this assessment, none of the points show any macroscopic signs of heat treatment.
Spectroscopic analysis
Figure 3 shows the transmission spectra recorded from three geological reference samples and two Volgu laurel-leaf points. Figure 4 is a plot of the 4545/4469cm−1 ratio values of the 27 geological reference samples and the seven Volgu points. All plotted values are summarised in Table 1. Yellowish, light-brown flint reference samples produced ratio values between 0.771 and 0.833, setting the range of ratio values of the unheated lighter Turonian flint to between ~0.76 and ~0.84 if the measurement error is taken into account (the larger light-grey bar in Figure 4). Grey-black flint reference samples produced ratio values between 0.783 and 0.811, setting the range of ratio values of the unheated, darker Turonian flint to a narrower range of approximately 0.77–0.82 (the smaller, darker grey bar in Figure 4 and Figure 5).
Near-infrared spectra recorded from the geological reference (bottom three spectra) and two of the Volgu laurel-leaf points (top). The spectra are vertically offset for clarity.

Plot of the values of the 4545/4469cm−1 ratio obtained from the geological reference samples (one measurement per sample) compared with the values of the seven Volgu laurel-leaf points (four, seven or eight measurements per piece). Ratio values of both categories of the unheated geological reference samples (the yellowish, light-brown flint and the grey-black flint) are displayed on the left of the graph. The range of values produced by these unheated samples is marked by grey bars (light grey = range produced by yellowish, light-brown flint, dark grey = range produced by grey-black flint). The values produced by the Volgu points mostly fall within this range, demonstrating that they were not heated.

Plot of the mean values of the 4545/4469cm−1 ratio of geological reference samples and Volgu laurel-leaf points. These mean ratio values are the average values of each sample (for the Volgu points) or group (the yellowish, light-brown flint and the grey-black flint). Error bars for the values mark the minimum and maximum extensions of the ratio values used to calculate the mean. The range of values produced by these unheated samples is marked by grey bars, as in Figure 4, but the bars are smaller because they do not take into account the estimated ±0.01 measurement error. In this plot the Volgu points also fall within this range, demonstrating that they were not heated.

The five yellowish, light-brown Volgu points (2011-0-12-4, -8, -9, -11 and -12) produced ratio values between 0.753 and 0.831, and the two grey-black points (2011-0-12-5 and -10) produced values between 0.774 and 0.826. All archaeological samples thus fall within the range of the unheated reference materials, suggesting that they have not previously been heated. The mean ratio values calculated from the measurements of each sample and reference sample are shown in Figure 4. These values give a narrower range of reference values than those produced by the two groups of geological reference samples because the estimated measurement error is not taken into account. These mean ratios yield the same result: all of the Volgu points fall within the range of the unheated reference samples.
Discussion
In two similar studies, one on heat-treated debitage from the French Neolithic Chassey culture from the site of Saint-Martin (Schmidt et al. Reference Schmidt, Léa, Sciau and Fröhlich2013), and the other on smaller, heat-treated Solutrean laurel-leaf points from the site of Laugerie-Haute (Schmidt & Morala Reference Schmidt and Morala2018), ratio values produced by heat-treated archaeological samples lie above that of their respective reference sample values. The difference between the mean ratios of the unheated reference sample and the heat-treated archaeological material in the Chassey study was 0.078 (Schmidt et al. Reference Schmidt, Léa, Sciau and Fröhlich2013), and 0.05 in the Laugerie-Haute study (recalculated from the data in Schmidt and Morala (Reference Schmidt and Morala2018)). The range of unheated reference values is also comparable in the three studies: Chassey reference values fall within a range of ±0.02 (Schmidt et al. Reference Schmidt, Léa, Sciau and Fröhlich2013), Laugerie-Haute values within ±0.01 (Schmidt & Morala Reference Schmidt and Morala2018) and Volgu reference values within ±0.03. On the basis of the results from Saint-Martin and Laugerie-Haute, it follows that if the Volgu samples were heated, they would give an average ratio value of between approximately 0.05 and approximately 0.08 above the mean of the unheated reference values.
Given the ±0.03 ratio range for our reference samples from the Gien region, it would be possible to detect such a difference because the artefact measurements would fall outside the range of non-heated reference values. Instead, none of the Volgu point measurements plot above the range set by the reference values (Figure 4). Thus, compared with the Saint-Martin and Laugerie-Haute results, which indicate heat treatment, our data clearly show that the Volgu points were made from unheated flint.
A potential source of error that requires consideration may arise from the suitability of our geological reference samples. Aubry et al. (Reference Aubry, Peyrouse and Walter2003) state that the Volgu points were produced using flint from the alteration horizons of the Lower Turonian of the Gien region; this is a secondary geological position. Instead, the flint used for reference in this study was sourced directly from the Lower Turonian chalk layers, a primary position. Weathering of flint-bearing carbonaceous layers (carbonate leaching of the host rock) was reported to alter the crystallography of the included flint through dehydroxylation (Fernandes et al. Reference Fernandes, Morala, Schmidt, Séronie-Vivien and Turq2012). Our archaeometric method is sensitive to the loss of hydroxyl (Schmidt et al. Reference Schmidt, Léa, Sciau and Fröhlich2013), and geological dehydroxylation might result in slightly increased 4545/4469cm−1 ratio values in flint from alteration horizons. In some cases, it may therefore be expected that flint from the latter, when compared with the same flint from the primary position (before alteration), would produce a signal that may be mistaken for modest heat treatment. If such dehydroxylation occurred in the flint, and if artefacts were made from such dehydroxylated flint, when compared with reference material from the primary position that has not been dehydroxylated, two scenarios are possible:
1) If the ratio values of the artefacts plot above the values of the reference samples, the results may not be diagnostic of heat treatment. Higher artefact values might indicate heat treatment. They might, however, also indicate that artefacts knapped from dehydroxylated flint from the secondary position are being compared with reference material from the primary position that is not dehydroxylated.
2) If, however, the artefact ratio values plot in the same range as the reference values, the result is unambiguous, indicating that the artefacts were not heated. If the artefacts were knapped from secondary position flint, and if this flint was subjected to dehydroxylation, the artefact ratio values would plot above those of the reference values. If the artefacts were heated, the artefact ratio values would also plot above the reference values. If this is not the case, then even if artefacts were knapped from secondary position flint, no significant dehydroxylation or heat treatment could have occurred.
Our results correspond to the second scenario, meaning that they unambiguously indicate that the seven analysed Volgu points were not heat-treated. Doubt persists, however, for the two grey-black-coloured artefacts: 2011-0-12-5 and -10. In view of the uncertainty surrounding the provenance of the grey-black raw material, this issue cannot be resolved without further raw material analysis. If, in spite of Aubry et al.’s (Reference Aubry, Peyrouse and Walter2003) assumption to the contrary, these two points correspond to the darker-coloured flint from Gien, our results concerning these two artefacts will be confirmed. If this darker raw material is of a different origin, future studies must produce new suitable reference values. The fact that the ratios of the two grey-black points lie within the range of the lighter-coloured point values indicates a similar microstructure, possibly suggesting that the former of the two hypotheses is more probable. As it stands, there are no indications of heat treatment for these two artefacts.
Implications for the Solutrean
The results of this study suggest that there was no strict association between heat treatment and pressure flaking in the Solutrean. Among the largest and most skilfully crafted laurel-leaf points known today, the Volgu points analysed here were not modified by heat, although some of them did undergo a final manufacturing stage using pressure flaking. These two techniques should therefore be viewed as independent choices and separate technical processes that were applied in specific situations. This finding could be interpreted to contradict previous archaeological and experimental studies (e.g. Crabtree & Butler Reference Crabtree and Butler1964; Darmark Reference Darmark and Desrosiers2011) that have hypothesised a close association of both techniques (although the relation between heat treatment and pressure flaking may not have been so strong in the Solutrean; see, for example, Aubry et al. Reference Aubry, Bradley, Almeida, Walter, Joao Neves, Pelegrin and Tiffagom2008). The raw material used in their manufacture may have been of sufficient quality to allow pressure flaking without the need for heat treatment.
The absence of heat treatment in the production of the Volgu points may be explained by regional differences in technological practice within the Solutrean. Most identifications of heat treatment from this period come from west and south-west France (e.g. Bordes Reference Bordes1969; Aubry et al. Reference Aubry, Walter, Robin, Plisson and Ben-Habdelhadi1998) and the Iberian Peninsula (e.g. Tiffagom Reference Tiffagom1998). There is little published evidence for heat treatment related to specific Solutrean sites, and there may be zones within the spread of the Solutrean techno-complex where heating was more common than others. To answer this question will require a larger-scale systematic study. Finally, the decision to not heat-treat these exceptionally well-crafted points could be due to the risk associated with this process. Knapping such points probably required a considerable investment in time. The application, even of well-controlled heat treatment, might pose considerable risk if the preforms were to overheat or break during the heating process. The high investment necessary for knapping the Volgu points may therefore ultimately be the reason why they were not heated.
What appears certain is that heat treatment was a sophisticated technical solution that was not universally applied to leaf-shaped points in the Solutrean. The results of this study suggest that it was neither explicitly associated with pressure flaking nor with the production of aesthetically or functionally sophisticated pieces. On the current evidence, it seems, rather, to have been a technique specific to the Solutrean in Europe, previously unknown and subsequently forgotten again, and, much like pressure flaking, was used for very particular purposes.
Acknowledgements
We thank the Musée Vivant Denon in Chalon-sur-Saône for providing access to the seven Volgu points and for facilitating our measurements inside the museum, and particularly Gwenaëlle Marchet-Legendre, Catherine Michel and Denis Dubois for greatly aiding our work there. Financial support for P.S. was provided by the Deutsche Forschungsgemeinschaft (DFG) (grant numbers SCHM 3275/2-1 and CO 226/25-1, MI 1748/2-1, NI 299/25-1). We also thank T. Aubry for his help with locating a suitable raw material outcrop for this study.