





1. Introduction
The acoustic radiation force associated with high-intensity sound waves can levitate a liquid droplet in the air. The phenomenon, termed acoustic levitation, is one of the promising methods for contactless transportation, deformation and breakup of liquid droplets. Several designs of acoustic levitators have been proposed, including acoustic vortex fields (Hong et al. Reference Hong, Yin, Zhai, Yan, Wang, Zhang and Drinkwater2017), that could levitate a wide range of liquid or solid objects. The levitation of a droplet by sound waves finds several important applications in the fields of material science (Andrade, Marzo & Adamowski Reference Andrade, Marzo and Adamowski2020a; Andrade et al. Reference Andrade, Ramos, Adamowski and Marzo2020b), biology (Akkoyun, Gucluer & Ozcelik Reference Akkoyun, Gucluer and Ozcelik2021) and analytical chemistry (Bayazitoglu & Mitchell Reference Bayazitoglu and Mitchell1995). Acoustic levitation has emerged as an important alternative to electrodynamic levitation (Singh et al. Reference Singh, Mayya, Gaware and Thaokar2017), laser tweezers (König Reference König2000), magnetic tweezers (Yan, Skoko & Marko Reference Yan, Skoko and Marko2004; Durmus et al. Reference Durmus, Tekin, Guven, Sridhar, Arslan Yildiz, Calibasi, Ghiran, Davis, Steinmetz and Demirci2015) and aerodynamic levitation (Hervieu, Coutris & Boichon Reference Hervieu, Coutris and Boichon2001; Arai et al. Reference Arai, Paradis, Aoyama, Ishikawa and Yoda2003), especially to levitate millimetre-sized particles.
Apart from levitation, the fragmentation of a liquid droplet due to a variety of external fields such as the gravitational fall of naturally occurring raindrops (Villermaux & Bossa Reference Villermaux and Bossa2009), airflow (Kirar et al. Reference Kirar, Soni, Kolhe and Sahu2022) or impaction with solid surfaces (Lohse & Villermaux Reference Lohse and Villermaux2020; Villermaux & Bossa Reference Villermaux and Bossa2011) or electric fields (Karyappa, Deshmukh & Thaokar Reference Karyappa, Deshmukh and Thaokar2014) etc., has relevance in important applications such as internal combustion engines (Lefebvre & McDonell Reference Lefebvre and McDonell2017), aircraft engines (Ju et al. Reference Ju, Sun, Jia, Huang, Qiao, Han and Huang2017), cooling (Breitenbach, Roisman & Tropea Reference Breitenbach, Roisman and Tropea2018), agricultural spray (Law Reference Law2001), inkjet printing (El-Molla Reference El-Molla2017), pharmaceutical and medical devices (Naidu, Kahraman & Feng Reference Naidu, Kahraman and Feng2022) etc.
An acoustically levitated liquid droplet can exhibit a variety of phenomena, including centre of mass motion around a mean levitated position, deformation and fragmentation. Geng et al. (Reference Geng, Xie, Yan and Wei2014) reported good agreement between experiments and theory for the vertical harmonic vibrations of a droplet levitated in an acoustic field. The vibration frequency was found to vary with changes in the shape of the levitated droplet. A levitated droplet is known to exhibit a variety of dynamical shape deformations depending on its size and ambient conditions. Such a droplet is almost spherical at low sound intensities but is gradually flattened into an oblate spheroidal shape at moderate sound intensities (Andrade & Marzo Reference Andrade and Marzo2019). The deformation dynamics of such an acoustically levitated droplet depends upon the relative interplay of the acoustic pressure and the capillary forces at the liquid–air interface.
The acoustically levitated and stretched droplet can eventually undergo breakup when the inertial and pressure forces overcome the capillary forces. Aoki & Hasegawa (Reference Aoki and Hasegawa2020) experimentally investigated the dynamics of acoustically levitated droplets composed of a mixture of water and ethanol. The critical acoustic pressure  $P_{max}$ below which stable, deformed, levitated droplets were realised and above which droplet breakup can be observed, was suggested to be
 \begin{equation} P_{max}=\sqrt{\sigma \rho_a c_0^2 \left(\frac{3.2}{d}-\frac{1.3{\rm \pi}}{\lambda}\right)}, \end{equation}
where  $\sigma$,
 $\rho _a$,
 $c_0$,
 $d$ and
 $\lambda$ are surface tension, air density, sound speed, droplet diameter and sound wave wavelength, respectively. The typical values of the wavelength of sound in their work were
 $\lambda = c_0/f= 8.5\,{\rm mm}$ for
 $c_0 = 340\,{\rm m}\,{\rm s}^{-1}$ and
 $f = 40\,{\rm kHz}$, which for their (Aoki & Hasegawa Reference Aoki and Hasegawa2020) system, for
 $d=1.702\,{\rm mm}$ and
 $\sigma = 72\,{\rm mN}\,{\rm m}^{-1}$, yields 2400 Pa. According to (1.1), the susceptibility of a levitated droplet to atomisation increases as the liquid's surface tension decreases and the intensity of sound pressure increases. Andrade & Marzo (Reference Andrade and Marzo2019), in their numerical study, observed that a levitated water droplet deformed into a stable pancake-shaped configuration when the separation distance between the emitter and reflector was higher than the resonance separation, while it disintegrated otherwise. More recently, the atomisation of acoustically levitated droplets was observed (Andrade & Marzo Reference Andrade and Marzo2019; Aoki & Hasegawa Reference Aoki and Hasegawa2020; Naka & Hasegawa Reference Naka and Hasegawa2020) and the atomisation process was reported to include flattening of the droplet into a pancake shape, development of capillary waves and splitting of the droplet into a large number of smaller droplets (Andrade & Marzo Reference Andrade and Marzo2019; Aoki & Hasegawa Reference Aoki and Hasegawa2020; Naka & Hasegawa Reference Naka and Hasegawa2020). The rapid deformation of the droplet was suggested to be due to the Kelvin–Helmholtz (KH) instability, which creates interfacial deformation (Naka & Hasegawa Reference Naka and Hasegawa2020). The measured velocity of the interface before atomisation and the critical velocity from the KH instability were compared by Naka & Hasegawa (Reference Naka and Hasegawa2020). They reported an excellent match between the experimental and the theoretical velocity, whereby the atomisation was attributed to the KH instability in the interfacial region of the droplet.
Acoustically levitated droplets have been employed to discover and investigate different types of phenomena with potential technological implications. For example, Kumar et al. (Reference Kumar, Tijerino, Saha and Basu2010) studied the vaporisation of an acoustically levitated droplet of an aqueous suspension of nano-silica, by heating the droplet with a laser. They observed a bowl and ring shape of the droplet during evaporation in the acoustic field. Further, Basu, Saha & Kumar (Reference Basu, Saha and Kumar2012) investigated the atomisation of acoustically levitated fuel droplets by external heating. They reported that the onset of the KH instability at the droplet's edge induces droplet atomisation. The small-scale atomisation for diesel, kerosene and bio-diesel was attributed to their higher surface temperature. Ethanol droplets were found to be more stable because of the smaller surface temperature on account of higher vapour pressure and latent heat of vaporisation. In another study, it was observed that viscous droplets levitated in acoustic fields and, locally heated using a laser, break into smaller droplets due to cavitation of a bubble inside the droplet (Zeng et al. Reference Zeng, Gonzalez-Avila, Ten Voorde and Ohl2018). The breakup here was suggested to be due to the radial acceleration of the droplet that arises due to the oscillation and expansion of the bubble inside the droplet.
The above-discussed studies on the breakup of acoustically levitated droplets describe the deformation of the droplet into a thin liquid sheet before the onset of atomisation. However, the events leading to the atomisation of such an acoustically levitated droplet are not very well investigated in the literature. On the other hand, extensive studies have been reported for breakup of liquid sheets produced by a liquid jet impacting on a solid circular surface (Clanet & Villermaux Reference Clanet and Villermaux2002; Villermaux & Clanet Reference Villermaux and Clanet2002; Bremond, Clanet & Villermaux Reference Bremond, Clanet and Villermaux2007), breakup of a sheet produced by two co-linear jets (Mulmule, Tirumkudulu & Ramamurthi Reference Mulmule, Tirumkudulu and Ramamurthi2010), breakup due to oblique impingement of two liquid jets (Dighe & Gadgil Reference Dighe and Gadgil2019) and droplets impacting on solid surfaces (Villermaux & Bossa Reference Villermaux and Bossa2011; Josserand & Thoroddsen Reference Josserand and Thoroddsen2016; Lohse & Villermaux Reference Lohse and Villermaux2020). We next discuss the breakup mechanisms suggested in these studies.
A liquid jet impacting on a solid circular surface generates a circular liquid sheet of varying thickness in the radial direction. The liquid sheet eventually becomes unstable and disintegrates at the edge (Clanet & Villermaux Reference Clanet and Villermaux2002; Villermaux & Clanet Reference Villermaux and Clanet2002). The liquid sheet breakup mechanism is classified in two regimes depending on the Weber number  $We_L= {\rho _L U_{L}^2 d_j}/{\sigma }$, where
 $U_L$,
 $d_j$ and
 $\sigma$ are the jet velocity, jet diameter and surface tension of the liquid, respectively. The liquid sheet is considered to be in a smooth regime for
 $We_L < We_{Lc}$ and flapping regime for
 $We_L > We_{Lc}$, where
 $We_{Lc}$ is the critical Weber number, of the order of
 $10^3$. In the smooth regime, there is no surface instability, and the liquid velocity of the sheet remains constant up to the sheet edge, where a rim is formed. The sheet atomises at the edge on account of the Rayleigh–Plateau (RP) instability of the rim. Cusp formation could also be seen, wherein the droplet ejection occurs when the centrifugal acceleration dominates over the capillary action (Clanet & Villermaux Reference Clanet and Villermaux2002) as the droplets move along the cusp region. At higher
 $We$, in the flapping regime, the KH instability is known to develop because of the relative motion of the liquid in the liquid sheet and the surrounding air, which causes a flag-like motion (sinuous mode). The sinusoidal KH instability generates radial acceleration–deceleration at the edge of the sheet (rim), which triggers the Rayleigh–Taylor (RT) instability and results in the disintegration of the edge (Villermaux & Clanet Reference Villermaux and Clanet2002), often resulting in the formation of ligaments which thereafter undergo a RP instability.
The effect of the acoustic field on the atomisation characteristics of a liquid sheet generated by two co-linear jets was investigated by Mulmule et al. (Reference Mulmule, Tirumkudulu and Ramamurthi2010). An acoustic speaker, which was capable of delivering a range of sound frequencies, was located normal to the sheet. Surface ripples were seen to travel toward the edge of the sheet when the speaker was switched on. Hole formation in the sheet was also observed, which resulted in the reduction in the sheet diameter. Both the dilatation and sinuous modes of the KH instability were shown to couple at the lowest order under acoustic forcing and the growth rate of the dilatation mode was shown to be no longer negligible. In a similar study (Dighe & Gadgil Reference Dighe and Gadgil2019), the variation of liquid sheet thickness was found to play an important role in different instability characteristics. It was observed that, for a fixed Weber number, while the aerodynamic effect dominated for smaller acoustic frequencies the thinning effect was shown to be important at a higher frequency. Fang et al. (Reference Fang, Wang, Jia, Yang, Fu, Sun and Sun2022) and Jia et al. (Reference Jia, Wang, Fu and Yang2022) numerically investigated the instability of a liquid sheet under the influence of an acoustic field. The acoustic field was applied from both sides as well as perpendicular to the liquid sheet. They predicted that the unstable region is affected by the surface tension, viscosity and densities of the liquid and air as well as the amplitude of the acoustic field. The instability was suggested to be due to the combined effect of KH waves and parametric oscillation. At lower acoustic accelerations, the sub-harmonic oscillations were shown to change to harmonic oscillations with an increase in  $We$ due to the suppression of parametric oscillation while the parametric instability was found to overcome the KH instability at higher acoustic acceleration.
Unlike steady liquid sheets formed from a source of fluid such as collinear jets, which exhibit time-invariant thickness of the liquid sheets, those formed from flattened liquid droplets, including acoustically levitated flattened droplets, show liquid sheets that are inherently unsteady before they undergo breakup. While there are few similarities between the instabilities in liquid sheets and flattened liquid droplets, a liquid droplet, in particular, can atomise by a specific mode of breakup, termed the bag breakup mode in the literature, and is observed in several situations, such as a droplet falling freely in the air (Villermaux & Bossa Reference Villermaux and Bossa2009), a droplet exposed to a continuous horizontal jet (Kulkarni & Sojka Reference Kulkarni and Sojka2014) and a droplet exposed in swirling airflow (Kirar et al. Reference Kirar, Soni, Kolhe and Sahu2022) without any equatorial atomisation. A freely falling droplet, for example, undergoes flattening followed by bag formation because of a radial pressure gradient along the droplet surface. The temporal dependence of the radius of the stretched, pancake-like droplet and the subsequent bag growth is reported to be exponential (Kulkarni & Sojka Reference Kulkarni and Sojka2014). Kirar et al. (Reference Kirar, Soni, Kolhe and Sahu2022) observed ‘retracting bag breakup’ for a droplet subjected to a swirling airflow. The interfacial instability of the drop was suggested to be because of the RT mechanism.
While there have been several studies on acoustic droplet levitation, deformation and atomisation, the present work presents a comprehensive experimental investigation into a variety of aspects of the fate of a liquid droplet levitated at the node of a standing acoustic wave in an acoustic levitator. Specifically, this work addresses levitation, droplet stretching, droplet thinning, primary atomisation and various modes of secondary atomisation of a liquid droplet levitated in an acoustic levitator. The physics of these phenomena is discussed deriving from literature studies as well as our own analysis, and several instabilities, including the KH, Faraday, RP and RT instabilities, are observed and identified in experiments, discussed and comparisons made with respective theories. The work demonstrates myriad complex, nonlinear, coexisting phenomena that render a single droplet into multiple atomised droplets.
2. Experimental details
2.1. Experimental set-up
A picture of the experimental arrangement is shown in figure 1. The experimental set-up included an acoustic levitation system TinyLev, purchased from DigiKey and assembled in house, a fibre optics light source (Nikon, model: C-FI230), a high-speed camera (Vision Research, Phantom v12) and a computer. The images were captured using a high-speed camera at a fixed time interval and recorded on a computer. To capture top-view images, another high-speed camera Phantom VEO 710 was used. This camera was placed at 60 degrees to the vertical to enable proper visualisation.
Photograph of the experimental set-up.

The TinyLev acoustic levitator was assembled in accordance with the guidelines provided in Marzo, Barnes & Drinkwater (Reference Marzo, Barnes and Drinkwater2017). It was made using two spherical cups of 4.5 cm, which were vertically placed at a centre-to-centre distance of 9 cm. The acoustic levitator consisted of 72 transducers, Arduino nano and a Dual H-Bridge motor driver. Each spherical cap had 36 transducers, (Murata Electronics, MA40S4S) to transform the electrical input into acoustic waves. Arduino Nano was used to generate a high-speed square wave signal. The acoustic pressure level of each transducer was 120 dB (20 Pa). The operational frequency of the transducer was equal to 40k Hz. The corresponding wavelength of acoustic wave at  $25\,^{\circ }{\rm C}$ was estimated as 8.5 mm.
The droplet images were recorded with the camera focused on a certain region of the droplet undergoing breakup, to visualise and ascertain a specific type of interfacial instability. The captured images were analysed using the Image J software. The maximum pressure (pressure at anti-node) was estimated as 2400 Pa using COMSOL multiphysics simulations (see the Appendix for more details). This maximum pressure calculated by the simulation agrees closely with the pressure given by Marzo et al. (Reference Marzo, Barnes and Drinkwater2017) for a similar acoustic levitator.
2.2. Materials and method
The fluid properties of the droplet strongly influence the dynamics of an acoustically levitated droplet. The liquid droplet considered in this study was a mixture of 90 % ethanol and 10 % water. Before the experiment, the mixture was stirred continuously in an ultrasonic bath for 30 min to ensure proper mixing. The ethanol–water mixture was stored in a sealed bottle. The total time between injecting the droplet into the levitator and its atomisation was less than 20 ms. Therefore, it was presumed that there would be no significant evaporation during the course of the experiments. The surface tension and density of this mixture are  $22 \,{\rm mN}\,{\rm m}^{-1}$ and
 $830\,{\rm kg}\,{\rm m}^{-3}$, respectively.
In any typical experiment, a pendant liquid drop was created at the end of a syringe, outside the acoustic levitator, and was then slowly positioned, although manually, at the node of the sound waves in the acoustic levitator. The position of the node was known to the authors, by experience. The droplet then got separated from the syringe by the action of the acoustic field (the separated droplet can be clearly seen in the side view of movies provided in the supplementary information (SI) available at https://doi.org/10.1017/jfm.2024.523). The droplet then underwent deformation followed by atomisation on a time scale of a few milliseconds. Therefore, the imaging was conducted at a frame rate of 4000 to 140 000 fps. The initial diameter of the droplet was varied from 1.1 to 2.4 mm. The droplet deformed into an oblate shape just after its introduction at the node of the levitator (see side-view movies in the SI). The diameter of the droplet was therefore estimated using  $d_{0} = (a^2b)^{1/3}$. Here,
 $a$ and
 $b$ are the lengths of the major and minor axes of the flattened oblate droplet and in this work, we term
 $R$ with
 $a=2 R$ as the radius, and
 $b=h$ as the thickness of the flattened droplet. Readers are advised to see the SI for additional information about the experiments.
3. Results
We present the experimental observations in this section, followed by a discussion on possible mechanisms for these observations in the next section. A liquid droplet can be levitated in an acoustic levitator when the size of the droplet is less than half the acoustic wavelength (Marzo et al. Reference Marzo, Barnes and Drinkwater2017). Since the acoustic wavelength is 8.5 mm in our set-up, the upper limit of the size of the water droplet that can levitate in the levitator, used in the present study, equals  $2R= 4.15$ mm and
 $h = 2$ mm (corresponding to
 $d_{0}= 3.25$ mm) with possible error of
 ${\pm } 5\,\%$ in measurement. Experimental observations are presented in this work on stable and unstable, levitated droplets, where a ‘stable droplet’ (see figure 2a) and an ‘unstable droplet’ (see figure 2b) refer to a levitated droplet that either does not (low Weber number) or does (higher
 $We$) admit atomisation, respectively. Here, the acoustic Weber number is defined as
 $We = {\rho _a U^2 d_0}/{\sigma }$, where
 $\rho _a$, U,
 $\sigma$ are the density of air, average air acoustic velocity and surface tension of the liquid, respectively. Note that the velocity
 $U=({P_0}/{\rho _a c_0})({1}/{\sqrt {2}})\sim 4.09\,{\rm m}\,{\rm s}^{-1}$ ((A6) in Appendix A.1) assuming
 $P_0 \sim 2400\,{\rm Pa}$ (see Appendix A.4), and
 $\rho _a$ and
 $c_0$ are of the order
 $1.22\,{\rm kg}\,{\rm m}^{-3}$ and
 $340\,{\rm m}\,{\rm s}^{-1}$, respectively. In this work,
 $d_{0}$ is varied to change
 $We$ while other parameters are kept constant. The results are presented for droplets formed out of a mixture of 90 % ethanol and 10 % water. The
 $We$ value in figure 2(a) was altered in the experiments by varying the surface tension and density by changing the concentration of ethanol in water.
Stable levitation: (a) variation of the non-dimensional diameter  $2R/d_0$ of the flattened droplet, that does not undergo atomisation, as a function of
 $We$. Unstable levitation: (b,c) temporal evolution of different regimes exhibited by a single levitated droplet undergoing breakup and atomisation by bag formation (b) variation of the dimensional stretch diameter
 $2R$ of the flattened drop, as a function of time for
 $We = 1.45$. The corresponding side-view images of the droplet, as grabbed from the video, are marked on the plot appropriately. The corresponding images in the top view are shown in (c)
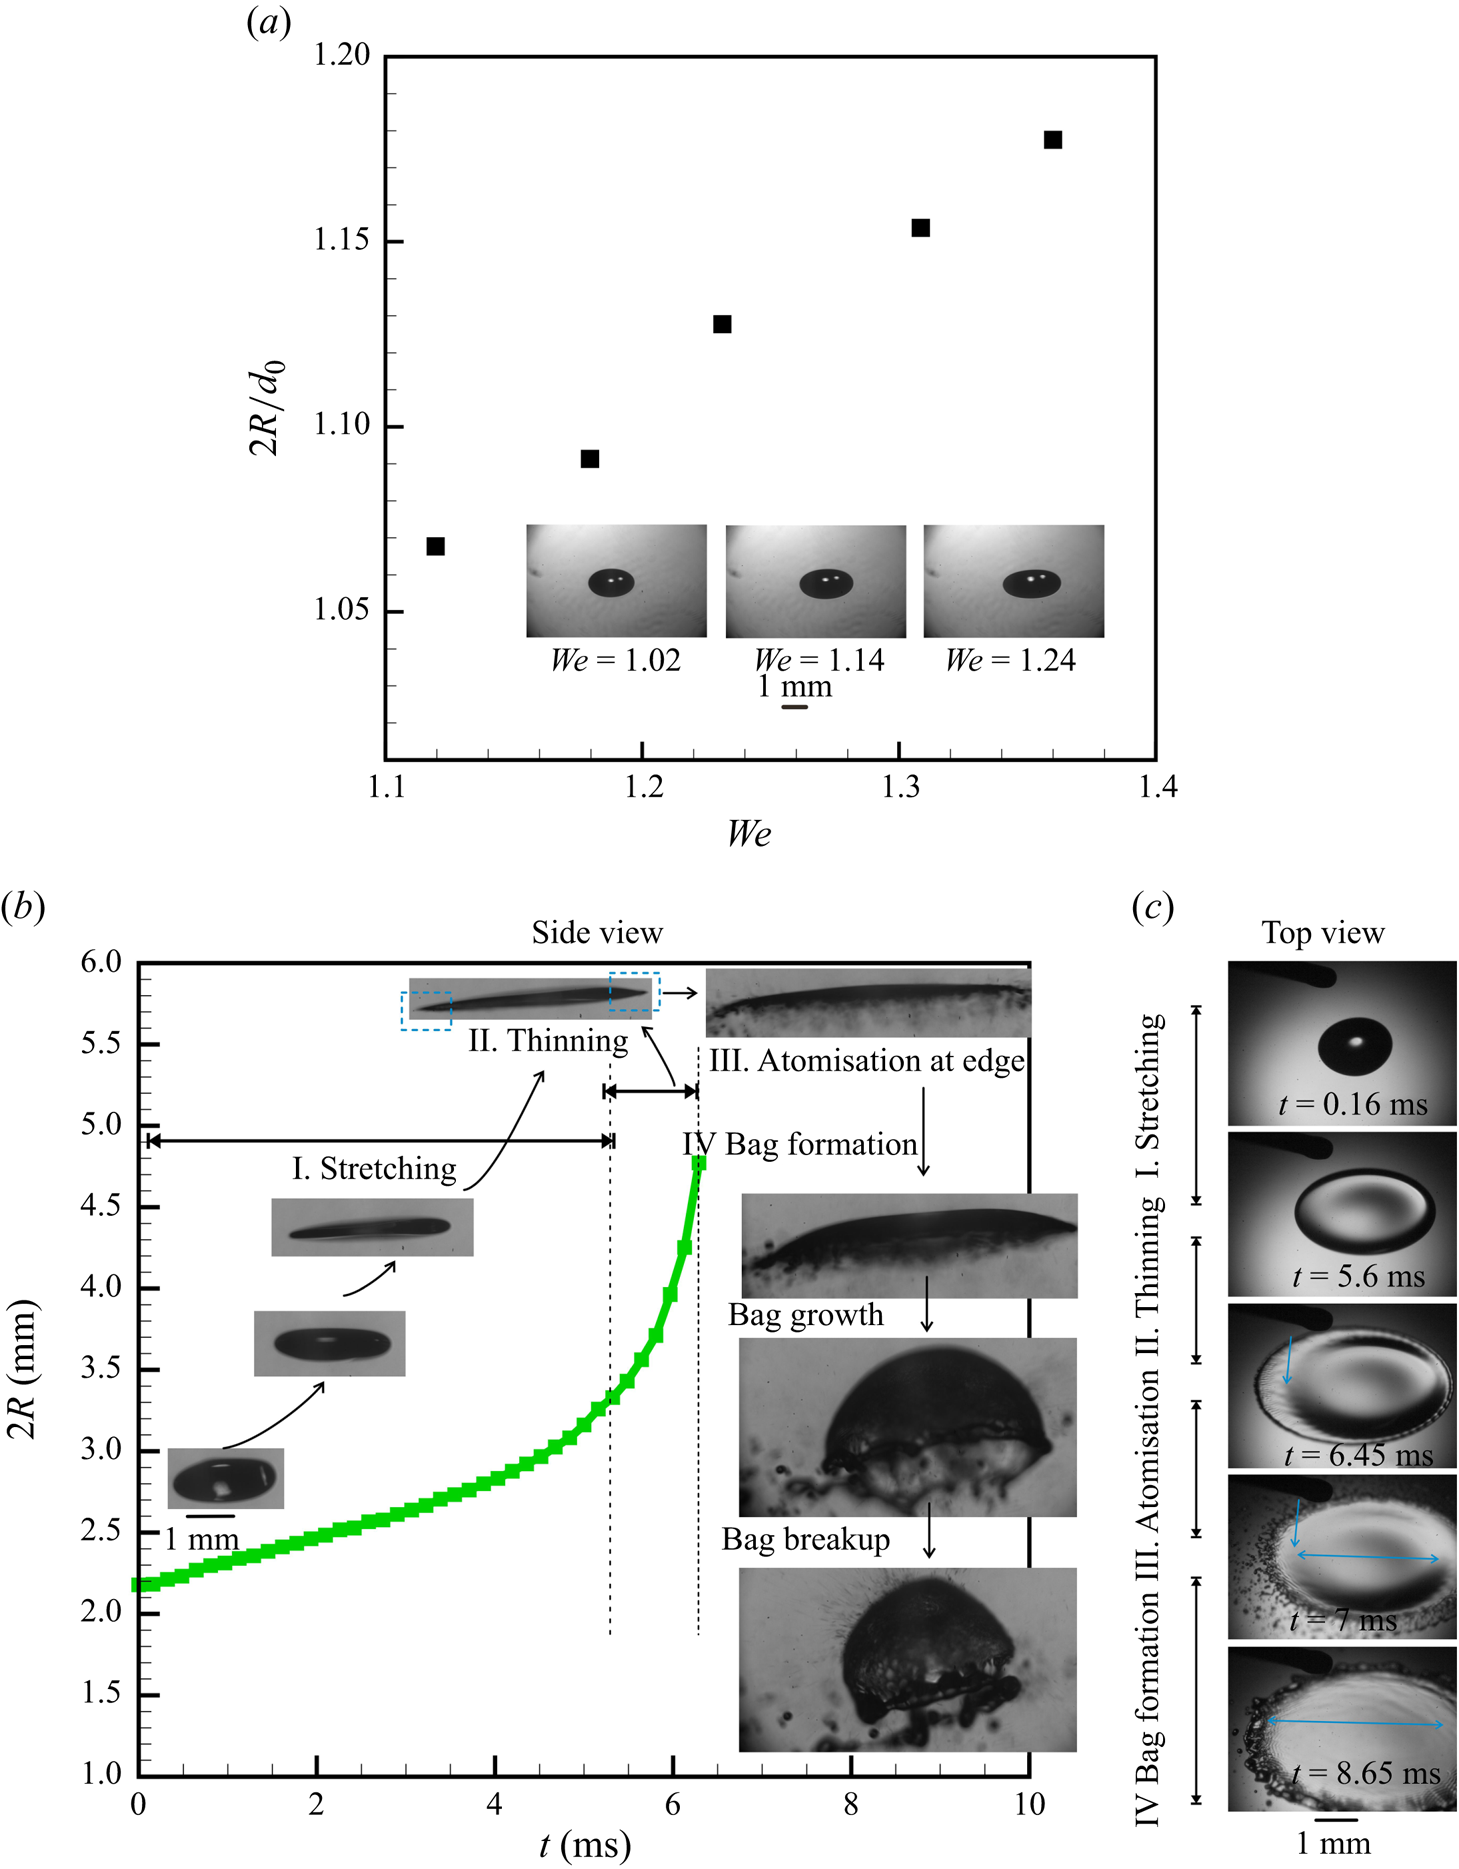
The various phenomena observed during the radial expansion of a droplet with time, when introduced into an acoustic field, are classified into different regimes, as illustrated in figure 2(b), by plotting the radius of the flattened droplet  $R$ with time. The corresponding top-view images are shown in figure 2(c) for more clarity. Droplet flattening occurs when an injected droplet is levitated at the node of a standing wave. The droplet first transforms from a spherical shape to a flattened disc shape, termed here as the stretching regime. This is followed by the thinning of the edge region (equatorial region of the droplet) to form a membrane-like sheet at the edge of the flattened drop and is termed the thinning regime. Atomisation at the edge refers to the disintegration of the membrane-like sheet at the edge of the flattened droplet. The droplet, which is flattened like a sheet at the end of the edge atomisation stage, shows convex deformation on the length scale of this sheet while admitting simultaneous deceleration. Thereafter, the convexly deformed sheet can break in 4 different ways: umbrella breakup, bag breakup, bubble breakup and multi-stage breakup (also see figure 9 for a gallery of a sequence of images exhibiting regimes of deformation for a droplet that ultimately undergoes different regimes of breakup).
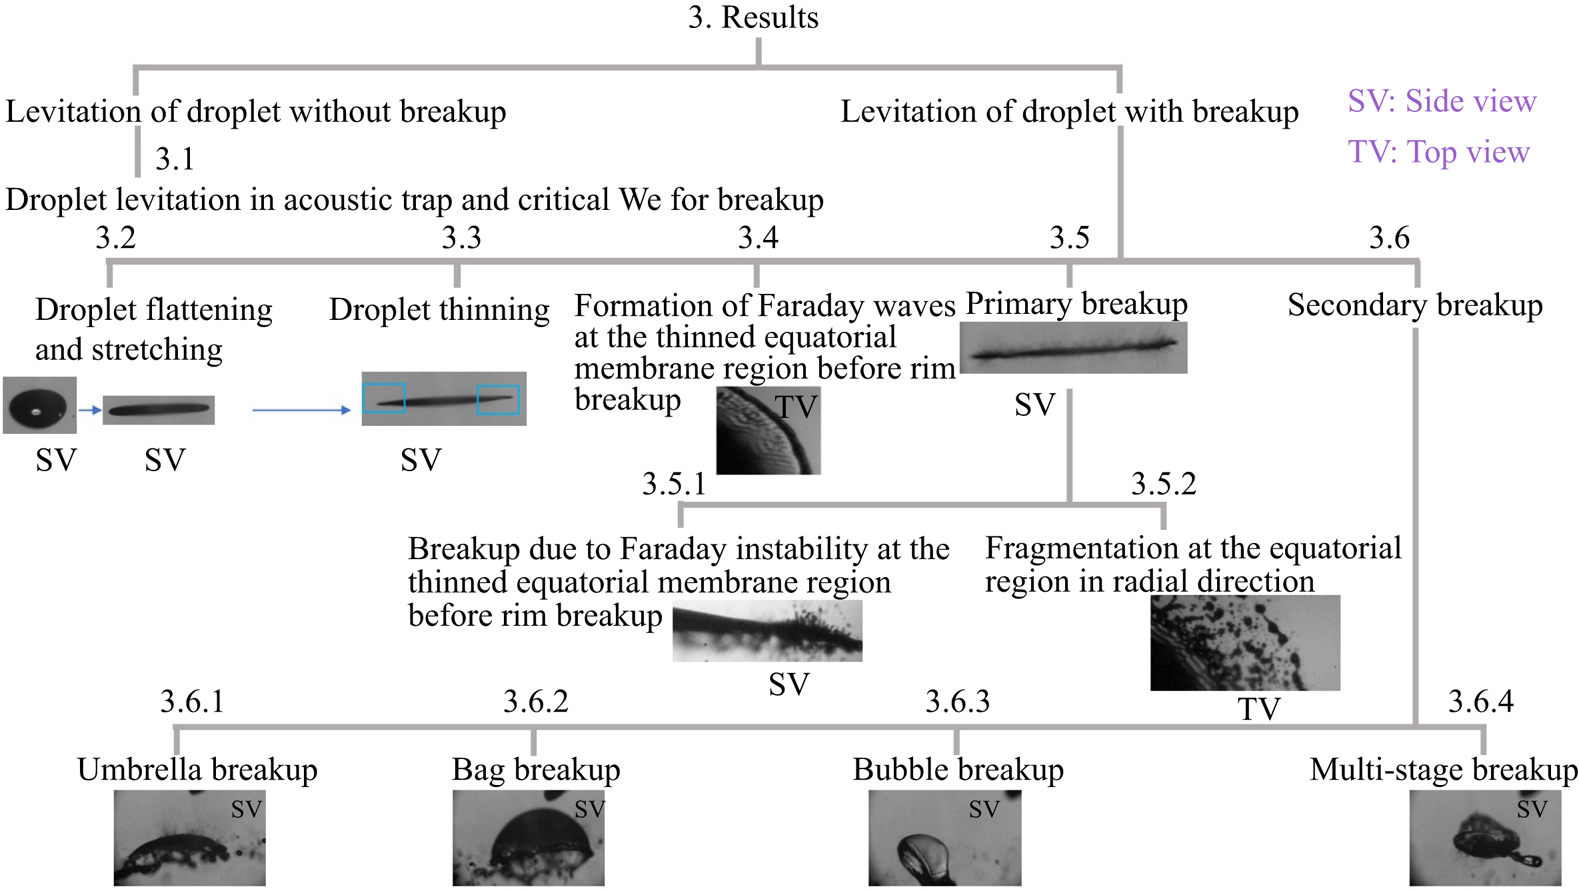
In the following subsections, we detail the observations made at different stages of complete atomisation: from the time a droplet is introduced in an acoustic levitator to the point where it undergoes complete shattering and disintegration (also see the SI for corresponding top- and side-view images). Figure 3 summarises the order in which the myriad observations in the system are presented in this section.
A schematic of the organisation of experimental observations presented in § 3.
3.1. Droplet levitation in acoustic levitator and critical  $We$ for breakup

A droplet, when injected at the node of a standing wave in an acoustic levitator, does centre-of-mass as well as shape oscillations. At low  $We$, it reaches an equilibrium position (node of the acoustic field) and attains a steady shape (oblate, spheroid) (see figure 2a), wherein the capillary and acoustic forces balance each other. The steady deformation of a levitated droplet placed in an acoustic standing wave, as seen in experiments, scales as
 $2 R/d_o \sim We^{1/2}$. Our experiments show a critical
 $We\sim 1.36$, beyond which the droplet cannot attain a steady state, and undergoes continued elongation with time, ultimately leading to its breakup (the SI contains a detailed discussion).
3.2. Droplet flattening and stretching
The droplet, beyond the critical  $We>1.36$, can no longer admit a steady shape. When introduced into the levitator, the droplet shape evolves in time, exhibiting transformation into a deformed oblate spheroid, followed by an increasingly flattened oblate shape wherein its radius
 $R$ increases with time, resulting in the formation of a pancake-like shape. The imaging is conducted at 6200 fps. The radial velocity (
 $U_L$) is determined by extracting the images frame by frame at fixed intervals of time by focusing on the rim (edge of droplet) during deformation. The corresponding change in
 $U_L(t)$ as a function of
 $2R(t)$ is shown in figure 4(a). The data are produced from figure S3 in the SI. The radial acceleration
 $a_r(t)$ is determined by the change in
 $U_L(t)$ with time (figure 4a). The range of
 $U_L$ is approximately of the same order for all
 $We$ in the stretching regime.
(a) Instantaneous radial velocity ( $U_L$) for a droplet in the stretching–thinning regime as a function of the instantaneous size of the flattened droplet,
 $2R$, at different
 $We$ corresponding to figure S3(b,c), provided in the SI. (b) The corresponding radial acceleration (
 $a_r$) as a function of time. The error in measurement varied from 5 % to 8 %. The velocity was calculated at the edge (liquid–air interface) of the droplet by extracting images frame by frame from the video of the side view, recorded at 6200 fps.

Thereafter the thinning regime commences and the onset of the thinning regime can be easily seen in the plot of radial acceleration of the sheet  $a_r$ vs
 $t$ (figure 4b). The thinning is seen to be initiated earlier (shorter times) at higher
 $We$.
3.3. Droplet thinning
The stretching of the droplet in the stretching regime leads to nonlinear changes in the disturbance acoustic field, thereby leading to a nonlinear increase in acoustic forces that deform the sheet. The increased stretching force results in a reduction in thickness of the sheet at the edge (periphery, equatorial region), that leads to a thin, membrane-like region at the equator. Figure 5 shows the velocity of the liquid–air front  $U_L$ at the equatorial region during radial expansion of the droplet as observed in experiments. Unlike figure 4(a), the velocity in this figure 5 is reported starting 1.62 ms before the atomisation commences, giving a better glimpse into the thinning regime, with the images captured at 11 000 fps. The radial velocity variation with time shows a small part of the stretching regime followed by a clear transition to the thinning regime.
The radial velocity ( $U_L$) of the radially expanding droplet before initiation of breakup. Note: the images are recorded at 11 000 fps with the camera focusing on the equatorial region of the droplet. Here,
 $U_L$ is calculated for the 1.62 ms before initiation of breakup which covers both the stretching as well as the thinning regime (
 $We$ between 1.56 and 1.9).

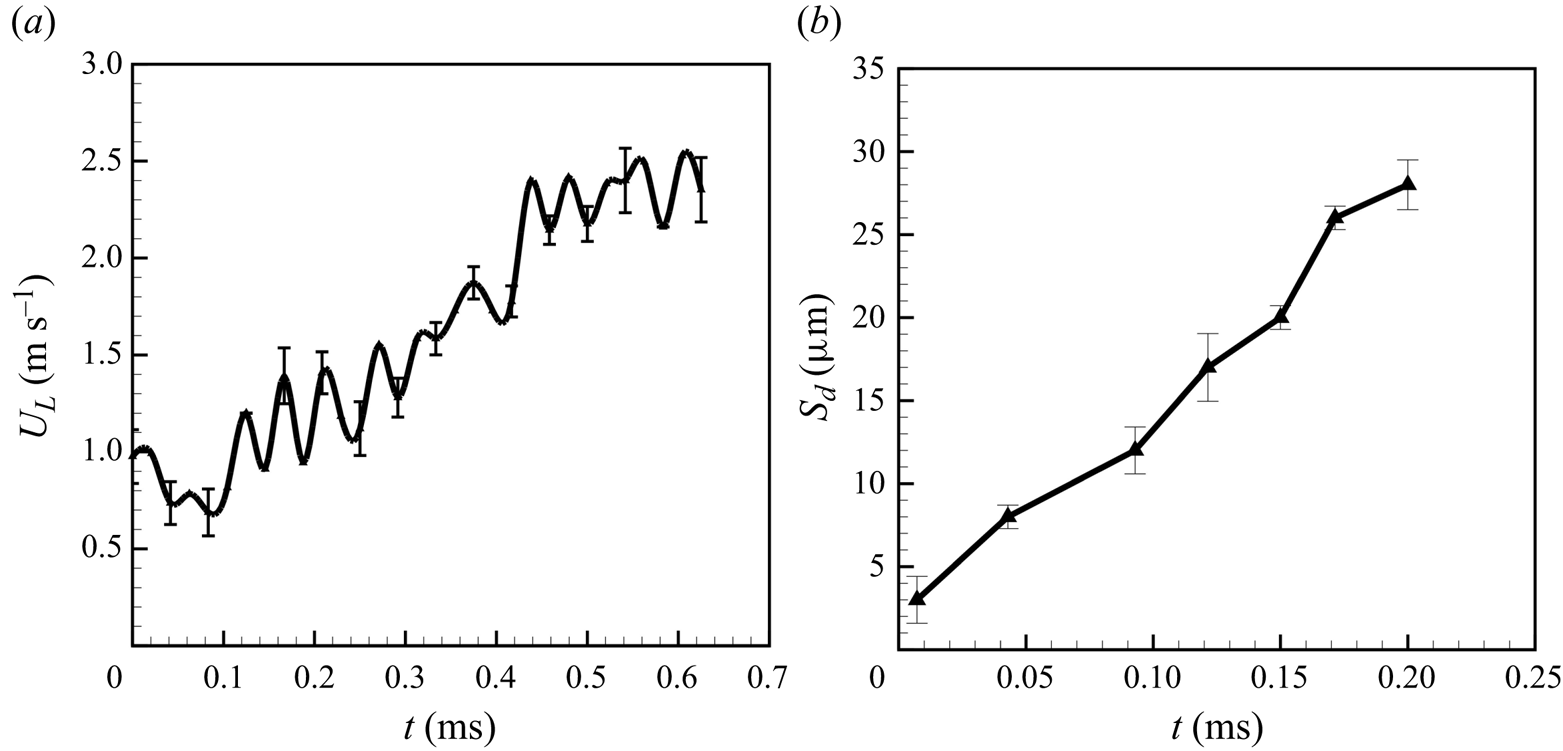
To get further insights into the dynamics of the flattened membrane-like sheet, the droplet is positioned in such a way that the side-view imaging of the edge region clearly captures its radial expansion. The imaging is now carried out at 140k fps. Interestingly, while in the stretching regime, the velocity of radial expansion of the stretched droplet does not change significantly, an oscillatory motion of the liquid sheet is observed in the thinning regime, associated with radial acceleration and deceleration of the liquid sheet (see figure 6a). Note that these oscillations are not visible with the low-speed imaging (6200 fps and 11 000 fps) reported in figures 4(a) and 5. The thinning of the liquid sheet also leads to an increase in the vertical displacement ( $s_d$) of the sheet with a vertical velocity of around
 $0.1\,{\rm m}\,{\rm s}^{-1}$ (see figure 6b).
The radial rim velocity  $U_L$ (a) and amplitude
 $s_d$ for the thinning regime of the vertical vibrations of the liquid sheet (b) with time. Velocity is calculated from the side-view results presented in figure S4 in the SI. Note: velocity is measured for 0.7 ms before the initiation of breakup and amplitude (vertical displacement of vibrating liquid sheet at the thin membrane region) is measured for 0.22 ms before the initiation of breakup. Note: the images are recorded at 140k fps with the camera focusing on the equatorial region of the droplet.
Thus, the liquid sheet thins near the equatorial region to resemble a membrane. Simultaneously, a liquid rim is developed at the edge of the thin stretched membrane (i.e. at the equatorial region of the droplet). The rim then radially accelerates, leading to further thinning of the stretched membrane at the equatorial region of the droplet.
3.4. Formation of Faraday waves at the thinned equatorial membrane region before rim breakup
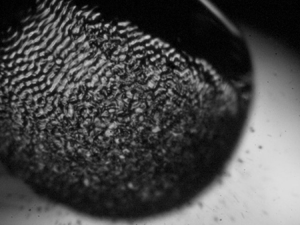
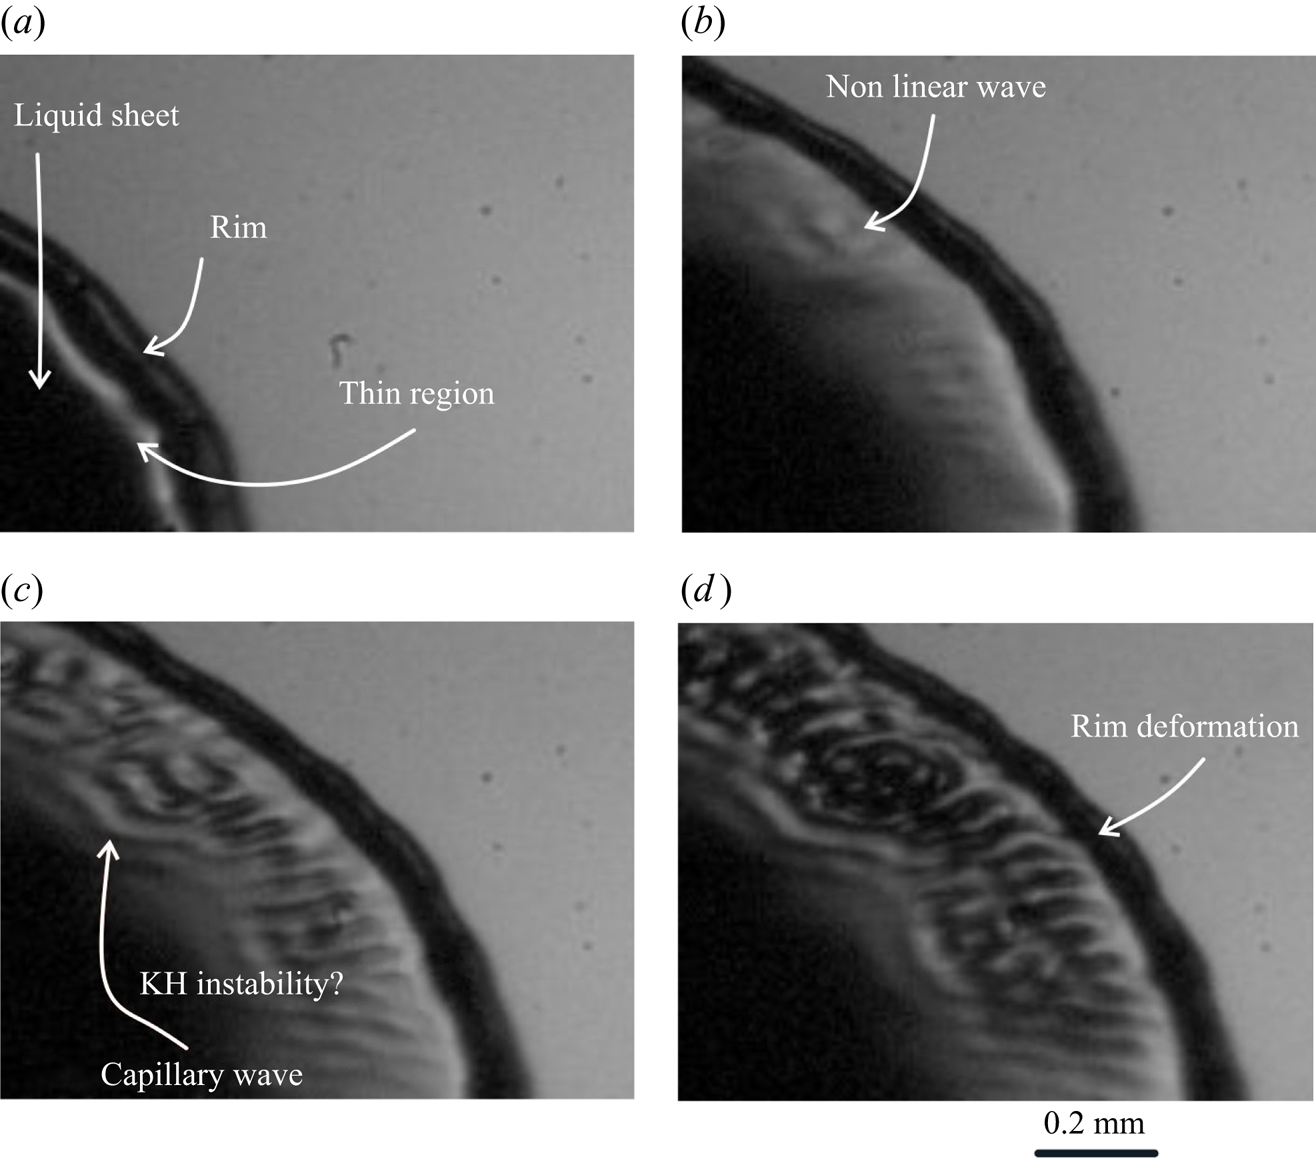
As the flattened drop with a rim and a membrane-like region stretches further, nonlinear waves appear on the surface of the liquid sheet near the rim–membrane junction, which is also the thinnest portion of the flattened droplet (see figure 7b). The rim and the thin membrane region of the liquid sheet are indicated in figure 7(a). Similar nonlinear patterns of surface waves have been reported in the literature for wave generation due to a vertically vibrating liquid bath (Oza et al. Reference Oza, Harris, Rosales and Bush2014; Bush Reference Bush2015; Tambasco et al. Reference Tambasco, Harris, Oza, Rosales and Bush2016). The wave pattern, that has a strong resemblance to the Faraday waves, grows on the liquid sheet and induces a capillary wave (due to vertical oscillation of the liquid sheet) (see figure 7c) (refer to the SI for a side view of the vertical vibrations).
Formation of nonlinear Faraday waves and of the rim at the membrane-like region at the edge of the flattened droplet (a) rim formation, (b) initiation of nonlinear instability, (c) formation of capillary wave and (d) rim deformation due to radial acceleration and deceleration in the thinning regime just before the equatorial breakup.
3.5. Primary breakup
3.5.1. Breakup due to Faraday instability at the thinned equatorial membrane region before rim breakup
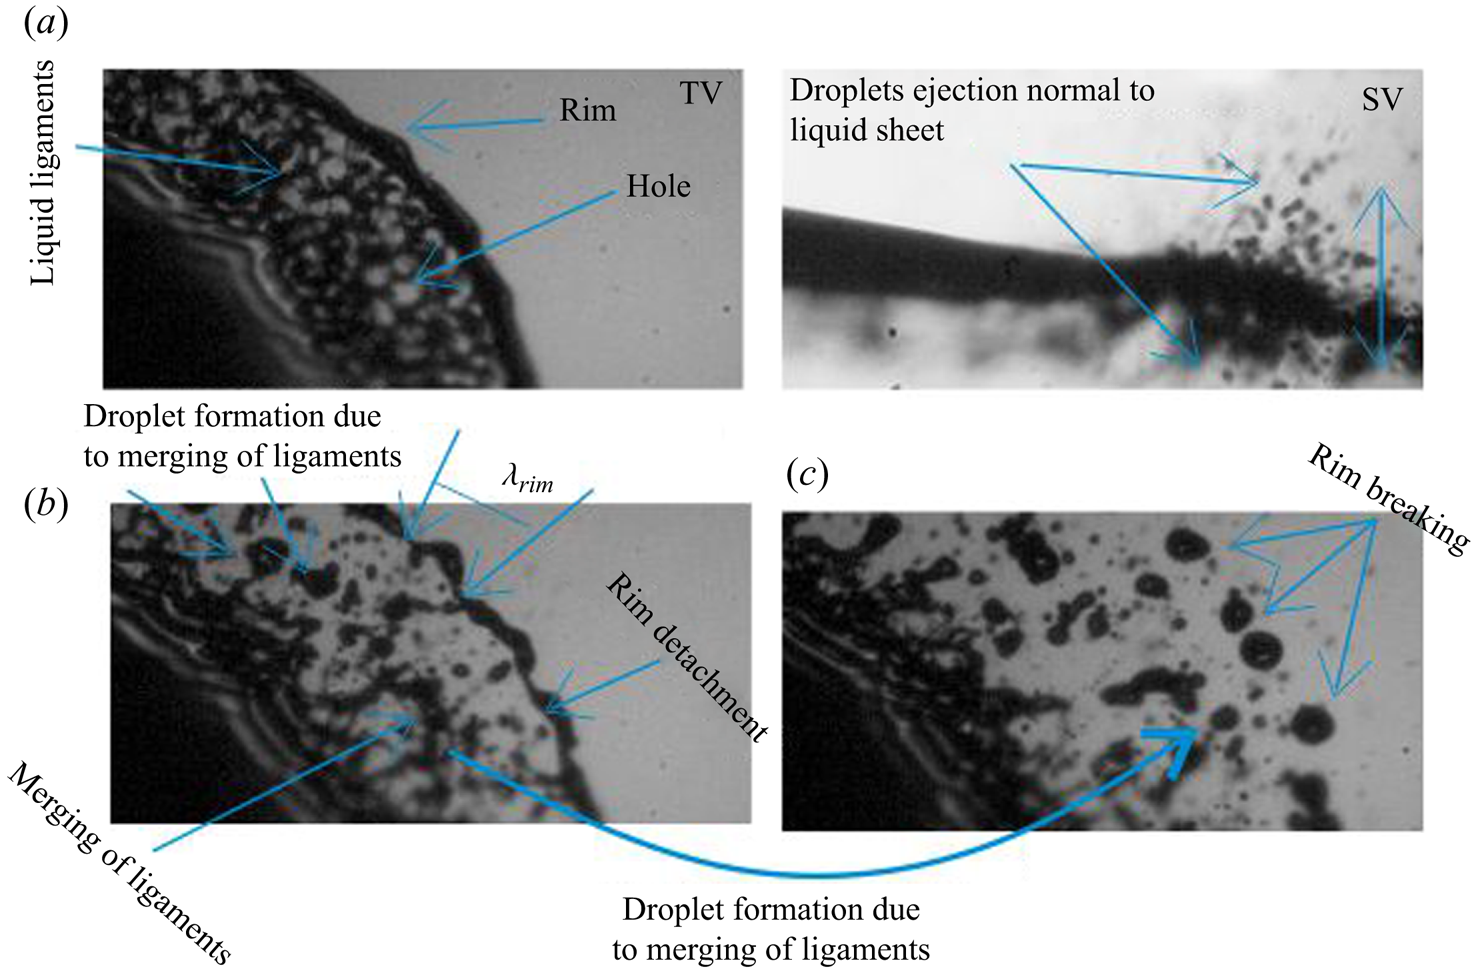
The vertical vibrations and the simultaneous radial acceleration and deceleration of the rim (figure 6, also see movie 2 and figure S4 in the SI) result in the growth of azimuthal deformation of the rim shown in figure 7(d), possibly due to the RT instability. Simultaneously, the continued radial propagation of the membrane-like region of the liquid sheet with increasing velocity leads to a continuous reduction in the thickness. The azimuthal deformations propagate backward into the sheet, causing azimuthal perturbations in the Faraday waves in the thin membrane region of the liquid sheet. Our experimental observation suggests that a liquid sheet of a very small thickness, subject to an acoustic field, shows much enhanced vertical vibrations. The amplitude of the vertical vibration continues to increase linearly with time, coinciding with the simultaneous reduction in the thickness (see figure 6b). The Faraday waves now develop into a Faraday instability on the surface of the liquid sheet, and a strong ejection of very tiny droplets is seen perpendicular to the surface of the liquid sheet. The ejection of these droplets from the liquid surface produces holes in the liquid sheet (see figure 8a). The perforation of the liquid sheet causes the ligaments to merge and break into droplets (figure 8b) thereby weakening the attachment of the rim with the flattened droplet. An additional pictorial representation of the ligament merging during the perforation of the liquid sheet at the equatorial region is shown in figure 8. The images are also provided in figure S5 at a time interval of  $35\,\mathrm {\mu }{\rm s}$. The ligaments are interconnected with each other during the perforation of the sheet. The ligaments merge, leading to a web of liquid in the perforated sheet. The merging and breakup of the liquid ligaments then lead to the formation of spherical droplets.
Fragmentation of the liquid sheet at the edge region during the end stages of primary breakup: (a) top-view (TV) and side-view (SV) images during perforation, (b) rim detachment and (c) rim breakup. See movie 2.
3.5.2. Fragmentation at the rim of equatorial region
The generation of tiny droplets by the Faraday instability and their ejection in the vertical direction continues until the bag formation starts. The measured size of the tiny-sized droplets, generated by the Faraday instability, varies between  $20$ and
 $34\,\mathrm {\mu }{\rm m}$. The liquid rim detaches from a highly perforated liquid sheet, created by the Faraday instability, and breaks into droplets (figure 8c). Unlike the droplets generated by the Faraday instability, which are ejected in the vertical direction, perpendicular to the expanding sheet, the droplets generated by rim breakup are ejected and scattered in the direction of sheet expansion (radial direction) in the plane of the expanding droplet. The wavelength of the deformed rim is around
 $330\,\mathrm {\mu }{\rm m}$ and breaks into droplets with a size of the order of
 $100\,\mathrm {\mu }{\rm m}$. At this stage, the generation of the capillary waves of constant wavelength appears on the surface of the liquid sheet. The capillary wavelength on the surface of the liquid sheet is
 $65\,\mathrm {\mu }{\rm m}$. A detailed discussion on the droplet size distribution is presented later.
The rim detachment leads to a deceleration of the liquid sheet, although the liquid sheet continues to radially expand and exhibit fragmentation. During this period, the droplets are ejected both radially and perpendicularly to the liquid sheet. The liquid sheet, after undergoing a complete breakup of the membrane-like region at the edge of the sheet near the equator, shows a cessation of this fragmentation process. This thereby marks the end of the primary breakup, we term the equatorial breakup of the liquid sheet, where after the secondary breakup starts.
3.6. Secondary breakup of different kinds of the stretched liquid sheet
While the primary droplet breakup at the equatorial region is similar for all  $We$ (see figure 9a–d), the secondary breakup (i.e. breakup of the convexly deformed, highly stretched liquid sheet) depends upon the initial diameter of the droplet, and thereby on
 $We$ (see figure 9e–h). The observed secondary breakup is classified as (a) umbrella breakup (
 $1.37 \le We < 1.45$), (b) bag breakup (
 $1.45 \le We < 1.56$), (c) bubble breakup (
 $1.56 \le We < 1.9$) and (d) rim collapse and sheet breakup (multi-stage breakup) (
 $We > 1.9$) (see movie 3).
Top-view images showing different regimes of breakup depending on  $We$. Equatorial atomisation is similar for all (see a–d). The secondary breakup takes place in different regimes depending on
 $We$ (see f). Readers are advised to see movie 3 for more clarity and the corresponding side-view images can be seen in movie 1.

3.6.1. Umbrella breakup
Once a droplet is levitated in the acoustic levitator it undergoes stretching, thinning, Faraday and equatorial breakup, fragmentation and the end of the primary breakup is marked by retraction of the fragmented sheet, as discussed in the earlier sections (see figure 9a–d). At this point, the retracted but still flattened droplet begins to stretch again, the thickness of the flattened droplet starts to decrease, and a new thinning region is again formed, marking the beginning of the secondary breakup. This decrease in thickness because of the expansion of the liquid sheet during equatorial breakup is indicated by arrows in figure 9(d–e). The newly formed thinned region shows capillary waves and edge breakup through a combination of Faraday instability, correspondingly formed holes, RT and RP mechanisms constituting the secondary breakup mechanism. The flattened liquid droplet that has been transformed into a sheet now thins over the entire region of the droplet (see movie 3). This further thinning of the liquid sheet leads to an increase in its frequency to reach the sub-harmonic condition. The sub-harmonic condition leads to the Faraday instability developing on the entire surface of the liquid sheet (see figure 9g). The relevant calculations are presented in § 4.5 (also see more images and the movie in the SI).
Figure 10 shows the development of different types of interfacial instabilities on the liquid sheet during the mode of umbrella breakup. The capillary wave pattern is developed when the frequency of the liquid sheet becomes equal to half of the applied acoustic frequency due to thinning. The lattice mode and checkerboard pattern are observed at the edge of the sheet during the breakup. The lattice mode pattern was also observed by Vukasinovic, Smith & Glezer (Reference Vukasinovic, Smith and Glezer2007) at the interface of a vertically vibrating sessile droplet and has been attributed to the Faraday instability. The checkerboard pattern is associated with the coupling of the capillary wave pattern with the azimuthal wave. A similar kind of Faraday wave pattern has also been observed elsewhere (Shats et al. Reference Shats, Francois, Xia and Punzmann2014; Khan & Eslamian Reference Khan and Eslamian2019).
The local variation of the Faraday pattern on the convexly deformed liquid sheet during the secondary breakup regime of umbrella-type breakup.

The Faraday instability causes the generation and growth of the instability from the equatorial to the centre region of the liquid sheet. The Faraday waves formed on the entire surface of the droplet become unstable, causing droplet ejection from the entire liquid sheet and corresponding hole formation. The holes expand and cause the merging of the liquid sheet and result in ligaments that ultimately break due to the RP instability.
The above is termed as umbrella breakup since the sheet, after fragmentation and before the onset of secondary instability, builds a positive, convex upwards curvature. The liquid sheet completely disintegrates and atomises during the formation of the upward curvature. Readers are advised to see movie 3 (top view), movie 1 (side view) and figure S7 in the SI for a better understanding.
3.6.2. Bag breakup
Umbrella breakup occurs when the sheet undergoes further thinning and admittance of Faraday instability subsequent to its primary breakup. On the other hand, bag formation occurs when, after primary breakup, the thickness at the equatorial region is not reduced to any significant extent such that sub-harmonic condition and, thereby, the Faraday instability cannot set in. As a result, as the liquid sheet decelerates (decreased rate of expansion of liquid sheet), droplets accumulate at the edge, resulting in the formation of the rim, without any equatorial breakup (see bag breakup in figures 9e and S6). The diameter of the liquid sheet can then increase without much further equatorial breakup such that it is beyond the radial spatial range of the acoustic pressure field in the levitator (up to 4.5 mm). The unsupported sheet at the edges bends downwards under gravity and results in the formation of a convexly deformed bag-like structure (see movie 3). The development of the bag increases the surface area of the liquid sheet and the pressure conditions inside the bag lead to significant stretching (ballooning expansion) and, thereby, thinning of the bag. The sub-harmonic condition is thereby achieved by a further reduction in the thickness of the liquid sheet during bag growth (see bag breakup in figure 9f,g). During this time, the Faraday instability is developed at the surface of the thinned membrane-like sheet. This causes the droplets to be ejected perpendicular to the sheet, resulting in sheet perforation (see bag breakup in figure 9h). For more clarity, readers are advised to see movie 3 (top view), movie 1 (side view) and figure S8 in the SI.
3.6.3. Bubble breakup
Subsequent to droplet levitation, stretching, thinning and primary equatorial breakup followed by sheet retraction, bag formation can occur, wherein the bag thins and breaks by Faraday instability. If the thinning of the bag is delayed, the bag (which is a curved, stretched liquid sheet) can close onto itself, resulting in bubble formation. This bubble can then undergo bubble breakup (see movie 3).
In this mode, the liquid sheet transforms into a convex sheet structure similar to that of bag breakup discussion in § 3.6.2. During bag formation, the thickness of the rim increases with time due to the flow of liquid accumulating at the rim. The rim collision can then transform the bag into a bubble (see bubble breakup in figure 9f). Due to the larger sheet thickness of this bubble, no instability is observed at the bubble's surface, unlike umbrella and bag breakup. The bubble then begins to radially expand with a simultaneous reduction in the thickness of the liquid sheet (see bubble breakup in figure 9g). The instability emerges at the thinnest region near the rim. As the thickness further reduces to the magnitude that invokes the Faraday instability, the instability propagates across the entire surface of the bubble, resulting in droplet ejection from the surface of the liquid sheet, and a hole is seen to form (see bubble breakup in figure 9h). The perforated sheet transforms into ligaments and breaks due to RP instability. The breakup of the bubble leads to a residual liquid sheet that again gets levitated and the rim deforms and breaks once again (see figure 9). Readers are advised to see figure S9 in the SI for more clarity.
3.6.4. Multi-stage breakup
In certain cases, the bubble formed during the secondary breakup stage, discussed in § 3.6.3, may not break. In such a case, the rim of the bubble begins to deform (see multi-stage breakup in figure 9f), which leads to equatorial thinning of the sheet. The surface of this thinned-out equatorial membrane sheet (see multi-stage breakup in figure 9g), exhibits fragmentation through a combination of Faraday, RT and RP instabilities 3.5.1 (see multi-stage breakup in figure 9h). The atomisation of the sheet is stopped after fragmentation, and a rim is formed once again at the edge of the sheet, such that the sheet again expands and thins locally, resulting in another cycle of sheet breakup. This breakup process continues until the sheet collapses, resulting in ligament formation and breakdown as a result of RP instability (see movie 3 and figure S10 in the SI for more clarity).
4. Discussion
The breakup of droplets in swirl flow or gravitational fall as well as the breakup of sheets formed by co-axial jets, have been investigated in numerous studies. Similarly, droplet oscillation, levitation and break up in an acoustic levitator have been addressed to some extent in the literature. In this section, we invoke the results of these studies to understand the mechanism of droplet levitation, stretching, thinning, equatorial breakup, bag formation, interfacial instabilities and droplet size distributions in our experimental observations detailed in § 3.
4.1. Mechanism of droplet levitation, deformation and critical $We$

The acoustic radiation force on the drop, when balanced by the weight of the droplet, yields the vertical droplet position  $z_{lev}$ in the levitator, as measured below the node (see Appendix A.1 for details):
 \begin{equation} z_{lev}=\frac{c_o^2 g \lambda \rho_L \rho_a}{5 {\rm \pi}^2 P_o^2}, \end{equation}
where  $\lambda =c_o/f$ and
 $f$ is the sound frequency. With
 $z_{lev}=\lambda /2$, the condition for the critical acoustic pressure required for levitation is given by
 \begin{equation} P_{cr}=\sqrt{\frac{2 c_o^2 g \lambda \rho_L \rho_a}{5 {\rm \pi}^2}} \sim 690\,{\rm Pa} \end{equation}
(see Appendix A.1 for more details). The calculations show that a 2 mm droplet is levitated around  $300\,\mathrm {\mu }{\rm m}$ below the centre node position of the standing wave for parameters
 $P_o= 2400$ Pa,
 $\lambda =8.5$ mm realised in the acoustic levitator used in this study. Given that the node-to-node distance is around 4.5 mm, the droplet can be considered to be located almost exactly at the centre of the node of the standing wave.
The initial shape of the droplet is assumed to be spherical. The imposed acoustic standing wave changes the spherical droplet to an oblate cylindrical shape. Therefore,  $h$ can be approximated as
 $h \sim {d_0^3}/{6 R^2}$, where
 $d_0$ is the diameter of the undeformed droplet. The final shape of the droplet can be considered to be a balance of the inertial force of the gas due to the acoustic waves and the capillary force, i.e.
 $2 {\rm \pi}R ( 2 \sigma ) = \rho _a U^2 \times 2 {\rm \pi}R h$, yielding
 \begin{equation} \frac{2R}{d_0} = \frac{1}{\sqrt{3}} We^{1/2}. \end{equation}
Equation (4.3) explains the experimental observation of the size of the deformed droplet  ${2R}/{d_0} \simeq We^{1/2}$. The droplet then breaks above a critical
 $We_c = 1.36$, as seen from the experimental data (figure 9). Danilov & Mironov (Reference Danilov and Mironov1992), while predicting a critical
 $We$ of around 1.7, argue that, at
 $We_c$, the restoring capillary force associated with the curvature of the oblate spheroidal droplet at the equator cannot balance the deforming acoustic force (due to negative pressure) at the equator, whereby the droplet cannot attain a steady shape.
4.2. Mechanism of flattening
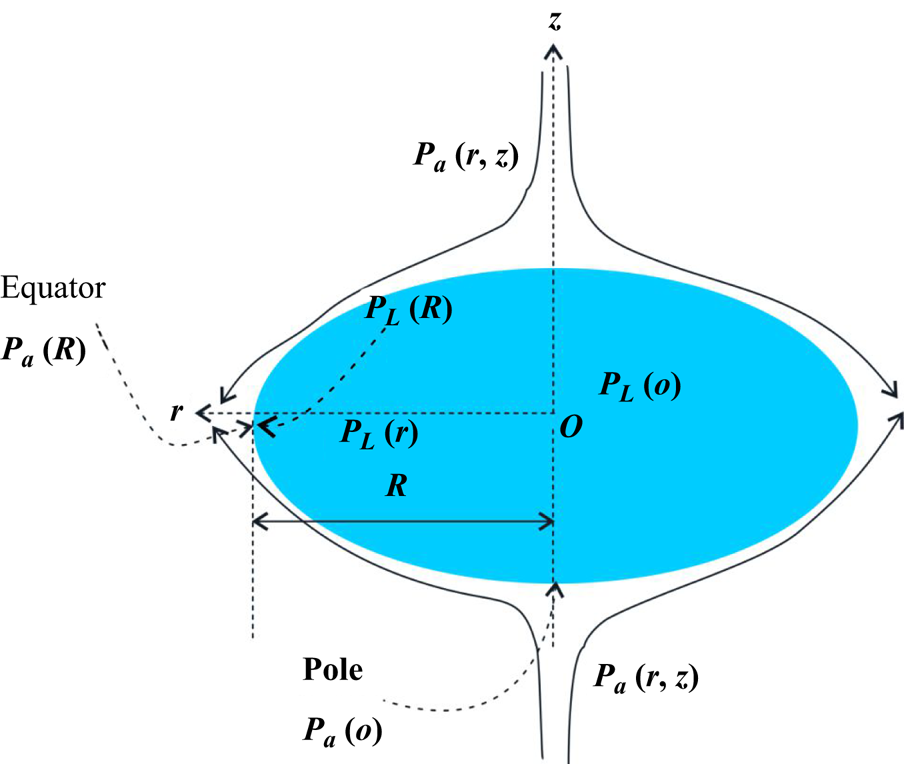
For an inviscid droplet at the node of a standing wave in an acoustic field (Villermaux & Bossa Reference Villermaux and Bossa2009; Kulkarni & Sojka Reference Kulkarni and Sojka2014; Kirar et al. Reference Kirar, Soni, Kolhe and Sahu2022), the droplet is subjected to a time-varying pressure and velocity field, which in turn yields a non-zero time-averaged pressure field, given by the Bernoulli equation, as
 \begin{equation} P_a (r,z) = P_a (0) - \rho_a \frac{f_s^2 U^2}{8d_0^2} r^2 - \rho_a \frac{f_s^2 U^2}{2d_0^2} z^2, \end{equation}
where  $r = \sqrt {x^2+y^2}$ is the radial coordinate and
 $P_a = {\rho _a U^2}/{2}$ is the stagnation pressure at
 $z = 0$ (see figure 11), and the air velocity
 $U = ({P_0}/{\rho _a c_0})({1}/{\sqrt {2}})$. Here,
 $f_s$ is the stretching factor, a fitting parameter, as also considered in the literature (Villermaux & Bossa Reference Villermaux and Bossa2009; Kulkarni & Sojka Reference Kulkarni and Sojka2014; Kirar et al. Reference Kirar, Soni, Kolhe and Sahu2022) (see Appendix A.3). The stretch factor is highly shape dependent and is expected to be nonlinear in
 $We$.
Sketch to explain the mechanism of droplet flattening.
The Euler equation and continuity equation in radial coordinates, for the liquid, are given as
 \begin{gather} \rho_L \left(\frac{\partial u_r}{\partial t}+ u_r \frac{\partial u_r}{\partial r}\right)= \frac{-\partial P_L}{\partial r}, \end{gather}
 \begin{gather} \frac{\partial h}{\partial t}+ \frac{1}{r} \frac{ \partial (r u_r h)}{\partial r} = 0. \end{gather}
The change in the thickness of the flattened-sheet-like droplet during radial expansion is written as  $h = {d_0^3}/{6R^2}$ and the velocity field inside the droplet is related to the radial expansion velocity of the droplet as
 $u_r(r,t) = ({r}/{R})({{\rm d}R}/{{\rm d}t})$ and satisfies the continuity equation. The deformation of the droplet is due to the pressure difference between the liquid and surrounding pressure. The normal component stress balance at the equator of the flattened drop yields
 \begin{equation} \frac{2 \sigma}{h} = P_L (R) - P_a (R), \end{equation}
where  ${2 \sigma }/{h}$ is the capillary pressure at the liquid–air interface, where h/2 is the radius of curvature of the rounded neck at the equatorial region. Also,
 $P_a(R)=P_a(R,0)$ and
 $P_L(R)$ are the outside (surrounding) and inside (liquid) pressures, respectively. By assuming the origin of a cylindrical coordinate system at the centre of the droplet (
 $z=0$), the pressure at the edge of the droplet,
 $r = R$, is given below:
 \begin{equation} P_L (R) = P_a (0) - \rho_a \frac{f_s^2 U^2}{8d_0^2} R^2 + \frac{2 \sigma}{h}. \end{equation}
Defining  $\phi = {2R}/{d_0}$,
 $T = t/\tau$,
 $\tau = ({d_0}/{U}) \sqrt {{\rho _L}/{\rho _a}}$ and
 $P_a(0)=P_a(0,h)$ (see Appendix A.3). Thus the evolution of the diameter
 $R$ of the deformed droplet can be given as
 \begin{equation} \frac{{\rm d}^2\phi}{{\rm d}T^2}-\left(\frac{f_s^2}{4}- \frac{24}{We} \right) \phi = 0. \end{equation}
The solution of the above equation by using the boundary condition at  $\phi (0) = 1$ and
 $\phi ' (0) = 0$ is given as
 \begin{equation} \phi(T) = \frac{1}{2} \exp\left(-\frac{\alpha T}{2}\right) \left(1+ \exp\left(\alpha T\right)\right), \end{equation}
where  $\alpha = {\sqrt {-96+f_s^2 We}}/{\sqrt {We}}$.
The solid line and symbol in figure 12(a) show the evolution of  $2R$ with
 $t$ obtained from (4.10) and experiments, respectively. Figure 12(b) shows a good data collapse between experiment and theory and the data collapse is seen to be better for higher Weber numbers. The difference between the experiments and theory at smaller
 $We$ may be attributed to the centre of mass oscillations of the smaller-sized droplet in the standing wave as well as to the shape approximation (cylindrical) of the flattened droplet. It is important to note that the stretching factor (
 $\,f_s$) varies with droplet size (or
 $We$).
The comparison of experimental and theoretical results in the stretching regime: (a)  $2R$ vs
 $t$, (b)
 $\phi$ vs
 $\alpha$*T. Here,
 $T = t/\tau$,
 $\tau = ({d_0}/{U}) \sqrt {{\rho _L}/{\rho _a}}$.

It is pertinent to see if (4.9), which describes stretching of the droplet with time, as a function of  $We$, can be used to estimate the critical
 $We$. At low
 $We$, the stretching factor is found to asymptote to a value of
 $f_s=9.2$. The critical
 $We$ beyond which a droplet is always unstable and shows stretching can now be estimated using (4.9), assuming a steady state, such that
 $We_c=96/f_s^2$, and yields
 $We_c \sim 1.14$, in approximate agreement with the experimental value of around 1.36 reported in the results section (see figure 2a).
4.3. Mechanism of thinning
The droplet placed in an acoustic standing wave expands radially with a reduction in thickness, resulting in a flattened-sheet like droplet. This thickness is approximately uniform along the radial extent during the stretching regime. The time-dependent radial velocity of the expanding liquid  $U_L={\rm d}R/{\rm d}t$, as seen in experiments, is presented in § 3. As the liquid drop flattens and radially stretches, the inertial force due to radial liquid velocity
 $U_L$ is balanced by the capillary force (figure 7a) that resists the rate of change of momentum at the rim (Culick Reference Culick1960; Villermaux & Clanet Reference Villermaux and Clanet2002). A balance of the inertial acceleration of the sheet and the interfacial tension,
 $\rho _L U_{LTC}^2~h = 2 \sigma$, leads to the Taylor–Cullick velocity
 $U_{LTC}= \sqrt {{2 \sigma }/{\rho _L h}}$. According to Villermaux & Clanet (Reference Villermaux and Clanet2002), a liquid sheet propagates in the air without initiation of breakup when
 $\rho _L U_L^2< {2 \sigma }/{h}$. For a constant velocity of stretching of a sheet, the sheet breaks when the thickness reduction is of the order of
 $2 \sigma /(\rho _L U_L^2)$. For example, in a liquid sheet formed by coaxial jets, the liquid velocity
 $U_L$ of the sheet remains constant, and a steady state is typically considered. The thickness
 $h$ decreases with
 $R$ along the radial direction, since mass conservation demands that
 $h=Q/(2 {\rm \pi}R U_L)$, where
 $Q$ is the imposed flow rate in the system during droplet deformation in the radial direction. In this case of a liquid sheet formed by coaxial jets, the liquid sheet breaks when the thickness
 $h$ reaches that given by (4.11):
 \begin{equation} h = \frac{2 \sigma}{\rho_L U_L^2}. \end{equation}
In the present case of droplet breakup in an acoustic field, the liquid velocity increases exponentially (see figure 5) in the thinning regime. The inertial force  $\rho _L U_L^2h$ can therefore decrease to a value of
 $2\sigma$, the Taylor–Cullick criterion of breakup, since there is a correspondingly faster decrease in the thickness of the sheet. Once the sheet thickness reduces to satisfy the Taylor–Cullick criterion, the liquid accumulates at the edge of the flattened droplet to form a rim. As the rim and, thereby, the sheet accelerate due to lower pressure at the equator,
 $U_L$ increases with time by drawing the fluid from the region just behind the rim into the equatorial region. The acceleration results in the thinning of the flattened droplet to locally form a thin, membrane-like sheet at the edge, preceding the rim, to locally obey mass conservation. This is a reinforcing process, where the high velocity in the thin membrane region further increases the radial extent of the thin membrane region. While this may appear akin to the jet thinning mechanism it should be noted that the capillary pressure due to azimuthal curvature that plays an important role in the jet thinning mechanism is absent in the sheet thinning process. (see figure S4 in the SI).
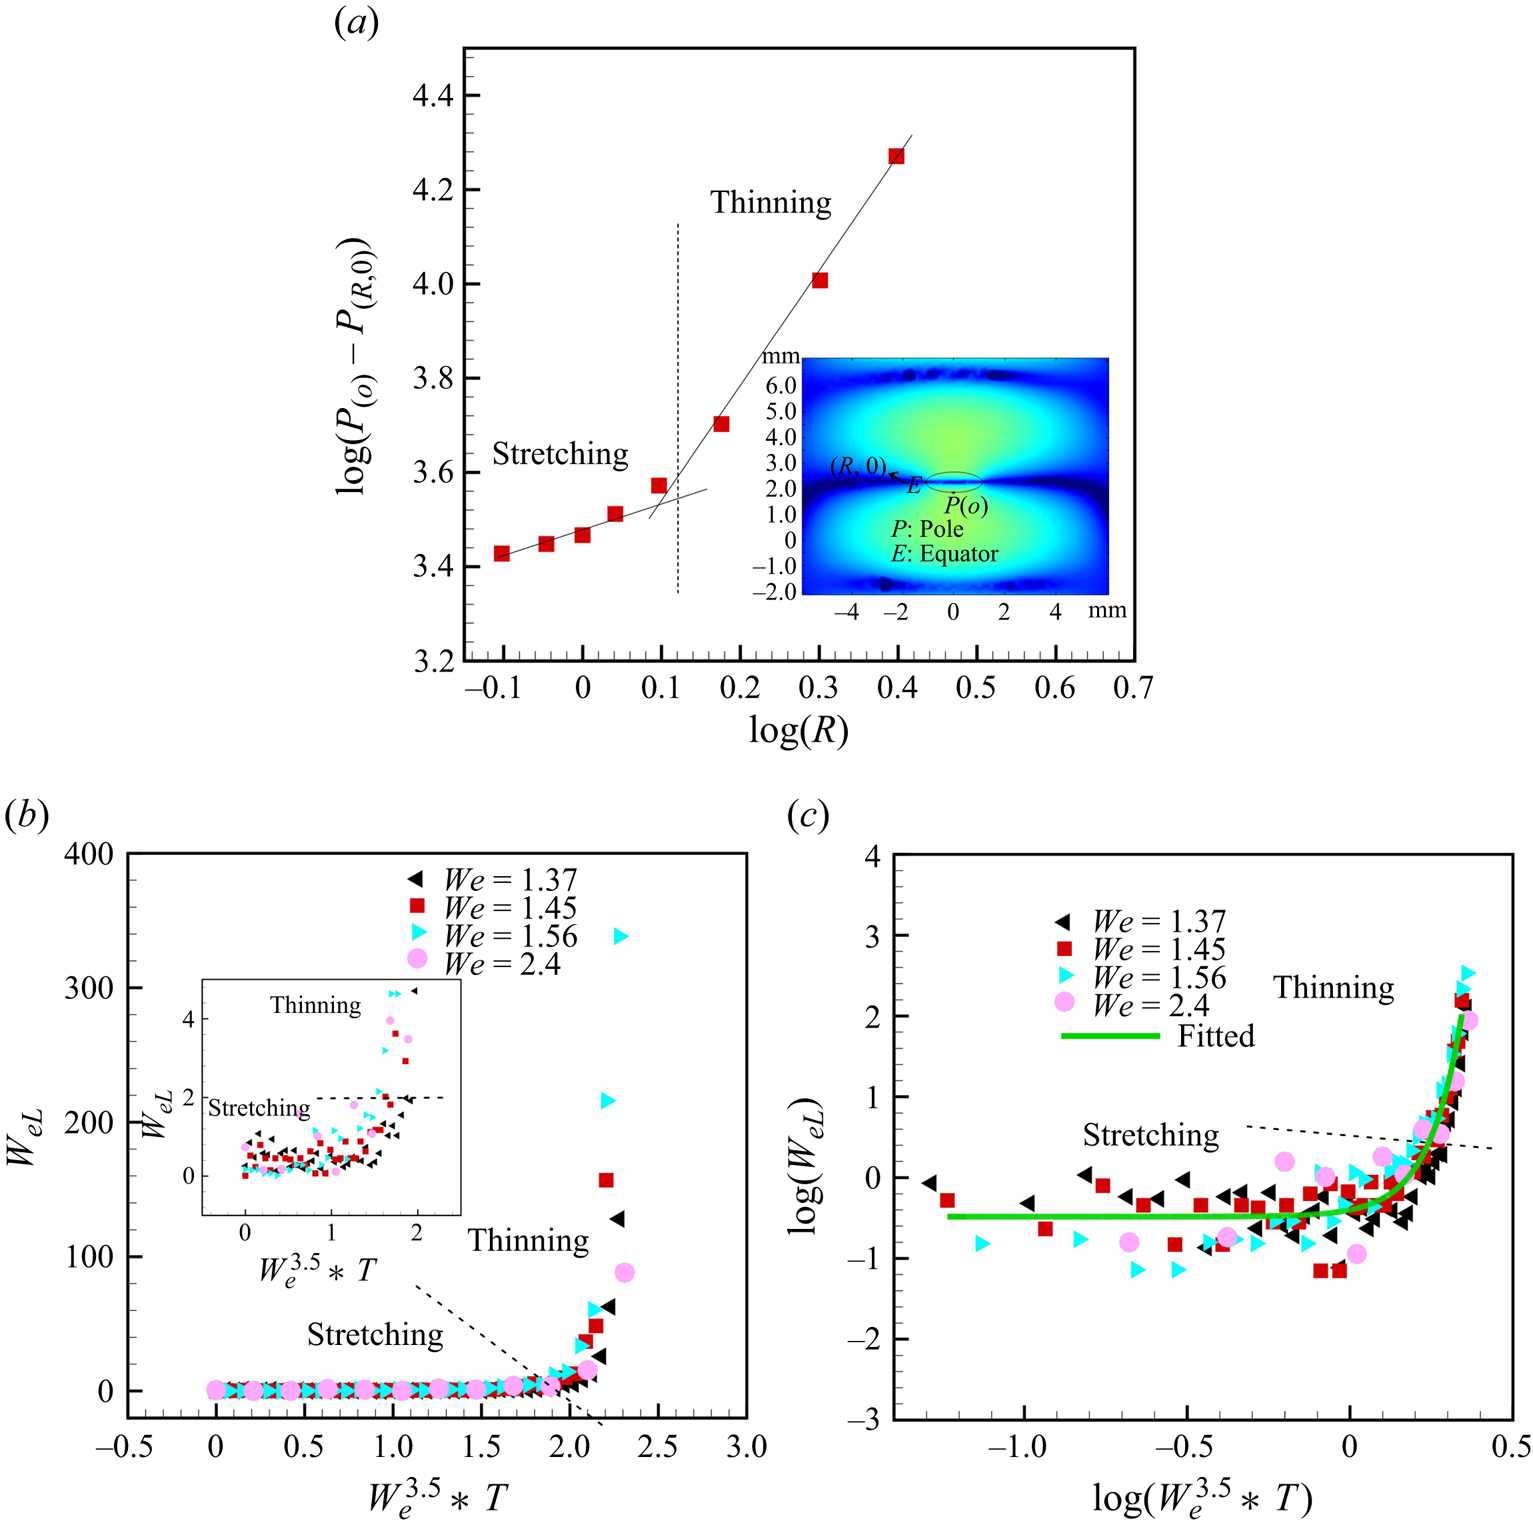
The rapid thinning and increase of the extent of the membrane-like region at the edge of the flattened droplet preceding the rim is facilitated by a nonlinear increase in the negative pressure, the difference between the pressure at the edge of the droplet at the equator and that at the pole, as dictated by the Bernoulli equation (4.8). Numerical calculations were conducted by inserting a droplet at the node with an aspect ratio chosen in accordance with the results of the experiment (see the Appendix A.5). Note that the deformation of the droplet was not considered in these calculations and time-averaged values were analysed. The results indicated that, in the stretching regime and thinning regime, the pressure difference between the pole and the equator varies as  $P_{(o)} - P_{(R,0)} \simeq R^{1/2}$ and
 $P_{(o)} - P_{(R,0)} \simeq R^{11/5}$ (see figure 13a), respectively. This illustrates that the thinning of the equatorial region is initiated by a highly nonlinear decrease in equatorial pressure, in agreement with Shi (Reference Shi1995), who used boundary element calculations.
(a) Value of  ${\rm log}(P_{(o)}- P_{(R,0)})$ vs log(R) obtained from the simulation (more details about the simulation are provided in Appendix A.5), (b) variation of local Weber number
 $We_L$ during the temporal evolution of the radius of the flattened droplet with non-dimensional time and overall
 $We$ (b)
 $We_{L}$ vs
 $We^{3.5} *T$, and (c)
 ${\rm log}(We_{L})$ vs
 ${\rm log}(We^{3.5} *T)$. Here,
 $We = {\rho _a U^2 d_o}/{\sigma }$ and
 $We_{L} = {\rho _L U_L^2 d_o}/{\sigma }$.
The radial velocity and acceleration in the thinning regime are actually periodic, as confirmed by video measurements made at 140k fps from the top and side views. The standing wave has an acoustic frequency of 40k Hz. Therefore, we captured the images at an fps higher than the frequency of the standing wave. The variation of the radial rim velocity (  $U_L$) and the vertical amplitude
 $s_d$ with time in the thinning regime are shown in figures 6(a) and 6(b), respectively. The velocity
 $U_L$ in figure 6(a), when compared with the velocity shown in figure 5, indicates period-averaged (40 kHz) radial propagation in the latter figure, and is therefore without any visible velocity fluctuations, especially in the thinning regime (note the two data sets are for different parameters and so are not the same). This is essentially due to the lower frame speed in those experiments, of 11 000 fps (figure 5), which is much smaller than the acoustic vibration frequency. The monotonic increment in the vertical amplitude occurs in the unstable region (see figure 6b), commensurate with the net radial acceleration of the drop edge, with corresponding film thinning. It should be noted here that
 $U_L$ in figure 6 does show periodic radial acceleration and deceleration of the drop edge. The periodic vertical and, thereby, radial acceleration and deceleration will be argued to be critical to instabilities in the next section.
It is interesting to attempt to explain both the stretching and the thinning regimes with a single empirical expression. The time-dependent radial velocity can be expressed in terms of a non-dimensional, local, liquid Weber number defined as  $We_{L} = {\rho _L U_L^2 d_o}/{\sigma }$ at a given time, with radial velocity
 $U_L={\rm d}R/{\rm d}t$ instead of the global (based on air properties and acoustic air velocity
 $U$)
 $We = {\rho _a U^2 d_o}/{\sigma }$. Figure 13 shows the variation of
 $We_{L}$ with respect to scaled time and the radial diameter during liquid sheet expansion. The
 $We_{L}$ value changes slowly in the stretching regime (see figure 13b,c). A critical
 $We_{L}$ is obtained as 2, which can be clearly observed in the zoomed view inset in figure 13(b), beyond which the onset of stretching can be observed. Thus, the non-dimensional variation of the radial extent of the sheet with time can be explained by a single empirical expression,
 ${\rm log}(We_L/0.6)=0.08$
 $\exp (10\, {\rm log}(We^{3.5}*T))$.
4.4. Mechanism of primary breakup: atomisation at equatorial region
4.4.1. Kelvin–Helmholtz instability
The KH-type interfacial waves can develop on the surface of a thin liquid sheet that radially expands in the air, and it is appropriate to assess the stability of KH waves during the droplet thinning stages of the atomisation of the acoustically levitated droplet. The dispersion relation for the KH instability of a moving liquid sheet of constant thickness was first investigated by Squire (Reference Squire1953) for two possible modes of KH waves, symmetric (varicose) and asymmetric (sinuous mode). The dispersion relation for a sinuous mode of the liquid sheet with constant thickness h moving with a velocity  $U_L$, is written as (Bremond et al. Reference Bremond, Clanet and Villermaux2007)
 \begin{equation} \frac{\omega}{kU_L}= \frac{1\pm (\alpha\, {\rm coth}(kh/2))^{1/2} \left[{-}1+\dfrac{\sigma k}{\rho_L U_L^2} (1+\alpha\, {\rm coth}(kh/2)\right]^{1/2}}{1+ \alpha \,{\rm coth}(kh/2)}, \end{equation}
where  $k = {2 {\rm \pi}}/{\lambda }$ is the wavenumber,
 $\lambda$ is the wavelength and
 $\alpha = {\rho _a}/{\rho _L}$ is the ratio of densities.
Equation (4.12) is valid for constant sheet thickness, which does not truly represent experimental conditions where the sheet thickness decreases with  $r$. Therefore, Bremond et al. (Bremond et al. Reference Bremond, Clanet and Villermaux2007) modified the above equation for variable thickness
 $h={d_0^2}/{8R}$. The dispersion relation in non-dimensional form, in the long wave approximation, i.e.
 $kh\ll 1$ developed, is given as
 \begin{equation} \tilde{\omega} = \frac{\tilde{k}^2}{\tilde{k}+16\alpha \tilde{R}} \left(1\pm\left[\frac{16 \tilde{R}}{We_L}\left(1+\frac{16\alpha \tilde{R}}{\tilde{k}}\right)-\frac{16\alpha \tilde{R}}{\tilde{k}}\right]^{1/2}\right), \end{equation}
where  $\tilde {k} = k d_0$,
 $\tilde {R} = R/d_0$,
 $We_L = {\rho _L U_L^2 d_0}/{\sigma }$,
 $\sigma$ is the surface tension,
 $d_0$ is the initial diameter of the droplet and
 $\tilde \omega =\omega d_o/U_L$. For a stretched liquid sheet in an acoustic field, the acoustic frequency can be set equal to the real part
 $\tilde \omega$. Therefore, the real part is expressed as
 \begin{equation} \tilde{k}(\tilde{R}) = \frac{\tilde{\omega}_0}{2} \left[1+\left(1+\frac{64 \alpha \tilde{R}}{\widetilde{\omega_0}}\right)^{1/2}\right]. \end{equation}
Here,  $\tilde {\omega}_0 = 2 {\rm \pi}f d_0 /U_L$ is the frequency of the acoustic field. For
 $f = 40$ kHz,
 $d_0 = 2$ mm,
 $U_L = 2.5\,{\rm m}\,{\rm s}^{-1}$,
 $\rho _L = 830\,{\rm kg}\,{\rm m}^{-3}$,
 $\rho _a = 1.22\,{\rm kg}\,{\rm m}^{-3}$,
 $\tilde {R}= 1.37$, the wavelength comes out to be
 $\lambda = 63.16\,\mathrm {\mu }{\rm m}$. Our experimental results show that the wavelength of the radially propagating waves on the surface of the liquid sheet in the thin membrane region is equal to
 $65\,\mathrm {\mu }{\rm m}$, which shows good agreement with the wavelength calculated by (4.14). This confirms that the radially propagating waves on the surface of the liquid sheet are sinuous modes of KH waves. It is then pertinent to verify if these waves are stable or unstable at this imposed frequency.
Bremond et al. (Reference Bremond, Clanet and Villermaux2007) argued that, for a liquid sheet admitting KH modes under external time-periodic forcing, there is a critical frequency,  $\tilde \omega _c$, corresponding to radius
 $\tilde R_c$, above which the KH modes are always stable. In the present case, assuming the initial diameter of the droplet to be equal to the critical radius, the cutoff frequency can be calculated by the equation
 \begin{equation} \tilde{\omega}_c = \alpha We_L \left(1-\frac{16 \tilde{R}_c}{We_L} \right)^{1/2}, \end{equation}
which yields, a cutoff frequency of  $f_c = 102$ Hz (
 $We_L = 350$). Thus, the droplet in the acoustic levitator under consideration in this study with
 $f= 40$ kHz admits stable KH modes.
4.4.2. Fragmentation at the thinned equatorial region before rim breakup: Faraday instability
The Faraday waves are nonlinear standing waves that develop on the surface of a vibrating liquid when its frequency increases above a certain threshold. These waves are known to exhibit a variety of patterns and ripples on the surface of the vibrating liquid. The response frequency of these waves could be sub-harmonic or harmonic with respect to the imposed acoustic frequency. It is, therefore, appropriate to ascertain if the instability seen in the thin membrane-like region adjoining the rim is rendered unstable by the Faraday instability. The levitator used in the present study has an imposed acoustic frequency of 40k Hz.
The frequency of the waves on a liquid surface can be expressed as (Kumar & Tuckerman Reference Kumar and Tuckerman1994; Bush Reference Bush2015; Khan & Eslamian Reference Khan and Eslamian2019)
 \begin{equation} \omega_0^2=\left(g k +\frac{\sigma k^3}{\rho_L}\right)\,{\rm Tanh}(kh), \end{equation}
where the first term on the right-hand side of (4.16) corresponds to gravity waves and the second term to capillary waves. The smaller wavelengths seen in the present study imply that  ${\sigma k^3}/{\rho _L} \gg gk$, thereby rendering the gravitational effects negligible. The calculated value of
 $\omega _o = 127.1k\,{\rm rad}\,{\rm s}^{-1}$ (
 $\,f_o=20.23$ kHz) for the experimental value of
 $\lambda = {2 {\rm \pi}}/{k}= 65\,\mathrm {\mu }{\rm m}$. Here,
 $h = 8.5\,\mathrm {\mu }{\rm m}$ estimated using the Taylor Culick expression,
 ${2 \sigma }/{\rho _L U_L^2}$ with
 $U_L=2.5\,{\rm m}\,{\rm s}^{-1}$. Note that
 $\lambda =65\,\mathrm {\mu }{\rm m}$ corresponds to the wavelength of the KH mode discussed in an earlier section. For acoustic waves of
 $f= 40$ kHz used in this work, the ratio of
 ${\omega _0}/{\omega } \sim 0.51$, which shows the liquid sheet frequency is half of the applied frequency
 $\omega$ and is thus in the sub-harmonic region. This is in good agreement with the experimentally observed oscillation frequency of the sheet, measured at 140 000 fps, which yields a value of 20 kHz (see figure S4 and movie 2 in the SI). It is known that a liquid sheet shows parametric resonance only when the thickness of the liquid sheet reduces to such an extent that
 $\omega _0$ is half the forcing frequency. For higher thicknesses,
 $\omega _0>\omega /2$, where
 $\omega$ is the frequency of the sound waves, which explains why only the thinned, membrane-like part at the edge of the stretched flattened droplet undergoes Faraday instability. It should be noted that
 $\omega _o$ is sensitively dependent on
 $h$ and sub-harmonic conditions are realised only when the liquid sheet thins to a very specific thickness (
 $8.5\,\mathrm {\mu }{\rm m}$ in the present work), when parametric resonance is set in.
Additionally, the stability of the liquid sheet, just before its breakup, was verified using the stability chart provided by Benjamin & Ursell (Reference Benjamin and Ursell1954). It was established that the thinned sheet of the flattened droplet around the equatorial rim, with thickness  ${\sim }8.5\,\mathrm {\mu }{\rm m}$, indeed admits the Faraday instability, as confirmed by the computed parameters p and q that fall in the sub-harmonic region (see figure S17). The detailed calculations are provided in the SI.
4.4.3. Fragmentation at the rim of the equatorial region: Rayleigh–Taylor instability
The Faraday waves appear only at the thinned region of the sheet preceding the rim of the liquid sheet. Eventually, when the Faraday instability sets in, it results in the ejection of tiny-sized droplets, as presented in § 3.5.1. During this process, the thinned membrane-like part of the liquid sheet vibrates vertically with increasing amplitude. This fluctuation of velocity generates radial oscillatory acceleration that leads to instantaneous deceleration of the sheet. The calculated acceleration corresponding to radial velocity in figure 6(a) is given in figure 14.
(a) Radial acceleration of the rim with time during radial propagation for the rim (thinning regime) before initiation of breakup and calculated from figure 6(a), (b) RT instability dimensional growth rate as a function of dimensional wavenumber and (c) an experimental image showing the generation of droplets in the radial direction due to the RT instability. The image in (c) is from imaging at 14 485 fps.

The development of Faraday instability leads to the ejection of droplets from the membrane-like sheet, and the corresponding formation of holes. The simultaneous radial stretching of the perforated thin liquid sheet results in the formation of ligaments. These ligaments then break into droplets by a RP instability. The formation of ligaments in the radial direction and their subsequent breakup is further exacerbated by the RT instability as shown in the figure 14(c) (for more clarity, see figure S11 and movie 6 provided in the SI). The dispersion relation for the RT instability and its wavelength is given by (Jarrahbashi & Sirignano Reference Jarrahbashi and Sirignano2014; Sharma et al. Reference Sharma, Singh, Rao, Kumar and Basu2021)
 \begin{equation} \omega_{RT}= \left(\frac{a_r (\rho_L - \rho_a) k_{RT} - k_{RT}^3 \sigma}{\rho_L + \rho_a}\right)^{1/2}, \end{equation}
where  $a_r$ is the acceleration, and
 $\omega _{RT}$ is the dimensional growth rate. The corresponding most unstable wavelength is determined as
 \begin{equation} \lambda_{RT} = 2 {\rm \pi}\sqrt{\frac{3\sigma}{a_r (\rho_L - \rho_a)} }. \end{equation}
The maximum radial acceleration measured on the rim is  $29\,000\,{\rm m}\,{\rm s}^{-2}$ (see figure 14), and the corresponding azimuthal wavelength, as measured in experiments, is 0.338 mm. The calculated wavelength by the (4.18) is equal to 0.329 mm, indicating a fairly good agreement with the experiments.
The breakup of the thinned membrane-like sheet at the equatorial region of the droplet results in delayed breakup of the rim. This is important because, even before the rim breaks, the RT and Faraday instabilities already start generating a significant number of droplets in the highly perforated sheet preceding the rim. Aided by these perforations, the rim ultimately partly separates and undergoes breakup by the RP instability.
It is useful to mention here that, even before the sheet breakup starts, the azimuthal deformation observed in the rim is observed only after the vertical oscillation (see figure 7a) of the thinned membrane-like sheet is amplified. The membrane-like sheet preceding the rim, when sufficiently thin, oscillates in a vertical direction while radially propagating in the air (in the thinning regime), which results in the azimuthal deformation on the rim (see figure 7c,d) on account of the RT instability. The azimuthal wavelength of the rim compares well with the most unstable wavelength of the RT instability. These azimuthal undulations, in fact, propagate backward and create radially propagating azimuthally distributed undulations.
As the sheet keeps ejecting droplets by Faraday instability in a direction perpendicular to the plane of the sheet, and droplets are generated by RT and RP instabilities in the direction of radial expansion of the sheet, the liquid sheet subsequently breaks into droplets of larger diameter with a corresponding decrease in the liquid velocity; the merging of ligaments leads to the accumulation of drops that re-forms the rim as the capillary force overcomes the inertia force (see figure S6).
4.5. Mechanism of secondary breakup
This section includes the mechanism behind the secondary breakup (after the equatorial breakup). The secondary breakup includes umbrella breakup, bag breakup, bubble breakup and multi-stage breakup.
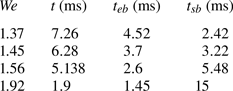
The dynamics of atomisation at the equatorial region strongly depends upon  $We$ (for example, the diameter of the undeformed levitated droplet). Table 1 shows the equatorial breakup time (
 $t_{eb}$) as a function of
 $We$. Equatorial breakup time decreases with the increase in
 $We$ (say through an increase in initial droplet diameter), indicating that the acoustic field hastens the dynamics of the system. Since the rapid equatorial breakup at high
 $We$ leads to a greater reduction in the flattened droplet after retraction, it takes longer for the droplet to initiate the secondary instability, as indicated by a longer
 $t_{sb}$.
The deformation time (stretching + thinning)  $(t)$, equatorial breakup time (
 $t_{eb}$) and secondary breakup time (
 $t_{sb}$) as a function of
 $We$. Note:
 $t_{sb}$ represents the time interval between the end of equatorial atomisation and the start of the secondary breakup.
The different types of interfacial instabilities that appear on the liquid sheet during secondary breakup are shown in figure 15. The mechanism of each will be discussed in the following sections.
Development of different kinds of interfacial instabilities during the secondary mode of breakup: (a) umbrella breakup, (b) bag breakup, (c) bubble breakup and (d) multi-stage breakup.

4.5.1. Mechanism of umbrella breakup
The umbrella breakup occurs for  $1.37\le We < 1.45$, i.e. for smaller droplets, and the main experimental observations are reported in § 3.6.1. In this mode, a droplet, after undergoing the typical equatorial breakup and rim retraction, bends upwards to form a convex-shaped stretched droplet sheet resembling an umbrella when
 $We$ is low. With increasing
 $We$ the curvature of the umbrella increases. Once the umbrella is formed and the umbrella-shaped droplet stretches further to again get into the thinning regime, equatorial breakup and KH as well as Faraday waves obeying the condition of frequency of the vibrating sheet to be half that of the applied frequency, start to appear on the surface of the liquid sheet.
To confirm this, the wave velocity was measured by extracting the images frame by frame during wave propagation on the surface of the liquid sheet and was found to be of the order of  $2.5\,{\rm m}\,{\rm s}^{-1}$. By assuming that this velocity is equal to the liquid velocity, the corresponding thickness was determined by the Taylor–Cullick criterion to be equal to
 $8.5\,\mathrm {\mu }{\rm m}$. The wavelength,
 $65 \,\mathrm {\mu }{\rm m}$, and the corresponding frequency of oscillation of the capillary waves, (4.16), agree well with the calculated oscillation frequency (
 $\omega _0$) of
 $127.1\,{\rm K}\,{\rm rad}\,{\rm s}^{-1}$, which is half of the imposed acoustic frequency (
 $251.2\,{\rm K}\,{\rm rad}\,{\rm s}^{-1}$), indicating a sub-harmonic condition. Thus, the Faraday wave appears on the entire surface of the liquid sheet.
Radial capillary waves are then observed on the umbrella sheet. It should be noted that the capillary wavelength can be theoretically estimated as  ${U_L}/{f} = 62.5\,\mathrm {\mu }{\rm m}$, which demonstrates a surprisingly good agreement with the measured wavelength. Once the capillary wave appears on the surface, the instability pattern changes at different locations of the liquid sheet, as shown in figure 10. This may be because of the uneven thinning (locally) of the liquid sheet that causes the development of different modes of Faraday instability. The Faraday instability leads to perforation of the stretched umbrella-like liquid sheet leading to the merging of the ligaments and their breakup due to RP instability. For better clarity, the capillary wave propagation on the surface of the liquid sheet in the sub-harmonic condition can be seen in movie 7 as capillary wave formation. This top-view movie was recorded by focusing on the liquid sheet surface at 140 000 fps.
4.5.2. Mechanism of bag breakup
As discussed in § 3.6.2 in detail, bag breakup occurs ( $1.45 \le We < 1.56$) when the deflected convex membrane-like sheet at the end of the equatorial breakup is not thin enough to undergo umbrella breakup.
The vertical movement  $(z)$ during bag development and subsequent ejection of the tiny-sized droplets perpendicular to the liquid sheet due to Faraday instability (see movie 5 and figure S12 in the SI) occur as the thickness of the liquid sheet decreases and reaches the sub-harmonic condition. Figure 16 shows the distance travelled
 $(z)$ in the upward direction and the corresponding velocity and acceleration of the liquid sheet during bag growth. It is seen that
 $z$ increases (moves upwards) exponentially with time before the initiation of a hole in the sheet (1 ms), commensurate with the increase in the time-averaged velocity
 $\overline {V_z}$ for a period of 1 ms. The periodic acceleration and deceleration of the liquid sheet in the vertical direction during bag formation (figure 16b) is associated with a corresponding acceleration and deceleration in the radial direction, along the rim, suggesting the possibility of RT instability. The RT wavelength estimated corresponding to the maximum acceleration/deceleration of the bag (
 $12\,500\,{\rm m}\,{\rm s}^{-2}$) is
 $\lambda _{RT} = 0.502$ mm. The measured wavelength (
 $\lambda _{RT}$) of the deformed liquid rim during upward propagation of the bag is equal to 0.72 mm as indicated in figure 15(b) by top-view visualisation. The theoretical and measured values agree reasonably well, suggesting that the RT instability may be responsible for the deformation of the bag rim.
(a) The upward movement  $(z)$ of the liquid sheet, vertical instantaneous velocity (
 $V_z$), time-averaged velocity (
 $\overline {V_z}$), (b) vertical acceleration (
 $a_z$) during transformation from flattened liquid sheet to bag like structure and (c) the selected image from figure S12 at different times to show the secondary bag breakup (Faraday) process. The vertical movement is calculated by focusing on the centre of the liquid sheet. Here,
 $t_{bag}$ denotes the time measured from the end of the equatorial breakup to the start of secondary breakup.

As the bag stretches and thins, the thickness of the stretched bag reduces. This thickness reduction of the flattened drop plays an important role in the secondary breakup and depends upon  $We$. The sub-harmonic condition is realised only when the liquid sheet frequency increases to the order of half of the imposed acoustic frequency. The reduction in thickness is assisted by capillary waves of wavelength
 $65\,\mathrm {\mu }{\rm m}$ that appear on the surface of the liquid sheet, as shown in figure 16(c ii). As soon as the thickness reduces to reach the sub-harmonic conditions, an instability sets in with the appearance of Faraday waves on the surface of the liquid sheet (see waves in figure 15(b) from the top and 16(c ii) from the side) and droplet ejection is initiated as shown in figure 16(c). For comparison, figure 16(c i) shows the surface of the liquid sheet before the sub-harmonic condition. The Faraday waves become unstable, resulting in the ejection of the tiny-sized droplets perpendicular to the liquid sheet (see figure 16c iii). The ejected tiny-sized droplets can be seen in figure 16(c iv). The reader is advised to see movie 5 and figure S12 in the SI for more clarity. The recorded video, intended to visualise the Faraday instability (movie 7) on the surface of the bag, is captured at a frame rate of 140k fps.
The ejection of the droplets due to Faraday instability creates holes (see the first image of figure S13 in the SI) in the stretched sheet. A few such holes are formed, which expand radially with the formation of the liquid rim at the edge. The hole rim thickness increases during hole expansion. The expansion of the holes creates interconnected ligaments which become unstable due to RP instability and break into the droplets. This process continues until the completion of the breakup of the entire liquid sheet. Movie 8 provides a nice illustration of how the liquid sheet has changed into thick ligaments during perforation, which then break into larger-sized droplets. This video was recorded at 72 000 fps providing the top view. To calculate the rate of expansion of the hole with time, the temporal evolution of the diameter of the hole was measured, while focusing on 3 such selected holes. Figure S13 (b) presents the change in the holes’ diameters with time.
The expansion of the hole diameter ( $d_h$) with time for 3 such holes with typical velocities of the order of
 $0.4-0.5\,{\rm m}\,{\rm s}^{-1}$ is provided in figure S13(b) in the SI. The hole expansion at a constant velocity of a perforated liquid sheet is also reported by Liu et al. (Reference Liu, Zhang, Li and Zhao2022), Fraser et al. (Reference Fraser, Eisenklam, Dombrowski and Hasson1962), Taylor (Reference Taylor1959) and Culick (Reference Culick1960). Contrary to this, some researchers have observed exponential growth (Debrégeas, Martin & Brochard-Wyart Reference Debrégeas, Martin and Brochard-Wyart1995; Roth et al. Reference Roth, Deh, Nickel and Dutcher2005; Savva & Bush Reference Savva and Bush2009). Our results seem to show an onset of exponential growth
 $d_h$ with time (see figure S13(b), 2 and 3) at a later stage. In this case, the exponential velocity increases with time. The expansion diameter
 $d_h \sim \exp (t/\tau )$ is identical to the observation of Debrégeas et al. (Reference Debrégeas, Martin and Brochard-Wyart1995).
4.5.3. Mechanism of bubble breakup
The observation of the bubble breakup is reported in § 3.6.3. The bubble breakup occurs for  $1.56 \le We < 1.92$. When the droplet size is increased such that, during bag formation, its thickness does not reduce to an extent necessary to admit sub-harmonic conditions, the liquid sheet takes a near bubble-like (see figure S9 in the SI) structure. The bubble further expands due to the pressure differences between the inside and outside of the bubble resulting in a further decrease in its thickness. As the thickness reduces to attain harmonic conditions, nonlinear Faraday waves appear on the surface of the liquid, as shown in movie 9 and figure S14 in the SI. The nonlinear standing wave pattern (Zhang, Orosco & Friend Reference Zhang, Orosco and Friend2023) is quite different from bag and umbrella breakup and can be seen by carefully observing the surface of the bubble (see figure 15c). The measured wavelength is equal to
 $65\,\mathrm {\mu }{\rm m}$, confirming it to be a Faraday wave. This results in hole formation due to the ejection of droplets due to Faraday instability, ligament formation due to hole rearrangement and the breakup of ligaments due to RP instability, as discussed in § 4.5.2. The rim can then dramatically close back and the bubble can show one more round of bubble expansion, finally leading to complete atomisation by a combination of Faraday and RP instabilities.
4.5.4. Mechanism of multi-stage breakup
The multi-stage breakup takes place for larger droplets with  $We > 1.92$. In this case, bag formation commences during equatorial breakup. The duration of an equatorial breakup is very small for a multi-stage breakup. Thus a very small volume of the droplet is lost due to the ejection of the liquid at the edge. The rim thickness increases as the liquid flowing from inside the droplet accumulates at the edge. As a consequence, instead of closing like a bubble, the bag's rim begins to expand in a radial direction followed by the formation of a thin liquid sheet and subsequent development of Faraday instability at its thinnest region (see figure 15d). The breakup occurs in stages similar to the equatorial breakup. The Faraday wavelength is equal to
 $65\,\mathrm {\mu }{\rm m}$ at the thinnest region, indicating a sub-harmonic condition. The rim deformation in the azimuthal direction and its wavelength is equal to 0.34 mm. This rim deformation is triggered through RT instability, which is similar to equatorial breakup. The complete explanation is shown in the movie 10. This movie is presented after bag formation.
4.5.5. Summary of secondary breakup
It thus appears that (see table 1) for low  $We$, the long stretching and thinning time (
 $t$), as well as the long equatorial breakup time (
 $t_{eb}$), lead to a nearly uniform thinning of the sheet, which gives rise to umbrella breakup wherein the entire sheet undergoes Faraday instability, whereby the secondary breakup time (
 $t_{sb}$) is small. At the other extreme, at high
 $We$, the fast stretching of the sheet results in only a small membrane-like region at the edge of the flattened droplet getting thinned, while the rest of the flattened droplet continues to have a considerable thickness. The breakup, therefore, continues only around the equatorial rim, in a series of localised events, leading to the multiple breakup mode.
5. Droplet size distribution
The experimental results and mechanisms responsible for the droplet breakup are presented in the earlier sections. Faraday, RP and RT instabilities are developed on the interface of the liquid sheet (formed from the original droplet by thinning), which cause the breakup of the liquid sheet into smaller-sized droplets. Since each instability is associated with its own unstable wavelength and corresponding nonlinearities, this leads to a very complex size distribution of droplets resulting from the atomisation. This section includes the size distribution of droplets generated during different regimes of the breakup. The droplet size was measured using Image J software. The estimated error associated with the droplets counted to be in focus was observed to be  ${\pm }5\,\%$.
5.1. Droplet size distribution during equatorial breakup
The size distribution of the droplets generated in the radial direction and normal (vertical) direction during atomisation at the equator of the expanding liquid sheet is shown in figure 17. The total breakup time at the equatorial region ( $t_{eb}$) depends on
 $We$ (see table 1) and for the droplet breakup presented in figure 17, this is around 2.8 ms. The equatorial breakup time
 $t_{eb}$ is the time from the start (
 $t'=0$) (end of the thinning stage) to the end of the atomisation process at the equatorial region (
 $t'=t_{eb}$) and therefore the size distribution of the generated droplets varies with time between
 $t'=0$ and
 $t_{eb}$. The droplet breakup is a consequence of manifestation of (i) Faraday, (ii) RT and (iii) RP instabilities. The droplet generation perpendicular to the sheet is due to the Faraday instability. On the other hand, the vertical oscillation of the sheet creates radial acceleration that causes RT instability. The ligaments and rim break by the RP instability.
Droplet size distribution at the equatorial region at different instants of breakup time during any typical primary breakup event. The total breakup time is approximately  $t_{eb} = 2.8$ ms. The total duration of the equatorial breakup (
 $t_{eb}$) is presented as: (a)
 $t' = 0$ ms to
 $t' = 0.25$, (b)
 $t' = 0$ ms to
 $t' = 0.25$ for side view corresponding to (a,c)
 $t' = 0.25$ ms to
 $t' = 0.75$, (d)
 $t' = 0.75$ ms to
 $t' = 1.5$ ms, (e)
 $t' = 1.5$ ms to
 $t' = 2$ ms, and (f)
 $t' = 2$ ms to
 $t' = 2.65$ ms. The time
 $(t')$ in this figure indicates the time at that image. The corresponding top- and side-view visualisation images are available in movie 4.
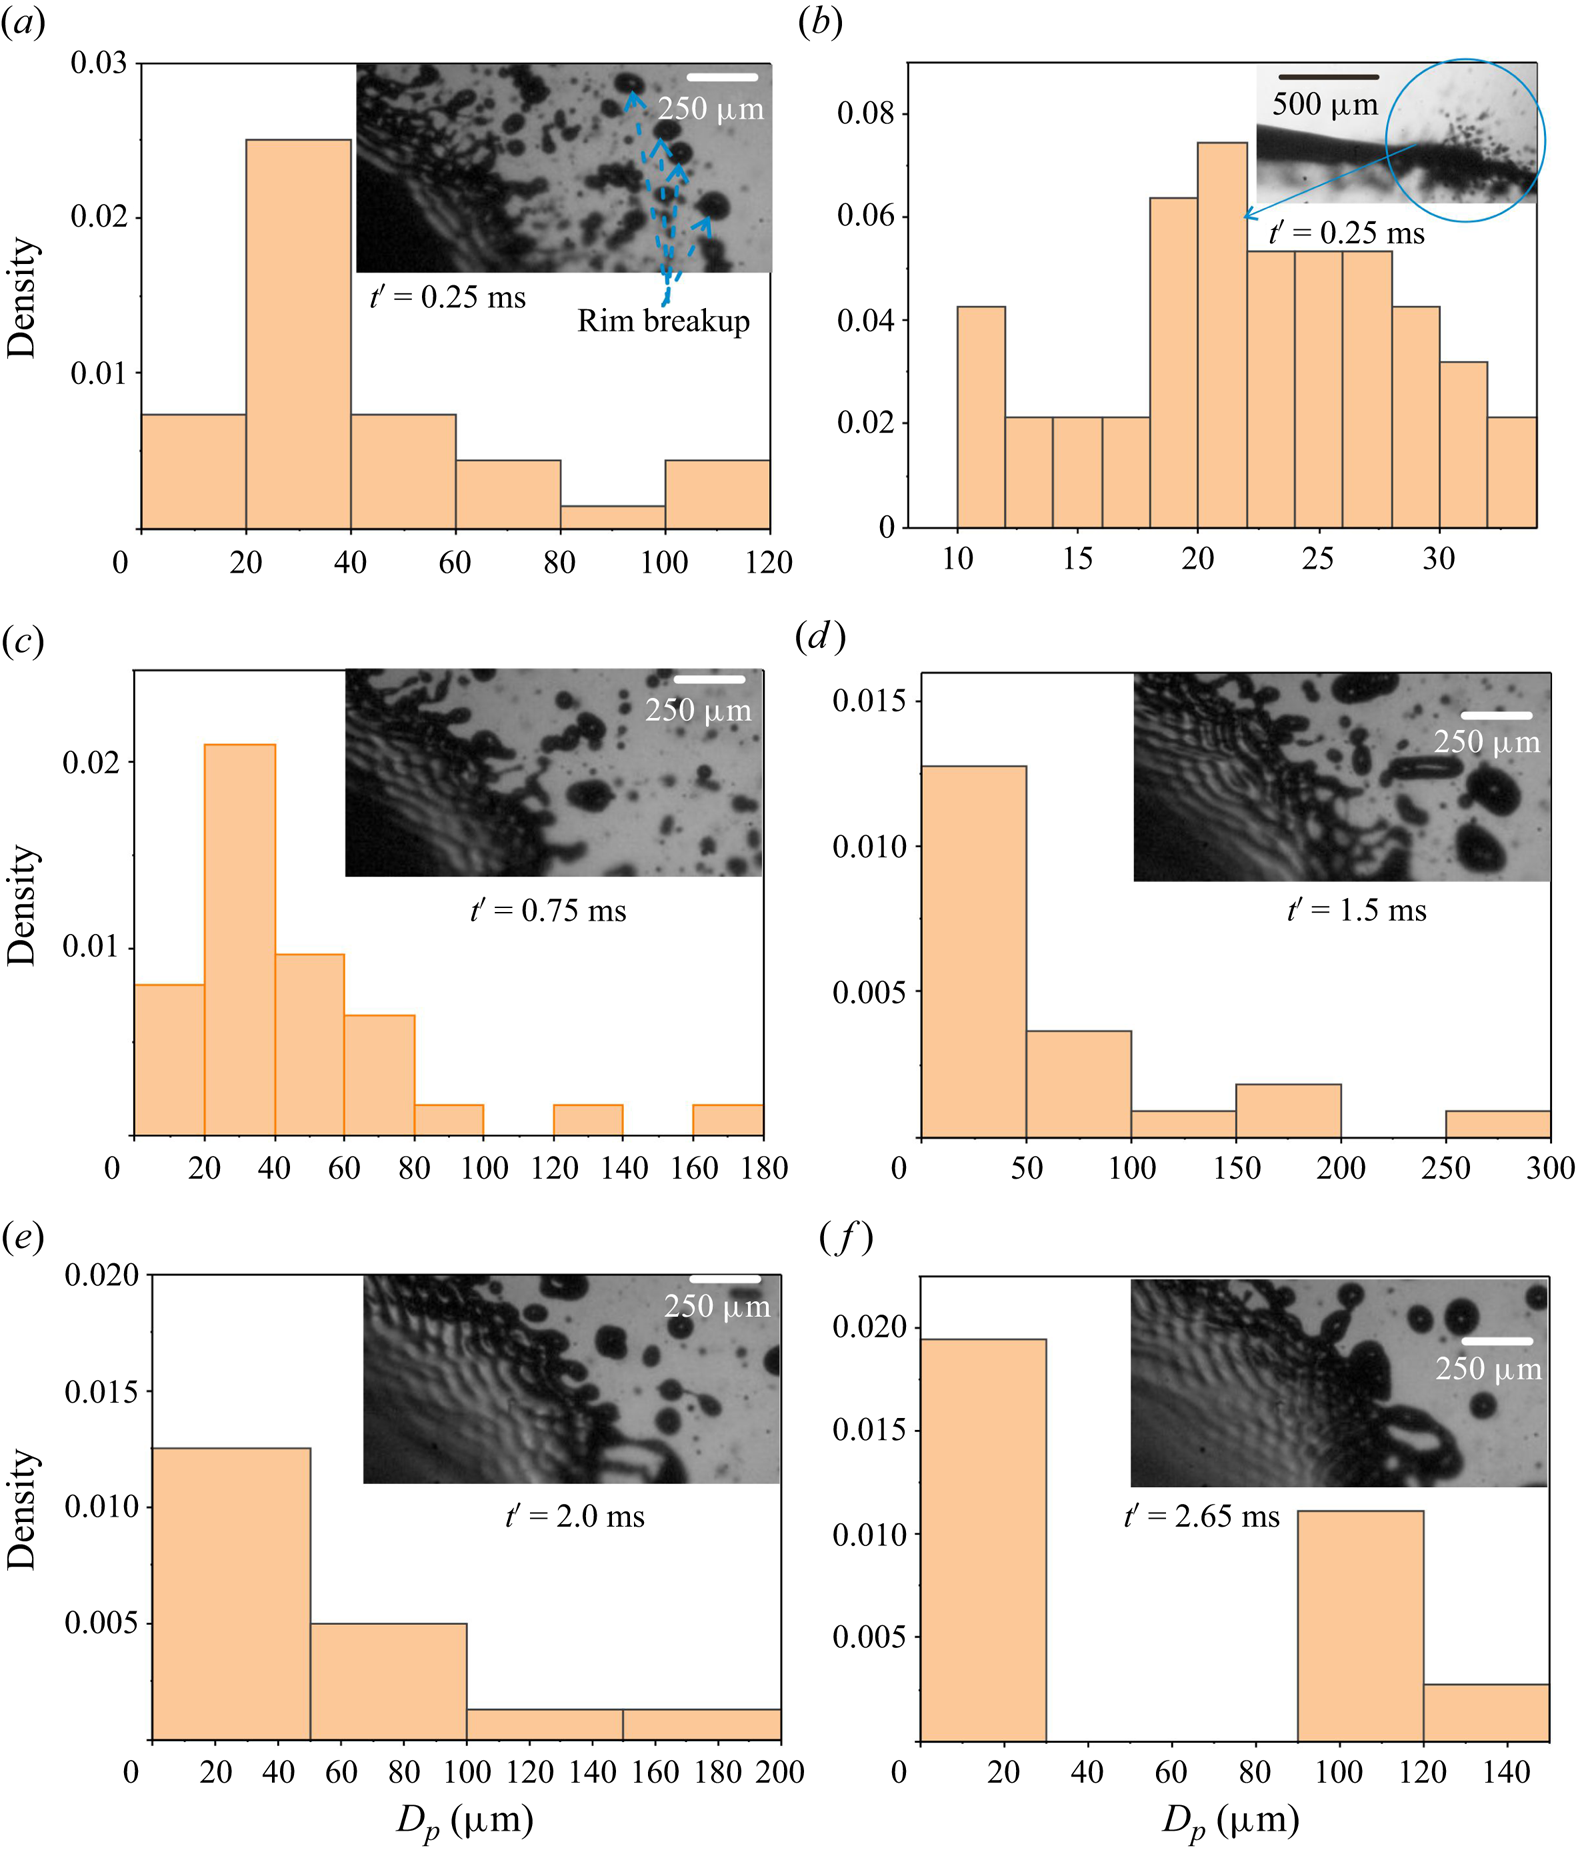
The droplet size distribution is presented as the number fraction for different-sized bins. The distribution  $t'=0.25$ ms is shown in figure 17(a). The droplet size distribution here includes rim breakup (indicated by arrow), the RP breakup of merging ligaments of a perforated liquid sheet and small-sized droplets generated due to the Faraday instability. These are in fact well captured in figure S5 (provided in the SI). The size of the droplets generated from the rim breakup varies from 100 to
 $120\,\mathrm {\mu }{\rm m}$. The droplets generated due to the merging of thin ligaments of perforated sheet vary from 40 to
 $80\,\mathrm {\mu }{\rm m}$. The contribution of the RT instability is not significant up to this point. The droplet size distribution generated by Faraday instability perpendicular to the liquid sheet during the equatorial breakup can be seen in figure 17(b). The number of generated droplets measured in the analysis is around 50. The droplet size distribution is found to be in the range of
 $20\unicode{x2013}34\,\mathrm {\mu }{\rm m}$.
For the droplet size distribution at  $t'=0.75$ ms, most of the droplets generated at
 $t'=0.25$ ms would have gone out of the frame such that the image mostly has droplets that are generated in the time period
 $t'=0.25{-}0.75$ ms (see figure 17c). As the rim separates from the thin liquid sheet, the thin liquid sheet vibrates vertically and generates a radial acceleration, resulting in the radial generation of droplets due to RT instability. The mechanism of formation of radially generated droplets due to RT instability was discussed in the earlier § 4.4.3. The size of the droplets varies from 60 to 80
 $\mathrm {\mu }{\rm m}$. The smaller-sized droplets (
 $20\unicode{x2013}34\,\mathrm {\mu }{\rm m}$) in this distribution correspond to the Faraday instability, which continues to be at play.
The RT instability is suppressed as the liquid velocity decreases with time (deceleration of the liquid sheet). In this regime ( $t'= 0.75\unicode{x2013}1.5$ ms) the breakup takes place because of combined RT and RP instability, as shown in figure 17(d), to yield droplets of size 100–200
 $\mathrm {\mu }{\rm m}$. The larger-sized droplet in figure 17(d) is also because of the merging of the droplets (see figure S15).
The equatorial breakup continues with a weakening of the RT instability with time (see figure 17e). The process of merging droplets is significantly suppressed here, whereby larger-sized droplets ( ${>}200\,\mathrm {\mu }{\rm m}$) are not formed (
 $t'= 1.5\unicode{x2013}2.0\,{\rm ms}$).
The RP breakup takes over the RT instability between  $t'= 2$ ms and
 $t'= 2.65$ ms which can be clearly seen in figure 17(f). The deceleration of the sheet and relative acceleration lead to the suppression of RT instability. Moreover, the thinning region reduces in extent. The prevailing vertical generation of the droplet causes perforation and separation of the edge rim of the liquid sheet to create liquid threads and ligaments which break into droplets by RP breakup (see figure S16 for more clarity). The Faraday instability too seems to have reduced at this point. The reader is suggested to refer to the movie provided in the SI for more information.
5.2. Droplet size distribution during secondary breakup
The droplet size distribution of tiny droplets produced from the Faraday instability during the formation of the convex-deformed sheet, on the verge of undergoing secondary breakup, is shown in figure 18(a). Droplet size distribution is measured over 10 consecutive images captured at 48 000 fps (measured from figure S12 in the SI). The sizes of the droplets are found to vary in the range of 20–34  $\mathrm {\mu }{\rm m}$, similar to those formed during equatorial breakup, thereby confirming their formation by the Faraday instability. The droplet size distribution of the generated droplets in the case of a droplet showing bag breakup as a secondary mode of breakup after the sheet perforation is shown in figure 18(b). The size of the droplets varies between 100 and 200
 $\mathrm {\mu }{\rm m}$, confirming that the droplets break due to RP instability (rather than RT instability). The larger-sized droplets are measured from both side-view as well as top-view visualisation experiments. The inset images in figure 18(b) illustrate the generation of larger-sized droplets due to RP instability after sheet perforation.
Droplet size distribution of droplet ejected during bag development: (a) tiny droplets (Faraday breakup) and (b) larger droplets (after sheet perforation due to RP instability). The video illustrating tiny-sized droplet ejection during bag breakup can be found at movie 5.

Much larger droplets are formed by the liquid rim breakup as well as the merging of ligaments and residual liquid sheets, whether perforated or not, that collapse and form ligaments. These droplets have a larger diameter of  $300$ to
 $700\,\mathrm {\mu }{\rm m}$. This is clearly demonstrated in movie 4. This phenomenon occurs not only for complete bag breakup, but also for other regimes such as umbrella, bubble and multi-stage. Therefore, it can be concluded that the large droplets are always a result of liquid rim breakup and the breakup of ligaments formed by the merging of the residual liquid sheets.
6. Conclusions
An experimental investigation of the breakup dynamics of a single droplet levitated in the acoustic field is carried out for different sizes of a droplet (thereby changing the  $We$). Both top- and side-view imaging are performed at a significantly higher frame rate (4000 fps to 140k fps) to understand the mechanism underlying the breakup process and visualise the associated interfacial instabilities. The droplet deforms with an increase in
 $We$ without any atomisation for
 $We \le 1.36$. For
 $We > 1.36$, the droplet first transforms into a flattened, cylindrical liquid sheet during the stretching regime followed by the thinning at the edge. A slow increase in the stretching velocity is observed during the stretching period, while the thinning regime exhibits an abrupt acceleration. Our theoretical model agrees well with the experimental results for the stretching regime. The radial expansion in the thinning regime is highly nonlinear and an empirical relationship based on
 $We_{L}$,
 $We$ and non-dimensional time scale
 $(T)$ that explains both the stretching as well as thinning regimes is proposed. The thickness reduces at a faster rate in the thinning regime. As the thickness reduces to admit the sub-harmonic condition, the sheet vibrates in the vertical direction. A nonlinear (Faraday) wave appears on the surface of the thin liquid sheet. The Faraday instability causes the ejection of smaller droplets perpendicular to the sheet. This droplet ejection creates holes in the membrane-like region of the flattened droplet, resulting in perforation of the liquid sheet. The liquid rim is then detached from the liquid sheet and breaks due to RP instability. The capillary (sinuous) wave results due to the vertical vibration of the liquid sheet. The vertical vibration induces radial acceleration and deceleration at the liquid–air interface (rim) resulting in the formation of the radial ligaments because of the development of RT instability. The sizes of the droplets generated during the entire atomisation process are related to the different types of interfacial instabilities that develop (Faraday, RT and RP instability) during equatorial breakup. The results of the experimental measurement show that, although the pattern of the Faraday waves changes throughout all regimes, their wavelength remains constant. This suggests a parametric instability of the imposed wavelength on the sheet, (
 $\lambda \sim U_L/f$, using the maximum
 $U_L$ (
 $2.5\,{\rm m}\,{\rm s}^{-1}$)).
The edge breakup of the droplet is followed by secondary breakup, wherein the flattened pancake-like droplet develops convex-upward deformation on the scale of  $R$, the size of the flattened droplet, thereafter secondary breakup is observed. The secondary breakup of the liquid sheet depends on
 $We$. The umbrella breakup for
 $1.37 \le We < 1.45$, bag breakup for
 $1.45 \le We < 1.56$, bubble breakup for
 $1.56 < We \le 1.92$ and multi-stage breakup for
 $We > 1.92$ are observed experimentally. The mechanism of the breakup of the liquid sheet at different modes is discussed in detail. Experimentally measured wavelength, observed in the secondary breakup, is compared with that calculated from the dispersion relation of the corresponding instability.
Thus, an acoustically levitated droplet can exhibit myriad complex phenomena that present significant challenges in theoretical predictions of the various involved instabilities, that are further exacerbated by the transient nature of the process. The work, however, demonstrates a variety of phenomena that could be harnessed judiciously while designing a large-scale atomiser based on acoustic fields.
Supplementary material and movies
Supplementary material and movies are available at https://doi.org/10.1017/jfm.2024.523.
Acknowledgements
The authors acknowledge the Central Facility, High Speed PIV Lab of Indian Institute of Technology Bombay for the visualisation experiments. The authors also acknowledge useful discussions and derivations with Professor Y.S. Mayya. S.K.S. also acknowledges the IIT Bombay Institute Post Doctoral Fellowship scheme.
Declaration of interests
The authors report no conflict of interest.
Appendix A. Standing sound wave and pressure distribution
A.1. Basics of standing sound wave
Consider an incident sound wave of frequency  $f= 40$ kHz, such that
 $\omega =2 {\rm \pi}f$. The wavelength of the sound wave is given by the distance it covers in 1 cycle, i.e.
 $1/f$. Thus
 $\lambda =2 {\rm \pi}/k=c_o/f$, where
 $c_o$ is the velocity of sound, that is
 $c_o=\omega /k$. For the present case,
 $\lambda = 8.5$ mm. The levitator has an end-to-end distance
 $L= 90$ mm, the number of the nodes where the droplet can be levitated (in the absence of gravity) can be obtained by
 $z_n = (n \lambda /2)+(\lambda /4)$. The number of the nodes
 $(n)$ for the length
 $L=z_n$ is equal to
 $\sim$20. This is exactly equal to our calculations made using COMSOL Multiphysics software. While the actual pressure distribution in the TinyLev levitator is more involved due to multiple emitters and receptors, in the simplest case, the incident pressure wave associated with a single standing sound wave is given by (Andrade, Pérez & Adamowski Reference Andrade, Pérez and Adamowski2018)
 \begin{equation} P_1= P_0 \cos(k_n z) \cos(\omega t), \end{equation}
with associated density field
 \begin{equation} \rho_1= \frac{P_0}{c_o^2} \cos(k_n z) \cos(\omega t), \end{equation}
with  $k_n$ given by
 \begin{equation} k_n = \frac{ {\rm \pi}}{2L} (2n+1), \end{equation}
and  $n$ is an integer. In a standing wave, the nodes occur at
 $z_n = (n \lambda /2)+(\lambda /4)$. For example, in a single-axis levitator, the first node occurs at
 $z_n=z_1=3\lambda /4$. The associated velocity field with the standing sound wave that satisfies
 $\rho _o ({\partial u_1}/{\partial t})=-\boldsymbol {\nabla } P_1$, is given by
 \begin{equation} u_1=\frac{P_0}{\rho_a c_0} \sin(k_n z) \sin(\omega t). \end{equation}
The root-mean-square (r.m.s.) velocity associated with this pressure  $\langle u_1^2\rangle$ is given by
 \begin{equation} U^2 = \langle u_1^2\rangle =\left(\frac{P_0}{\rho_a c_0}\right)^2 \frac{\int_{0}^{T={2{\rm \pi}}/{\omega}} \sin^2(\omega t) \,{\rm d}t }{\dfrac{2{\rm \pi}}{\omega}} \sin^2{k_n z}. \end{equation}
Thus the r.m.s. velocity at the nodes is given by
 \begin{equation} U =\frac{P_0}{\rho_a c_0} \frac{1}{\sqrt{2}}. \end{equation}
A.2. The net radiation pressure
The Bernoulli equation associated with the sound wave to second order gives
 \begin{equation} \boldsymbol{\nabla} \langle P_2\rangle ={-}\left\langle \rho_1 \frac{\partial u_1}{\partial t}\right\rangle -\rho_a \langle u_1\boldsymbol{\cdot}\boldsymbol{\nabla} u_1\rangle. \end{equation}
The time-averaged radiation pressure can be given as
 \begin{equation} \langle P_2 \rangle =\frac{\langle P_1^2 \rangle}{2 \rho_a c_0^2}-\frac{\rho_a \langle u_1^2 \rangle}{2}=\frac{P_o^2}{4 \rho_a c_0^2}( \cos^2{k_n z}-\sin^2{k_n z}). \end{equation}
The associated Gorkov potential is given by
 \begin{equation} U_{Gorkov}=\frac{P_o^2}{4 \rho_a c_0^2}\left( \frac{\cos^2{k_n z}}{3}-\frac{\sin^2{k_n z}}{2}\right). \end{equation}
Integrating over a sphere, one gets
 \begin{equation} F_{rad} \boldsymbol{e_z}=\frac{5 {\rm \pi}R^3 k P_o^2}{6 \rho_a c_0^2} \sin{(2 k_n z)} \, \boldsymbol{e_{z}}. \end{equation}
When the weight of the droplet is balanced by the acoustic radiation force, the droplet is levitated slightly below the node through the equation
 \begin{equation} F_g ={-}\rho_L g\frac{4 {\rm \pi}R^3}{3}\boldsymbol{e_{z}}, \end{equation}
where  $F_g$ is the weight of the droplet. For our experimental conditions, this gives the position of the levitated droplet below the node as
 $z_{lev}=-0.3\,{\rm mm}$, with
 $z$ measured from the node.
A.3. Pressure around the droplet in the presence of a droplet
Consider the flow around stagnation point, figure 11, where the velocity distribution is approximated by  $U_x = -(\gamma /2)$ x,
 $U_y = -(\gamma /2)$ y,
 $U_z = \gamma$ z, where
 $\gamma = f_s ({U}/{d_0})$ and
 $U^2=U_x^2+U_y^2+U_z^2$. The Bernoulli equation can be written and simplified as
 \begin{gather} P_a(0,z)\approx P_a(0) = P_a(r,z) + \frac{\rho_a U^2}{2}, \end{gather}
 \begin{gather} P_a(0) = P_a(r,z) + \frac{\rho_a \gamma^2}{2} (U_x^2 + U_y^2 +U_z^2), \end{gather}
 \begin{gather} P_a(0) = P_a(r,z) + \frac{\rho_a \,f_s^2 U^2}{2 d_0^2} (z^2+\frac{r^2}{4}), \end{gather}
 \begin{gather} P_a(r,z) = P_a(0) - f_s^2\frac{\rho_a U^2}{2 d_0^2} z^2- f_s^2 \frac{\rho_a U^2}{8 d_0^2} r^2. \end{gather}
A.4. Pressure distribution inside the acoustic levitator using COMSOL multiphysics
The COMSOL Multiphysics 6.0 (COMSOL Inc.) software that simulates the acoustic levitator's pressure field distribution is used in the analysis. The Pressure Acoustics, Frequency Domain model is selected. Plane-wave radiation is assumed in this simulation and the analysis is restricted to two dimensions  $(x,y)$. While the experimental system is indeed three-dimensional, predominantly axisymmetric or nearly axisymmetric, the calculations in two dimensions are designed for ease of computation and to get more insights into the physics of the problem. Specifically, the objective was to understand the quasi-static, time-averaged variation in pressure distribution in the presence of a deformed droplet (the two-dimensional projected shape of which was picked from experiments, at different time intervals).
The following governing equation (Helmholtz equation) is solved to get the pressure distribution due to the acoustic field:
 \begin{gather} \frac{1}{\rho_a}\nabla^2 p_t +\frac{k_{eq}^2}{\rho_a} p_t = 0, \end{gather}
 \begin{gather} k_{eq}^2 = \left( \frac{\omega}{c} \right)^2 - k_z^2, \end{gather}
where  $p_t = p_b +p_s$; here,
 $p_t$,
 $p_b$ and
 $p_s$ are total pressure, background pressure field (assumed atmospheric) and scattered pressure field, respectively. Frequency
 $\omega = 2{\rm \pi} f$,
 $f = 40k$ Hz and the out of plane wavenumber
 $k_z=0$. The geometry for the computational domain has been chosen according to the experimental set-up. The system is approximated by two spherical cups of diameter 4.5 cm, at the top and bottom as acoustic field sources. The centre-to-centre distance between the cups is 9 cm. The boundary condition at the cup's surface is the constant pressure condition, the value of which is the summation of each transducers in the cup, i.e. 720 Pa (Marzo et al. Reference Marzo, Barnes and Drinkwater2017), in conformity with the experimental system. The detailed derivation of the governing equations is available in the Comsol multiphysics documentation (Comsol 2020). The acoustic pressure field distribution obtained inside the acoustic levitator is shown in figure 19. The peak amplitude (pressure at anti-node) is equal to 2400 Pa. The number of nodes is equal to 20.
Acoustic pressure field distribution in the acoustic levitator in the absence of the droplet as obtained by COMSOL multiphysics.

A.5. Pressure re-distribution due to the presence of a particle in an acoustic field
The presence of a particle (liquid droplet in this case), significantly and non-trivially alters the ambient undisturbed pressure distribution due to the standing sound wave. We have used the COMSOL multiphysics software to get the acoustic radiation pressure distribution around a droplet placed in a standing wave acoustic field. Our experimental observation suggests that the droplet shape changes with time in the standing wave. Therefore, different aspect ratios of the deformed droplet were chosen according to the experimental results, which cover the different regimes of dynamics of droplets in the acoustic field. The density, surface tension and sound speed of the droplet fluid are  $830\,{\rm kg}\,{\rm m}^{-3}$,
 $22\,{\rm mN}\,{\rm m}^{-1}$ and
 $1540\,{\rm m}\,{\rm s}^{-1}$, respectively. The obtained simulation results are presented in figure 20. Figure 20(a) shows the distribution of the radiation acoustic pressure without any droplet. As the droplet is placed in a standing wave, the sound waves are scattered around the droplet such that the maximum pressure is at the pole region (
 $P_{(o)}$) and the minimum pressure is around the equatorial region (
 $P_{(R,0)}$) (figure 20b). The corresponding change in the pressure difference between the pole and equator (
 $P_{(o)} - P_{(R,0)}$) for different aspect ratios is presented in figure 20(g), where P and E indicate the pole and equator, respectively, as marked in figure 20(b). The figure shows an increase in
 $P_{(o)} - P_{(R,0)}$ with an increase in
 $R$ and corresponding reduction in
 $h$, during the radial expansion of the droplet such that
 $P_{(o)} - P_{(R,0)}$
 $\simeq$
 $R^{1/2}$ during the stretching regime and
 $P_{(o)} - P_{(R,0)}$
 $\simeq$
 $R^{11/5}$ during the thinning regime (see figure 20f).
Acoustic pressure field variation, as obtained from COMSOL multiphysics simulations, during deformation of the droplet levitated at the node of standing wave: (a) without drop (b)  $2R = 2.2$ mm and
 $h = 0.8$ mm, (c)
 $2R = 2.5$ mm and
 $h = 0.54$ mm, (d)
 $2R = 3$ mm and
 $h = 0.38$ mm, (e)
 $2R = 4$ mm and
 $h = 0.2$ mm and (f)
 $2R = 5$ mm and
 $h = 0.14$ mm, (g)
 $P_{(o)} - P_{(R,0)}$ vs
 $R$ and (h) log(
 $P_{(o)} - P_{(R,0)}$) vs log
 $(R)$. Here,
 $P_{(R,0)}$ and
 $P_{(o)}$ are the acoustic pressure at the equator and pole region, respectively.
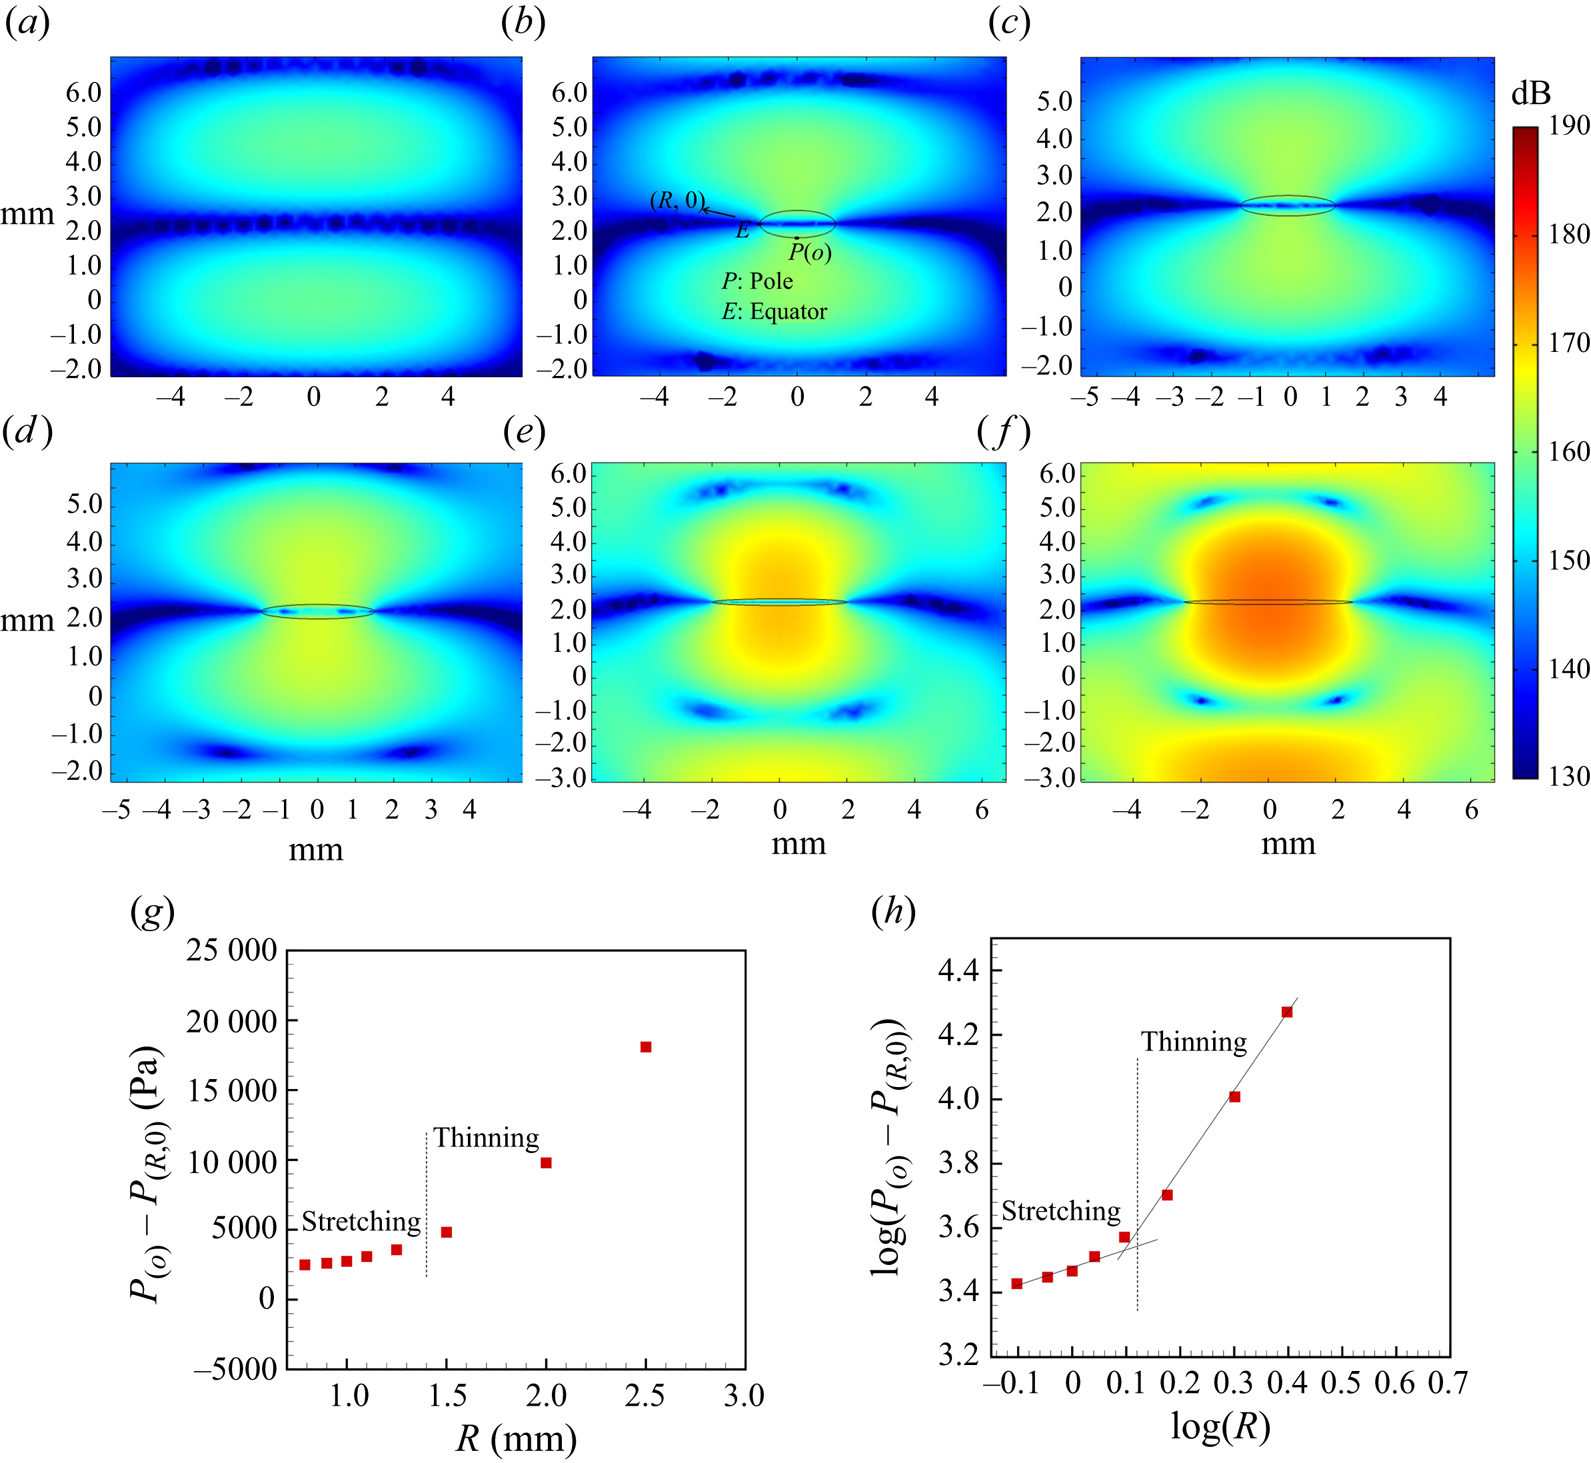
The non-dimensional acoustic pressure on the surface of the droplet is given by Shi & Apfel (Reference Shi and Apfel1996) in the form of an acoustic velocity potential. Here,  $U = -\boldsymbol {\nabla } \phi$ and the first-order acoustic pressure
 $P = \rho _a {\partial \phi }/{\partial t}$. The velocity potential is non-dimensionalised by the velocity potential of incident wave
 $\phi _0$:
 \begin{equation} P_r = \frac{1}{K^2} (\boldsymbol{n}\boldsymbol{\cdot}\boldsymbol{\nabla} \phi)^2-\frac{1}{2} \phi^2, \end{equation}
where  $K = {k d_0}/{2}$,
 $k$ is the acoustic wavenumber and
 $\boldsymbol{n}$ is the unit normal vector on the surface of the droplet.
The acoustic pressure causes the deformation of the droplet, that is countered by the capillary force. This physics is demonstrated in our simulation results as shown in figure 20 both without (a) and with (b) deformed droplets in the standing acoustic field. The deformed shape further modifies the scattered acoustic field and radiation stress.
The first term on the right-hand side of (A18) denotes the tensile force at the equator due to negative pressure at the equator, while the second term denotes the squeezing force at the poles that is compressing in nature. The tensile force at the equator increases as the droplet becomes oblate shaped under the effect of the acoustic field, which causes further flattening of the droplet and a further increase in the deforming forces (Shi & Apfel Reference Shi and Apfel1996). This process continues until the transients are damped out whereafter it reaches a steady deformation when the capillary and acoustic forces balance, especially at low  $We$. At this point, the acoustic radiation pressure becomes equal to the pressure inside the liquid sheet (see figure 20e,f). The internal pressure can be ignored for very small values of h since it is similar to the pressure outside, owing to the flatness at the poles. Then, (4.8) can be written as
 \begin{equation} {-}\rho_a \frac{f_s^2 U^2}{8d_0^2} R^2 +\frac{2 \sigma}{h}=0. \end{equation}
In the thinning regime, the variation of thickness is considered to be  $h={d_0^2}/{8R}$ (Bremond et al. Reference Bremond, Clanet and Villermaux2007) and using relation
 $U =({P_0}/{\rho _a c_0}) ({1}/{\sqrt {2}})$
 \begin{equation} {-}\frac{f_s^2}{128\rho_a c_0^2} \frac{ P_0^2}{h} R + \frac{2 \sigma}{h}=0. \end{equation}
The first term and second term in (A19) denote the acoustic suction pressure and capillary pressure, respectively.
The capillary pressure is proportional to the curvature ( ${1}/{h}$) of the flattened droplet. The tensile acoustic pressure (suction) is proportional to
 ${P_0^2 R}/{h}$. A similar argument is also made by Lee, Anilkumar & Wang (Reference Lee, Anilkumar and Wang1991), thereby justifying the assumption that the dynamics at the rim is a competition of the capillary stress and the acoustic field-induced suction stress.
As  $P_0^2 R$ increases during thinning, the capillary pressure is no longer able to balance the negative pressure force. The increased velocity at the equatorial region of the flattened droplet creates a greater suction. At this time, there is an insufficient increase in the squeezing force because of equal pressure. Therefore, the suction stress is completely dominated by the surface tension, which pulls the liquid, resulting in thinning at the equatorial region (Lee et al. Reference Lee, Anilkumar and Wang1991).


 Open access

