Introduction
Ageism has received much attention from researchers and policy makers because it is widespread and has become a serious issue in society (Gee, Pavalko and Long Reference Gee, Pavalko and Long2007; Levy and Banaji Reference Levy, Banaji and Nelson2002; Nelson Reference Nelson2005). Ageism is generally defined as discrimination against older people based on their age and has also been referred to as the third great ism in our society along with racism and sexism (Palmore Reference Palmore2001). Although it can be applied to different age groups, ageism generally refers to discrimination against older people, a phenomenon that has engendered many issues in a society with a rapidly increasing older population. Ageism, and a lack of awareness thereof, are linked not only to social justice and human rights, but also to broader levels of structural discrimination in society, such as inequity in social engagement, employment and health care (Gee, Pavalko and Long Reference Gee, Pavalko and Long2007; North Reference North2015; Palmore Reference Palmore2001).
Ageism impacts the individual lives of older people and may be connected with social isolation, loneliness, suicide, depression and loss of role identity, as well as other serious social issues (Jeon and Shin Reference Jeon and Shin2011; Kim Reference Kim2015; Levy Reference Levy2009; Nelson Reference Nelson2005; Shin Reference Shin2010; Won Reference Won2003). In addition, older people who experience age discrimination tend to be less successful in later life (Jeon and Shin Reference Jeon and Shin2009), while some researchers have reported that a negative attitude towards older people can lead to elder abuse (Kim Reference Kim2003; Nelson Reference Nelson2005). Perceptions of older people being unable to contribute to society and being a burden on society will increase, leading to discriminatory behaviour (Chung and Jung Reference Chung and Jung2014; Dominelli Reference Dominelli2004; McDonald Reference McDonald2004). Moreover, such negative attitudes towards older people make it easier for people to perceive that the welfare and humanity of older people are less important than those of younger people. This indicates that ageism has become a serious issue, leading to the neglect, exploitation and abuse of older people (Nelson Reference Nelson2005; Tova Reference Tova2015).
Korean society has been shaped by Confucian ideologies wherein age predetermines one's position in relation to others and has the widely spread age norm or prejudicial treatment of individuals based on their age (Chung and Jung Reference Chung and Jung2014; Jambor Reference Jambor2009). Although the idea that younger people should respect older people has spread widely in Korean society, this trend has changed with an emphasis on economic productivity in industrial society, which has fuelled a prejudice against older people because productivity of older people is too low to be compared with younger people in terms of competence. Moreover, the proportion of the ageing population in Korea is higher than ever, and Korea is becoming the ‘aged society’ rapidly. As the compressed ageing of the Korean population continues, it becomes more important to understand ageism and to consider strategies to reduce ageist attitudes and behaviours.
It is widely illustrated that people generally have a negative attitude towards older people (Kim Reference Kim2012; King and Bryant Reference King and Bryant2016; Ranor Reference Ranor2015). According to Kite et al. (Reference Kite, Stockdale, Whitley and Johnson2005), people are likely to have clear stereotypic beliefs about younger and older people. However, among various studies conducted regarding knowledge about, or attitudes towards older people, some have found positive or neutral attitudes towards older people (Funderburk et al. Reference Funderburk, Damron-Rodriguez, Storms and Solomon2006; Harris and Dollinger Reference Harris and Dollinger2001). Research conducted with various participants, such as undergraduate students, professionals, care-givers, and so on, revealed mixed results according to the respective raters or respondents (Cherry and Palmore Reference Cherry and Palmore2008; Allan and Johnson Reference Allan and Johnson2009; Angiullo, Whitbourne and Powers Reference Angiullo, Whitbourne and Powers1996; Kim Reference Kim2013; Lim Reference Lim2012; Officer et al. Reference Officer, Schneiders, Wu, Nash, Thiyagarajan and Beard2016)
Many studies have been conducted with various participants on attitudes towards older adults, as well as self-reported experiences of older people (Gee, Pavalko and Long Reference Gee, Pavalko and Long2007; Jeon and Shin Reference Jeon and Shin2011; Schwartz and Simmons Reference Schwartz and Simmons2001; Sijuwade Reference Sijuwade2009), but there has been relatively little research on the relationship between knowledge, attitudes and actual ageist behaviour of members in society (Kim Reference Kim2003). Previous studies have been criticised, because most of the relevant research tends to focus on measuring attitudes towards older people rather than consider knowledge as a pre-conditioning variable to attitudes and thus as leading actual behaviour (Fazio Reference Fazio, Sorrentino and Higgins1986; Terry and Hogg Reference Terry and Hogg1996). To understand the attributions of ageism in society, actual ageist behaviour as well as knowledge and attitudes should be examined. Regarding discriminatory behaviour, to what extent does such knowledge and negative attitudes against older people actually represent discriminatory behaviour in daily life; that is, the relationship between knowledge, attitudes and ageist behaviour needs to be investigated systematically.
Although negative attitudes against older people are not limited to younger people but extend to all generations, many previous studies on attitudes towards older people have been conducted with people of various ages, such as undergraduate students, or health and social services providers (Allan and Johnson Reference Allan and Johnson2009; An, Lim and Kim Reference An, Lim and Kim2002; Barton Reference Barton1999; Kim Reference Kim2013; Kim and Lim Reference Kim and Lim2007; Lee Reference Lee2007). Moreover, research on ageism is not likely to focus on the older people's attitudes or ageist behaviour towards themselves but to focus on their experienced discrimination from others (Cherry and Palmore Reference Cherry and Palmore2008). Ageism may impact on ‘older peoples’ implicit beliefs about their competencies as well as self-stereotypes’ (Cherry and Palmore Reference Cherry and Palmore2008: 850). Therefore, approaches that include both younger and older generations are thus required and a comparison between both groups is necessary. Also, as Sijuwade (Reference Sijuwade2009) emphasised that there is a need to study how older people perceive themselves, age-group differences between groups of younger and older people were analysed in this study.
Research questions for this study were as follows. First, what is the level of ageism, represented by knowledge, attitude and discriminatory behaviour, prevalent in Korean society? Second, what is the relationship between knowledge about and attitudes towards older people and discriminatory behaviour? In particular, does knowledge about and attitudes towards older people influence the actual ageist behaviour of younger and older people? Third, are there any age-group differences in the results?
Conceptual framework
The knowledge–attitude–behaviour model by Chaffee and Roser (Reference Chaffee and Roser1986) was used as a conceptual model for this study to explain discriminatory behaviour towards older people. This model not only identifies basic conditions that induce behaviour but also demonstrates how such conditions as knowledge and attitudes are interrelated. Knowledge, attitudes and behaviours are the three elements of this model.
Knowledge is a condition that may form an attitude towards older people and it also functions to perpetuate strong attitudes toward older people (Wood, Rhodes and Biek Reference Wood, Rhodes, Biek and Krosnick1995). Well-organised knowledge facilitates strong attitudes, which in turn, influence behaviour. Knowledge not only contributes to building a strong attitude, but it can also facilitate behaviour (Eagly and Chaiken Reference Eagly and Chaiken1993; Wood, Rhodes and Biek Reference Wood, Rhodes, Biek and Krosnick1995). Attitude is defined as negative or positive feelings and thoughts about a specific object (Chaffee and Roser Reference Chaffee and Roser1986). As indicated above, strong attitudes are built on an extensive and well-organised knowledge structure, therefore, such attitudes are considered to be more reasoned products of knowledge (Chaffee and Roser Reference Chaffee and Roser1986). Sometimes attitude can be expressed explicitly and can lead to specific actions towards an indicated target (Ajzen and Fishbein Reference Ajzen and Fishbein1977; Bettinghaus Reference Bettinghaus1986; Borgida and Campbell Reference Borgida and Campbell1982; Homer and Kahle Reference Homer and Kahle1988). For example, people with negative attitudes towards African Americans may also demonstrate discriminatory behaviour towards them. In this study, knowledge of older people could affect attitudes towards ageing and older people, which leads to actual behaviour, such as discriminatory or respectful behaviour, towards older people. Although behaviour is often considered to be a spontaneous response to situational stimulus and could be influenced by social acceptability, self-presentational bias and salience of attitude (Allen, Cherry and Palmore Reference Allen, Cherry and Palmore2009; Stahl and Metzger Reference Stahl and Metzger2013), people would behave more in accordance with knowledge and internal values (Chaffee and Roser Reference Chaffee and Roser1986). Therefore, behaviour is considered to be especially reflective of one's attitudes or knowledge in this study.
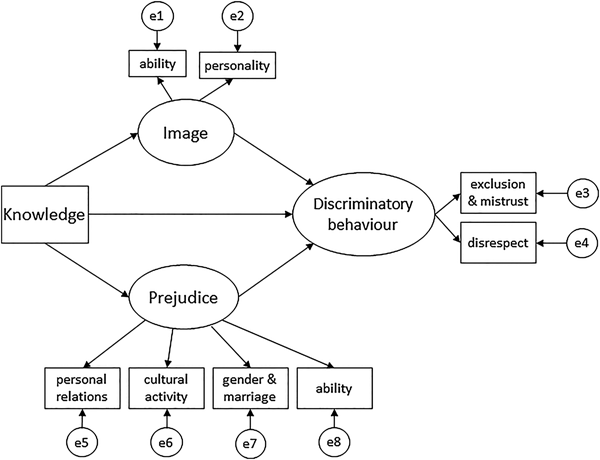
The conceptual framework for this study is shown in Figure 1. The proposed model consists of three exogenous variables and one endogenous variable. It is hypothesised that the three exogenous variables, ‘knowledge’, ‘image’ and ‘prejudice’, have a direct effect on one endogenous variable, that is, discriminatory behaviour. Simultaneously, knowledge is proposed to have a direct effect on the two attitude variables, which are ‘image’ and ‘prejudice’. The socio-demographic variables – gender, age, monthly total family income, education level and marital status – were controlled throughout the process of the structural equation modelling (SEM) analysis.
Conceptual Framework

Previous research reports that the more knowledgeable a person is about ageing and older people, the more positive their image or behaviour will be towards older people (Allan and Johnson Reference Allan and Johnson2009; Jeon and Kwon Reference Jeon and Kwon2009). In contrast, those who have limited knowledge of ageing and older people tend to practise a more biased attitude towards older people as well as discriminatory behaviour towards them (Cherry and Palmore Reference Cherry and Palmore2008; Stuart-Hamilton and Mahoney Reference Stuart-Hamilton and Mahoney2003). Next, the image–behaviour and prejudice–behaviour relationships were examined in this study. Social psychologists have studied the relationship between attitudes and behaviours (Ajzen and Fishbein Reference Ajzen, Fishbein, Albarracín, Johnson and Zanna2005; Fabrigar et al. Reference Fabrigar, Petty, Smith and Crites2006). Attitudes can be a key factor in understanding human behaviour; that is, the cognitive or affective components of attitude influence human behaviour (Ajzen and Fishbein Reference Ajzen, Fishbein, Albarracín, Johnson and Zanna2005). Image and prejudice were used as attitude variables to predict discriminatory behaviour. Image has been examined with regard to external aspects, such as appearance or other's acceptance (Jeon and Shin Reference Jeon and Shin2009), as well as internal attitude towards older people (Seo and Kim Reference Seo and Kim1999). The present study focused on image, which is similar to internal attitude towards older people. Prejudice can be defined as a negative attitude or exaggerated perspective towards a particular group or individuals that belong to that group without unbiased evidence (Allport Reference Allport1954). The concept of prejudice is represented with ‘bias’, ‘over-simplification’, ‘stereotype’ and ‘over-generalization’ (Won Reference Won2003, as cited in Oh Reference Oh2002). Age prejudice is related to a negative perception or stereotype of older people. This concept could be applied to not only avoidance or reluctance to see older people in person, but also discriminatory behaviour (Won Reference Won2003). The assumption that attitudes partially explain and predict human behaviour may be applied to the relationship between prejudice and discriminatory behaviour (Kim Reference Kim2011). However, results from previous research on attitude–behaviour relationships have been inconsistent (Ajzen and Fishbein Reference Ajzen, Fishbein, Albarracín, Johnson and Zanna2005; Nelson Reference Nelson2005; Sinnott, Raval and Shiffman Reference Sinnott, Raval and Shiffman1983).
Meanwhile, researchers have revealed variability in knowledge, attitude and behaviour towards older people from various social backgrounds. In previous literature, ‘age’ seems to be one of the most significant variables that makes a difference in the knowledge, attitudes and behaviour of respondents towards older people (An, Lim and Kim Reference An, Lim and Kim2002; Jeon and Kwon Reference Jeon and Kwon2009). It is likely that younger and older people have different attitudes towards older people as well as different ageist behaviours (Pinquart and Wenzel Reference Pinquart and Wenzel2000). Unlike the general expectation that younger people have more negative attitudes or perceptions compared to older people, the results were inconsistent. Some results reveal that older people have more positive attitudes towards older people than younger people (Berg and Sternberg Reference Berg and Sternberg1992; Guo, Erber and Szuchman Reference Guo, Erber and Szuchman1999), while other studies reveal that younger people have a more positive attitude than older people (An, Lim and Kim Reference An, Lim and Kim2002; Chung and Jung Reference Chung and Jung2014; Rothbaum Reference Rothbaum1983). However, there are also several studies that reveal no differences between younger and older people in terms of frequency and types of discriminatory behaviours (Cherry and Palmore Reference Cherry and Palmore2008). Hence, we tested our research models to examine differences among age groups.
In the present study, the prevalence of ageism in Korean society is examined separately with respect to knowledge and attitudes towards older people as well as through discriminatory behaviour and the relationship among these variables. Moreover, a multiple group analysis was conducted to ascertain if there are differences between younger and older people.
Method
Participants and procedure
Data used for this study are from ‘The Study on Ageing in Korean Society’ which is the first national-level study about Koreans’ attitudes on various issues of ageing and older people (Chung and Jung Reference Chung and Jung2014). Respondents age 20 and older were recruited using multi-stage quota sampling which is a representative method of non-probability sampling. In quota sampling, the population is classified by strata consisting of an expected size and is considered to provide a moderate representation of the population. In the current study, the sample was stratified by region, sex and age for the population of 16 administrative districts in South Korea. A total of 1,500 respondents were recruited and the survey was conducted for one month in 2011. Trained research investigators collected data with a developed survey questionnaire in person to accelerate the response rate. The sample of this study comprised two groups with criteria for the age of older people: 500 older people aged 65 and over and 1,000 younger people aged 20–64.
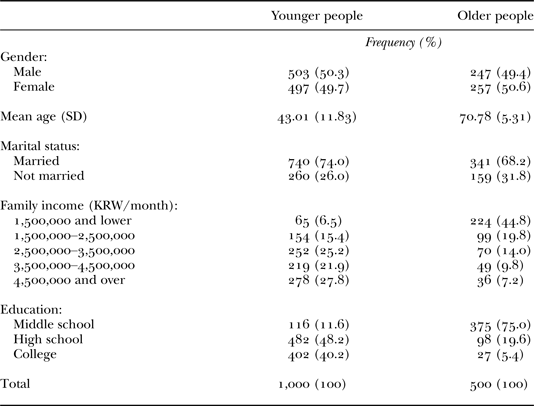
Table 1 reveals the frequency and percentage distribution of the socio-demographic characteristics of the sample. There were approximately equal numbers of men and women in both groups. The mean age is 43 (standard deviation (SD) = 11.83) for the younger people and 70.8 (SD = 5.31) for the older people. In both groups, approximately 70 per cent of the respondents are married. Among the younger people group, approximately 85 per cent of respondents stated their monthly family income is 2,500,000 KRW or more (the average family income in Korea in 2011 was 3,690,000 KRW/month). However, among the older people group, approximately 65 per cent of respondents stated their family income was less than 2,500,000 KRW. Similarly, younger and older people groups have different educational levels. Of the younger people, 88.4 per cent have an educational level equal to or higher than a high school graduate, whereas 75 per cent of the older people did not graduate from high school.
Socio-demographic characteristics of respondents

Note: SD: standard deviation.
Measurement
Knowledge about ageing and older people
Knowledge about ageing and older people was measured using the true–false version of Palmore's Facts on Ageing Quiz part 1 (FAQ1). The F was developed by Palmore (Reference Palmore1977) and was revised in 1981 (Palmore Reference Palmore1981). Lim, Kim and Kim (Reference Lim, Kim and Kim2002) translated and modified Palmore's FAQ1 to reflect the Korean situation. In particular, three of the 25 items were revised to reflect the statistics of the older population in Korea, For example, the original version that stated ‘Over 15% of the US population are now age 65 and over’, which was changed to ‘Over 10% of the Korean population are now age 65 and over’. This scale was validated by those authors, so we used the revised F. It includes 25 items on ageing and older people and it is widely known as one of the simplest and most frequently used measurements to assess knowledge about ageing. Each item includes facts linked to physical, psychological, familial and social aspects of ageing. Examples from the questionnaire are: ‘the majority of old people are senile’, ‘it is almost impossible for the majority of old people to learn new things’ and ‘the majority of old people say they are lonely’. Knowledge about ageing was assessed by using a score rating from 0 to 1. The scale defined 1 = ‘true’ and 0 = ‘false’ or ‘don't know’. The minimum attainable score was 0 and the maximum attainable score was 25. A higher score implied more knowledge about ageing and older people.
Image of older people
A total of 20 items of the Semantic Differential Scale developed by Sanders et al. (Reference Sanders, Montgomary, Pittman and Balkwell1984) were used to assess the image of older people. This is a Likert-type rating scale used to measure a respondent's reaction to a word, using a list of bipolar adjectives that represent the image of older people (Hawkin Reference Hawkin1996); e.g. ‘wise–foolish’, ‘kind–unkind’, ‘happy–sad’, ‘productive–unproductive’, and so on. The respondents were asked to rate their perceptions on a seven-point scale to reflect the degree of their positive or negative image. A higher score indicates that respondents have a more negative image of older people. The factor analysis revealed that the image of the older people variable has two sub-dimensions, which are ‘ability’ and ‘personality’; further, the validity of the measurement was established and Cronbach's alpha of the scale was 0.929.
Prejudice against older people
The scale of prejudice against older people developed by Won (Reference Won2003) was used to measure respondents’ prejudice. Won (Reference Won2003) developed this scale using existing items from previous relevant studies regarding attitudes towards older people and materials from her preliminary interviews with older people. The scale consisted of 19 items with four dimensions, which are linked to ‘prejudice in personal relations’, ‘cultural activity’, ‘gender and marriage’ and ‘ability’ (i.e. ‘The elders are dependent’; ‘The elders are not interested in culture’). These items were rated on a four-point scale, ranging from ‘strongly disagree’ (1) to ‘strongly agree’ (4). A higher score indicates that the respondent had a higher level of prejudice against older people. The validity of this scale was established by Won (Reference Won2003) and Cronbach's alpha of the scale for this study was 0.811.
Discriminatory behaviour towards older people
The scale of Won et al. (Reference Won, Lee, Kim, Choi and Han2006) was used to measure discriminatory behaviour towards older people. The respondents were asked to rate, on a four-point scale, the extent to which they behave in a given manner towards older people. This scale consisted of 13 items, including various forms of discriminatory behaviour towards older people (i.e. ‘I've avoided older people because of their age’; ‘I've ignored older people in the course of decision-making’). The possible responses are in the range of ‘not at all’ (1) to ‘always’ (4). A higher score indicates that the respondent practises more frequent discriminatory behaviour. In the factor analysis, it was found that the scale has two dimensions, which were ‘exclusion and mistrust’ and ‘disrespect’. The validity of the scale was established and Cronbach's alpha for reliability was 0.935.
Data analysis
First, descriptive analysis was used to demonstrate the mean and SD, and the frequency and percentages of all variables. These statistics were used to observe the level of knowledge, attitude and discriminatory behaviour of respondents. A t-test was also used to assess age-group differences, and inter-correlation among variables was analysed. Second, the associations between knowledge, attitude and discriminatory behaviour were analysed with SEM. The absolute value of skewness and kurtosis was checked, to test normality of the distribution. It was necessary to transform the variables in SEM because the result could have been distorted if normal distribution was not satisfied (Kline, as cited in Augustus-Horvath and Tylka 2011). The skewness of the observed variables was lower than |3| and the kurtosis of the observed variables was lower than |10| in the present study (skewness range = −0.742–1.262, kurtosis range = −0.528–1.641). As a result, all of the observed variables could be used for the analysis. To assess the goodness of fit of the data, multiple measures were used: χ2 statistics, RMSEA (root mean square error of approximation), TLI (Tucker–Lewis Index) and CFI (Comparative Fit Index). Third, multiple group analysis was used to explore differences between the two age groups; that is, it was used to test the moderate effect of ‘age’ on the relationship between knowledge, attitudes and discriminatory behaviour. PASW 18.0 was used for the analysis.
Results
Descriptive analysis
Knowledge about and attitude towards older people
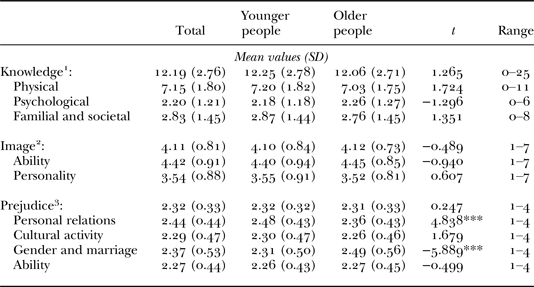
Respondents in this study revealed an average correct score on the FAQ1 of 48.72 per cent. As shown in Table 2, the mean score for knowledge about ageing and older people is 12.19 out of 25. Although younger people (mean = 12.25, SD = 2.78) report a higher knowledge level than older people (mean = 12.06, SD = 2.71), there was no significant difference between age groups in terms of FAQ1 scores. Results suggest that respondents have a relatively lower level of knowledge regarding ageing than those studies of health and social care professionals (Lim Reference Lim2012) and were similar to the studies of undergraduate students (Allan and Johnson Reference Allan and Johnson2009; Jeon and Kwon Reference Jeon and Kwon2009). The results from each dimension of knowledge indicate that scores with regard to physical aspects were higher than for the other two sub-dimensions of knowledge.
The perception towards older people

Notes: 1. Knowledge about ageing and older people. 2. Image of older people. 3. Prejudice towards older people. SD: standard deviation.
Significance level: *** p < 0.001.
In terms of attitudes, the mean score for the image of older people was 4.11 out of 7. When considering 3.5 is the mid-point of the seven-point scale, the mean score of 4.11 is slightly higher than that score, which means that respondents have a somewhat negative image of older people. Furthermore, it seems that the image of the ‘ability’ aspect (factor 1) in older people (mean = 4.45, SD = 0.85) was closer to negative adjectives than the image of ‘personality’ (factor 2) in older people (mean = 3.52, SD = 0.81). At this point, the Semantic Differential Scale reveals a higher score which validated a more negative image of older people. There was no statistically significant difference between the younger and older groups based on the mean.
The mean score for prejudice against older people was 2.32 out of 4. It suggests that respondents demonstrated a very slightly higher score for prejudice towards older people when considering 2.0 is the mid-point of the four-point scale; and two sub-dimensions of prejudice, ‘personal relations’ and ‘gender and marriage’, demonstrated a significant difference among the two age groups. The younger people group (mean = 2.48, SD = 0.43) reveals more prejudice than the older people group (mean = 2.36, SD = 0.43) in terms of ‘personal relations’ (t = 4.838, p < 0.001). This means that younger people showed stronger prejudice about the personal relationships of older people with others than older people. For instance, younger people have more tendency to think that ‘older people become a burden to their children’ or ‘older people do not consider others’ than older people do. However, the older people (mean = 2.49, SD = 0.56) reveal more prejudice than the younger people (mean = 2.31, SD = 0.50) in terms of ‘gender and marriage’ (t = −5.889, p < 0.001). That is, older people have stronger prejudice related to marriage and romantic relationships in later life, as in ‘the older people had better live alone than remarry’ or ‘older people do not have interests with romantic relationship’, than younger people.
Discriminatory behaviour towards older people
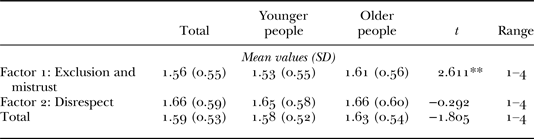
As shown in Table 3, the factor analysis reveals that the discriminatory behaviour towards older people has two sub-dimensions: ‘exclusion and mistrust’ (factor 1) and ‘disrespect’ (factor 2). The mean score for all respondents was 1.59 out of 4, and there were no statistically significant differences between age groups. When considering 2.0 is the mid-point of the four-point scale, the mean score 1.59 indicated the respondents revealed a low level of ageist behaviour against older people. However, in the ‘exclusion and mistrust’ dimension of discriminatory behaviour, there was a statistically significant difference between the two groups (t = 2.611, p < 0.01). That is, the older people (mean = 1.61, SD = 0.56) practise higher discriminatory behaviour than the younger people (mean = 1.53, SD = 0.55). This indicates that older people were likely to practise an ageist behaviour themselves as well as other older people. Meanwhile, in the ‘disrespect’ dimension, there were no statistically significant differences.
The discriminatory behaviour against older people

Note: SD: standard deviation.
Significance level: ** p < 0.01.
Inter-correlations among variables
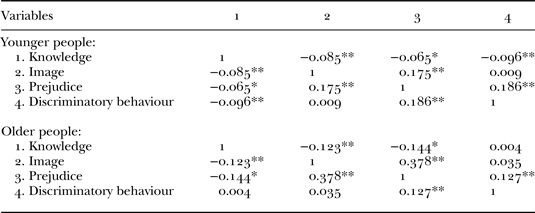
‘The correlation coefficient provides the basis for establishing and testing models among latent variables’ (Schumacker and Lomax Reference Schumacker and Lomax2010: 34). Due to examining the relationship among latent variables included in the structural equation model and confirmation of the multi-collinearity, the bivariate correlation among the four variables was examined separately for older and younger people, and the results are shown in Table 4. Correlations among variables of the matrix ranged from −0.096 to 0.186 among younger people and from −0.123 to 0.378 among older people. These results indicate that there are no strong specific bivariate relationships between variables that consider the specification of unique variance shared between two variables (Schumacker and Lomax Reference Schumacker and Lomax2010).
Bivariate correlations for the younger people and older people

Significance levels: * p < 0.05, ** p < 0.01.
Multiple group analysis
Examination of the configural invariance
Before examining the differences between younger and older people in the hypothesised model, the group-invariant model, which is the model for the aggregated sample, was submitted for analysis. The five pathways are as shown in Figure 1 and the test of ‘goodness of fit in the model’ was calculated. The adequacy of the model fit was determined by three indices: TLI, CFI and RMSEA. TLI and CFI values above 0.9 indicate an acceptable fit, and a RMSEA value below 0.06 indicates a relatively goodness of fit of the model (Augustus-Horvath and Tylka 2011). The evaluation of goodness-of-fit indices of the present study supports that the baseline model has an acceptably good fit to the data for aggregated samples (TLI = 0.901, CFI = 0.946, RMSEA = 0.039, χ2 = 324.875, p < 0.001).
In the next step, for the test of configural equality between the group-variant model and group-invariant model, the adequacy of model fit among younger and older people was assessed, as performed in the baseline model. The results reveal that the model for both groups fits the data well (in the model for younger people, TLI = 0.899, CFI = 0.945, RMSEA = 0.057, χ2 = 206.183, p < 0.001; and in the model for older people, TLI = 0.905, CFI = 0.949, RMSEA = 0.053, χ2 = 118.672, p < 0.001), suggesting no configural difference in the structural model between younger and older people. It means that the hypothesised model can be applied to both groups and allowed to examine differences in specific measurement and structural equality in both groups.
Examination of the measurement equality and structural equality
The multi-group model analysis should establish ‘the acceptance of the measurement models and measurement invariance for the groups before hypothesizing statistically significant differences in coefficients between groups’ (Schumacker and Lomax Reference Schumacker and Lomax2010; see also Lee, Keum and Lee Reference Lee, Keum and Lee2010;). Measurement invariance means a different group has the same latent construct (i.e. knowledge, attitudes and behaviour) and measurement bias with respect to groups is absent (Wicherts, Dolan and Hessen Reference Wicherts, Dolan and Hessen2005).
The SEM permits the testing of group differences in the specified model by imposing constraints. With regard to the statistical significance, chi-square difference tests (Δχ2) were used in the comparisons between models by placing equality constraints. The measurement equality can be established when the difference in χ2 is not significant (Gweon Reference Gweon2010; Lee, Keum and Lee Reference Lee, Keum and Lee2010).
For the examination of measurement invariance, equality constraints were imposed on factor loadings among all observed variables as the initial step. However, it revealed that the difference of χ2 was significant (Δχ2 = 17.801, Δdf = 5). In the next step, the model which released the equality constraints of the parameter that had the highest change of χ2 value was tested (Hong, Park and Kim Reference Hong, Park and Kim2007; Lee, Keum and Lee Reference Lee, Keum and Lee2010). The difference in χ2 in this measurement model was not statistically significant (Δχ2 = 7.640, Δdf = 4), as shown in Table 5. As a result, it suggested that measurement invariance is evidenced between younger and older groups.
The examination of measurement equality and structural equality

Notes: df: degrees of freedom. TLI: Tucker–Lewis Index. CFI: Comparative Fit Index. RMSEA: root mean square error of approximation.
Finally, the structural invariance analysis was conducted to determine whether the six path coefficients among the latent variables in the trimmed model were different in strength between the two groups. In the model for structural equality, equality constraints were added to the previous model and the result is shown in Table 5 (Δχ2 = 40.510, Δdf = 25). The group-invariant model was statistically significant and the structural equality was not established. It indicated that at least one path coefficient was different in strength between the older and younger groups. To detect the different path(s) between both groups, the comparison of the group-invariant model and six variant models which allowed only one path to vary was conducted as follows.
Age-group differences in the path coefficient
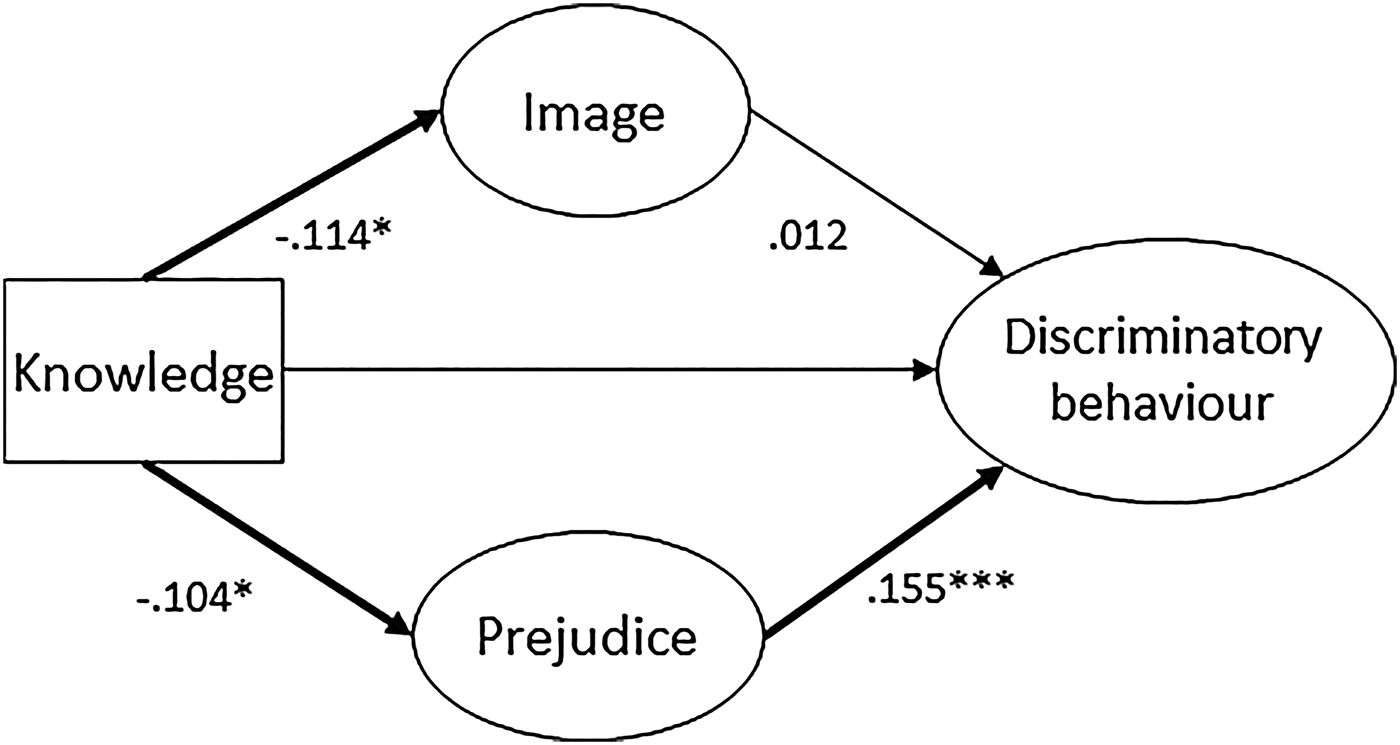
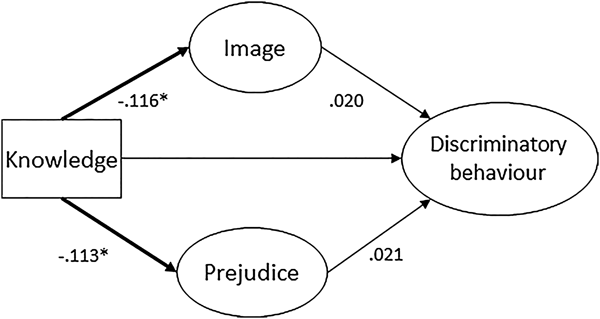
The standardised estimates of the model for younger and older people are presented in Figures 2 and 3, respectively. The baseline model means that the model is without a constraint, which is first estimated before containing the equality constraint in the structural coefficient. It is used to compare the later alternative models that contain equality constraints. As a result, the path coefficient of younger people is statistically different from the path coefficient of older people.
Path model of the influence of the perception on the discriminatory behaviour among younger people. Significance levels: * p < 0.05, ** p < 0.01, *** p < 0.001.

Path model of the influence of the perception on the discriminatory behaviour among older people. Significance level: * p < 0.05.

As illustrated in Figures 2 and 3, knowledge has a direct negative impact on the image of older people in both groups (β = −0.114, p < 0.05 among younger people; β = −0.116, p < 0.01 among older people). This indicates that younger and older people have more knowledge about ageing and older people have a less negative image of older people. A high score indicates that the respondent has a more negative image of older people. Similarly, knowledge has a direct negative impact on the prejudice of both groups (β = −0.104, p < 0.01 among younger people; β = −0.113, p < 0.05 among older people). This means that both groups with more knowledge have less prejudice against older people. However, knowledge has no significant direct impact on discriminatory behaviour.
Prejudice against older people reveals a significant variable that has a direct effect on the discriminatory behaviour of younger people (β = 0.155, p < 0.001). This result indicates that those who have more prejudice practise more discriminatory behaviour towards older people.
Based on results in Figures 2 and 3, the differences between the two age groups are identified. The significant path for explaining knowledge through prejudice on discriminatory behaviour was revealed only among younger people. These findings suggest that younger people with more knowledge about ageing and older people have less prejudice towards older people (β = −0.104, p < 0.05). Subsequently, those who have low prejudice towards older people have less discriminatory behaviour (β = 0.155, p < 0.001). Therefore, attitude has the role of a mediator in the relationship between knowledge and behaviour. However, with older people, although knowledge has negative direct impacts on both image (β = −0.116, p < 0.05) and prejudice (β = −0.113, p < 0.05), image and prejudice have no direct impact on discriminatory behaviour (β = 0.020, p > 0.05; β = 0.021, p > 0.05).
Discussion
This study examined the level of ageism and relationships among knowledge, attitudes and discriminatory behaviour towards older people and observed the differences between younger and older generations. This study reveals that the level of ageism, as represented by attitudes and discriminatory behaviour towards older people in Korea. The image of older people was slightly negative and prejudice towards older people was very slightly negative, while discriminatory behaviour against older people was low based on the mid-point of the scale. It could be explained that discriminatory behaviour against older people is not serious yet because the traditional Confucian culture of respecting older people, but it has become negative for the image of older people in Korea. A negative attitude towards ageing and older people because of age is increasingly reported in Korea (Committee of State Human Right 2014). Compared to high-income countries which report the lowest level of respect towards older people in the World Value Survey of the World Health Organization (Officer et al. Reference Officer, Schneiders, Wu, Nash, Thiyagarajan and Beard2016), a mechanism should be prepared to combat discriminatory behaviour against older people in Korea. As a prevention for discrimination against older people, education and legal regulations should be developed in Korea, as in the case of other ‘isms’ (Jeon and Shin Reference Jeon and Shin2011; Won Reference Won2005).
It is noteworthy that there are statistically significant age-group differences between younger and older people in ‘gender and marriage’, a sub-dimension of prejudice, and ‘exclusion and mistrust’, a sub-dimension of discriminatory behaviour. Different from the expected, older people tend to report more avoidance attitudes and mistrust towards older people. With regard to the findings of prejudice related to the ‘gender and marriage’ dimension, older people themselves have more ageist attitudes towards other older people, despite being in the same age group. In addition, although prejudice and the discriminatory level of older people are not extremely negative based on the result, it is possible that older people have been affected by societal stereotyping of negative images against older people for years and are therefore accustomed to it. Ageist attitudes could be formed before an elderly age and operate without conscious awareness, intention or control when getting old (Bodner Reference Bodner2009; Levy Reference Levy2003); Levy and Banaji (Reference Levy, Banaji and Nelson2002) have described this automatic or unconscious stereotype. The finding suggests that older people themselves need to expand their awareness of ageism and undergo an internal change of attitude to reduce the accustomed negative image. In addition, education for older people, such as learning that there is no ‘proper’ age to do something and that everyone can participate in any activity without age consideration, is crucial to prevent age discrimination by older people against other older people. No age barriers to participate in society are very important for including older people in society (Chung, Jeong and Kim Reference Chung, Jeong and Kim2016; Riley and Riley Reference Riley and Riley2000; Ulenberg Reference Uhlenberg2000).
One way to prevent age discrimination among younger people is to change their negative perception of older people. As Kite et al. reveal, middle-age respondents demonstrated the largest age-related bias in their study of attitudes towards certain age groups, perhaps because ‘middle-aged adults see old age as right over the horizon, but still are not quite ready to accept its coming’ (Kite et al. Reference Kite, Stockdale, Whitley and Johnson2005: 256; Montepare and Lachman Reference Montepare and Lachman1989). Therefore, it is important to change the attitudes towards older adults of younger people, including young and middle adults.
The knowledge–attitude–behaviour continuum model suggested in this study was verified not with older people, but with younger people. These results suggest different approaches towards younger and older people to reduce ageism in society. When applied to younger people, the knowledge–attitude–behaviour model is considered to reduce discriminatory behaviour. Therefore, education to impart knowledge with regard to ageing and older people is crucial for reducing ageism in society in the future, which can be a potential method for reducing negative attitudes and ageist behaviour for younger people. Although there could be the possibility that with increased education comes increased awareness of socially appropriate responses on explicit measures of attitude, educational approaches to impart knowledge about ageing and older people need to be emphasised not only for service providers or professionals who frequently have contact with older people, but also for students and the public (Cherry and Palmore Reference Cherry and Palmore2008; Park, Lee and Ryu Reference Park, Lee and Ryu2016). When it comes to older people, despite the results regarding the higher level of discriminatory behaviour of older people than of younger people, the fact that the three perception variables were unrelated to real behaviour reveals the possibility that the discriminatory behaviour of older people could be influenced by other significant variables. Therefore, more sophisticated approaches are required to identify other significant factors that affect discriminatory behaviour. The factors related to the ageism that older people have towards their own age group, such as socio-demographic characteristics, social norms, media impact and ageing anxiety, should be considered (Bodner Reference Bodner2009; Shin Reference Shin2012).
Despite the present study presenting differential perceptions and discriminatory behaviour towards older people and the associations between knowledge, perception and behaviour of older and younger people, it has several limitations. First, the age-group differences were analysed with only two groups, younger and older people; however, further ageism research is required with a more specific age-group classification to reflect different attributions of each specific age group. It seems that the lack of some significant differences between the two groups may come from the broad age group classification. The specific classification into younger people, middle-age people and older people may provide distinct evidence for age-group difference in a future study. Second, self-report scales are susceptible to various interferences, such as social desirability because people tend to deny or minimise the frequency of their negative attitudes or behaviour if they perceive it to be wrong or socially undesirable (Cherry and Palmore Reference Cherry and Palmore2008). Therefore, future research should use the observational measurement for implicit procedure or qualitative methods for examining the actual discriminatory behavioural aspects of the respondents.
Furthermore, it is suggested that a study that addresses older people's experience with ageism should be conducted with a nationally representative sample in the future due to the limited nature of the quota sampling method used in this study, because the prevalence of ageism in society needs to be understood on both sides, by agents of behaviour and objects of experience. In addition, in future research, the comparison between actual behaviour and perceived behaviour could be provided for better understanding of ageism in Korea.
Acknowledgements
This work was supported by a National Research Foundation of Korea grant funded by the Korean Government (NFR-2013-S1A3A2055071). Both authors have contributed to the whole process of research, and drafting and editing the paper. There are no conflicts of interest to declare.