The Canadian Shift (CS) is a systematic lowering and/or retraction of /ɪ/, /ε/, and /æ/ in Canadian English. Although the progress of the CS across Canada has been investigated extensively in production, perception of the CS has received comparatively little attention. In general, the relationship between production and perception in ongoing chain shifts is underresearched, leaving many questions unanswered regarding how changes in pronunciation correspond to changes in perception (Kendall & Fridland, Reference Kendall and Fridland2012; Thomas, Reference Thomas2002). This paper investigates the apparent-time trajectory of the /ε/ and /æ/ vowels in both production and perception.
Using data from a community in Montreal, we present new apparent-time evidence for the CS. In our production study, we elicited the nonhigh short (lax) /ε/, /æ/, /ʌ/, and /ɔ/ vowels from a group of 28 Anglophone Jewish Montrealers. We find age differences to be more pronounced for /ε/ than for /æ/. This suggests that the shift's earliest stage, the retraction of /æ/, is stabilizing. We furthermore show that if a speaker manifests a shift in /æ/, they also manifest a shift in /ε/, showing a link between the two vowels. In our perception study, the same participants judged synthetic vowel stimuli as belonging to categories represented by the words bet, bat, but, or bought. The results indicate that although people differ in the degree to which they produce innovative forms, they do not differ as much in vowel perception; even speakers who are leading the change (young women) exhibit only minor trends toward altered vowel perception. This is consistent with a view of incremental vowel change in which speakers may advance a shift's trajectory in production but retain flexibility in perception, presumably due to constant exposure to both conservative and innovative variants.
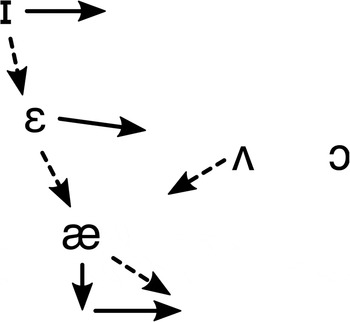
Both our production study and our perception study aim to add to the descriptive coverage of the CS. Clarke, Elms, and Youssef (Reference Clarke, Elms and Youssef1995) first reported that the /æ/, /ε/, and /ɪ/ vowels of English speakers from Ontario were involved in a chain shift, which they described as a lowering of the front lax vowels in apparent time (Figure 1). Many North American dialects such as Canadian and Californian English exhibit the merger of /a/ and /ɔ/ (lot and thought, as well as palm, in Wells's lexical set [Reference Wells1982]). Labov (Reference Labov and Eckert1991) predicted that this merger would result in a relatively stable “third dialect,” avoiding the ongoing chain shifts affecting the Northern Cities and the South. However, the low back merger instead created the conditions for /æ/ to lower and retract into the space vacated by /a/, with /ε/ and /ɪ/ subsequently moving. This shift has not only been noted in Canada, but also in other regions with the low back merger such as California (Eckert, Reference Eckert2008; Kennedy & Grama, Reference Kennedy and Grama2012; Labov, Ash, & Boberg, Reference Labov, Ash and Boberg2006), Columbus, Ohio (Durian, Reference Durian2012), Southern Illinois (Bigham, Reference Bigham2010), and Hawai‘i (Drager, Kirtley, Grama, & Simpson, Reference Drager, Kirtley, Grama and Simpson2013).
Dashed lines indicate the CS according to Clarke et al.'s (Reference Clarke, Elms and Youssef1995) impressionistic analysis; solid lines indicate Boberg's (Reference Boberg2005) evidence from Montreal.

Research following up on Clarke et al. (Reference Clarke, Elms and Youssef1995) has confirmed the existence of the CS across Canada. However, studies have reported a variety of different phonetic trajectories. To take just a few examples: Labov et al.'s (Reference Labov, Ash and Boberg2006) Atlas of North American English, based on Canada-wide data from their Telsur project, described the CS as a chain shift involving first the retraction of merged /ɔ/,Footnote 1 followed by the retraction of /æ/, and finally the lowering and retraction of /ε/ into the space vacated by /æ/. Sadlier-Brown and Tamminga (Reference Sadlier-Brown, Tamminga and Jones2008) showed that among both Halifax and Vancouver speakers, /ɪ/ and /ε/ were retracting and lowering. On the other hand, they found /æ/ to be just retracting in Vancouver and both retracting and lowering in Halifax. Hoffman (Reference Hoffman2010) found young women to be leading the retraction of /æ/ in Toronto, while younger Torontonians as a whole were found to both retract and lower /ε/.
In Montreal, Boberg (Reference Boberg2005) found /æ/ to have lowered before starting to retract in apparent time; he also found retraction of /ε/ and /ɪ/, but no statistically reliable degree of lowering. He argued that these findings are problematic for the definition of the CS as a pull shift, in which /æ/ might be expected to retract into the unfilled space created by the merger of the low back vowels, followed by /ε/ and /ɪ/ lowering into the space created by /æ/. Instead, the CS may manifest itself as a series of parallel retractions. This poses a dilemma for theories emphasizing vowel contrast maintenance (e.g., de Boer, Reference de Boer2001; Martinet, Reference Martinet1955) that would predict the low back merger and movement of /æ/ to primarily affect vowel height rather than the front-back dimension.
Following Boberg (Reference Boberg2005), Roeder and Jarmasz (Reference Roeder and Jarmasz2010) provided a model of the CS as a systematically related series of retractions. Their study of Toronto English found strong retraction in /ε/ and /æ/, but they also reported retraction in /ɔ/, suggesting the following:
rather than a chain shift, /æ/ and /ε/ are simultaneously redistributing within the reconfigured vowel space resulting from the low back vowel merger, and are engaged in a parallel shift that is motivated by the tension between forces of articulation, perception, and contrast. We propose that the vowels are ultimately moving towards equilibrium of a symmetrical vowel system. … The Canadian Shift comprises two stages. The first involves concurrent lowering and retraction and the second involves retraction only and includes retraction of /ɔ/. (397–398)
Roeder and Gardner (Reference Roeder and Gardner2013) elaborated on the phonological underpinnings of these movements by analyzing the feature specification of Canadian English vowels, with only contrastive features treated as active within the phonology. In their system, the /æ/ phoneme is specified as [–Peripheral, –High, +Low] and the merged /ɔ/ phoneme as [+Peripheral, –High, +Low]. Seen this way, the absence of a phonological feature specifying the “horizontal” (F2-related) dimension frees /æ/ to move along this dimension phonetically. Moreover, in their system, movement of /æ/ and /ε/ is thought to be affected by phonetic pressures, in particular with respect to perceptual dispersal accounts (de Boer, Reference de Boer2001; Liljencrants & Lindblom, Reference Liljencrants and Lindblom1972), which state that vocalic systems optimize the perceptual distance between vowels.
Varying descriptions of the CS may reflect differing stages of the shift, as well as differing methodological approaches, rather than any large regional distinctions (Kettig, Reference Kettig, Louviot and Delesseforthcoming). At present, many questions remain open with respect to the trajectory of the CS and its status as a series of parallel phonetic retractions or a chain shift triggered by an earlier phonological merger. We report on data from Montreal, precisely the city where Boberg (Reference Boberg2005) found parallel retraction.
PRODUCTION STUDY
Montreal: Sample and historical context
Over the course of the 18th and 19th centuries, several Anglophone communities took root in Montreal as successive waves of immigrants from the British Isles and from Southern and Eastern Europe settled in the city and adopted (or retained) English as a home language. Quebec's “Quiet Revolution” in the 1960s made French the sole language of government, business, and schooling. This prompted an exodus of Anglophones from the province; since the establishment of these language laws, Montreal has lost over a third of its English-speaking population (Boberg, Reference Boberg2010). The 2011 Canadian census reported that in Greater Montreal, 9.9% of residents use English as their sole language at home, 9.5% are domestic English/French bilinguals, and nearly 5.2% use English and some other language at home. English speakers in Montreal are thus greatly outnumbered by those speaking French at home, who total over 56.6% of residents (Statistics Canada, 2011).
Boberg (Reference Boberg2004) has described the three main ethnic varieties of Montreal English as British/Irish, Italian, and Jewish. These ethnolects differ along a number of linguistic dimensions, including the phonetic realization of vowels. This study was limited to the city's Jewish community (population ~80,000). In order to qualify for the present study, subjects needed to have been born and raised in Montreal with at least one Jewish parent and had to report English as a first and home language. None of the participants reported impaired hearing.
We carried out interviews in early 2013. Our sample comprised a total of 12 younger participants and 16 older participants, 10 women and 18 men (see Table 1).
Gender and age composition of participant sample

Methodology of production study
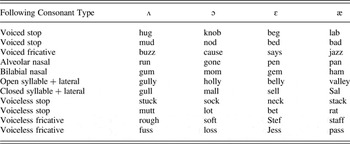
Participants were recorded reading a list of 44 sentences containing words with the /ε/, /æ/, /ɔ/, and /ʌ/ vowels under primary stress, for example, “He bought it at the mall, not at the supermarket” (see Appendix A for full carrier sentences). We attempted to balance target words for the voicing, place, and manner of articulation of the consonant following the vowel (see Table 2); these linguistic factors have been shown to variably favor or inhibit aspects of the CS in production (De Decker & Mackenzie, Reference De Decker and Mackenzie2000).Footnote 2
Target words elicited in production study

Some interviews were recorded in sound-attenuated booths at McGill University using a head-mounted Logitech H390 microphone-headphone set for both the perception and production tasks. For the interviews that were conducted in participants' homes and offices, a professional high-definition USB recorder was used for the production task and a set of over-ear Sennheiser headphones was used for the perception task. In all cases, speech was recorded with Praat version 5.3.37 (Boersma & Weenink, Reference Boersma and Weenink2013) at a sampling rate of 44,100 Hz. The subject was left alone in a silent room or inside the booth for both tasks.
All wave file recordings were processed with the Prosodylab-Aligner software (Gorman, Howell, & Wagner, Reference Gorman, Howell and Wagner2011) to force-align phonemes. After alignment, each token was manually checked. In addition to analyzing the 44 tokens of stressed short vowels, we extracted 22 vowels from the surrounding carrier sentences in order to conduct normalization of the vowel space for all participants (see http://www.github.com/bodowinter/canadian_vowel_shift_analysis/). F1 and F2 data were extracted from the midpoint of each short vowel and the 33% and 66% points of each long/diphthongal vowel (Harrington & Cassidy, Reference Harrington and Cassidy1994), using a slightly modified Praat script by Lennes (Reference Lennes2003).
F1 and F2 normalized values were calculated with the NORM online software suite (Thomas & Kendall, Reference Thomas and Kendall2007), using the method described by Lobanov (Reference Lobanov1971) and following the best practice suggestions of Adank, Smits, and van Hout (Reference Adank, Smits and van Hout2004). Normalized values were rescaled into Hertz in order to orient the vowels in relation to each other in a more familiar way. However, it should be noted that these rescaled values are not directly comparable to those of the synthetic vowels of the perception task, which represent actual formant values.
Results
All statistical analyses were conducted with R version 3.2.2 (R Core Team, 2015).
The R package “lme4” version 1.1.12 (Bates, Mächler, Bolker, & Walker, Reference Bates, Mächler, Bolker and Walker2015) was used for the mixed-model analysis reported herein. The package “car” version 2.0.26 (Fox & Weisberg, Reference Fox and Weisberg2011) was used for plotting vowel confidence ellipses. The package “dplyr” version 0.5.0 was used for data manipulation and processing (Wickham & Francois, Reference Wickham and Francois2015). The analysis and data can be retrieved through an openly accessible repository: http://www.github.com/bodowinter/canadian_vowel_shift_analysis/.
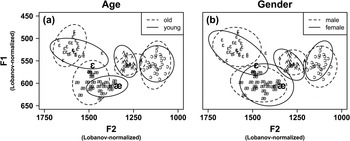
We first lay out the observed patterns in purely descriptive terms. Figure 2 displays the Lobanov-normalized and rescaled vowel space, with each vowel symbol representing the mean F1/F2 of one speaker. In Figure 2a, 95% confidence ellipses are drawn separately for the older speakers (dashed lines) and the younger speakers (bold lines). In Figure 2b, the confidence ellipses are drawn separately for men (dashed lines) and women (bold lines).
Lobanov-normalized F1/F2 speaker means with 95% confidence ellipses for (a) the two age groups and (b) men and women; the two large bold /æ/ and /ε/ speakers are the speakers selected as “shift leaders” in our analyses.

As can be seen, age differences are most pronounced for /æ/ and /ε/. The horizontal orientation of the ellipses indicates that the apparent-time change for /æ/ is primarily one in F2. For /ε/, the apparent-time change is expressed both in F1 and F2, although more strongly in F2; thus, /æ/ seems to only be retracting in apparent time, while /ε/ is mainly retracting with a tendency toward lowering.
Note the difference in the extent of the ellipses, an indicator of variation across speakers. The F1 dimension of /æ/ exhibits much less variability for the young group, suggesting that the change has stabilized along this dimension: younger speakers do not differ much with respect to the height of /æ/, but they do differ in the extent to which they participate in its retraction. Compared to /æ/ and /ε/, age differences in /ʌ/ and /ɔ/ are less pronounced. This is as we would expect given that most of the movement observed in the CS involves the short front vowels.
A look at Figure 2b reveals that there are by-gender differences that resemble the by-age differences. In particular, the solid ellipses (women) are more retracted for both /æ/ and /ε/. This finding is in line with general principles of sociolinguistic variation, which state that young females lead “change from below” (Eckert, Reference Eckert1989; Labov, Reference Labov1990). Moreover, the stronger retraction for female speakers is consistent with the previous literature on the CS (Boberg, Reference Boberg2010; De Decker, Reference De Decker2010; Hoffman, Reference Hoffman2010).
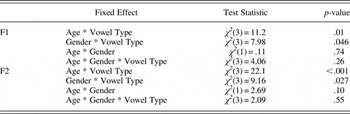
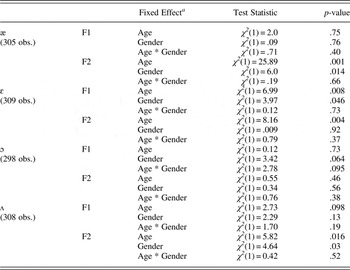
To assess vowel differences statistically, we first tested for an interaction between Age Group (two levels: young vs. old) and Vowel Type (four levels: ε, æ, ʌ, ɔ) using separate linear mixed-effects models, one with F1 as dependent measure, and another with F2 as dependent measure.Footnote 3 An interaction between the Age Group and Vowel Type factors would indicate that different vowels were produced differently by different age groups, in other words, some vowels were affected more by this sociolinguistic category than others. Indeed, for both F1 and F2, we found a statistically reliable Age Group * Vowel Type interaction (see Tables 3 and 4 in Appendix B for detailed statistical results). There were also Gender * Vowel Type interactions for both F1 and F2, indicating that men and women had different productions for some vowels, but not for others. There were no three-way interactions (Gender * Age * Vowel Type) for F1 or F2, nor were there any two-way interactions for Gender and Age. The absence of any Gender * Age interaction is theoretically meaningful with respect to the idea of “young females” as leaders of sound change: these results suggest that being female involves leading the change, as does being young, but these two factors are independent, that is, the influences of gender and age are additive rather than multiplicative.
We additionally performed individual tests for each vowel. Crucially, this analysis revealed that for /æ/, there was a difference between young and old speakers with respect to F2, but not with respect to F1. Thus, /æ/ was more retracted for younger speakers, but there were no age differences in vowel height. On the other hand, /ε/ exhibited statistically reliable differences between young and old speakers for both F1 and F2, indicating that it was both lowered and retracted among younger speakers. As expected, there were no age differences for /ɔ/ in F1 or in F2 (all p-values > .05); however, there was an effect of Age Group for the F2 of /ʌ/, with younger speakers having relatively more fronted /ʌ/.
Omnibus analysis (across all vowels) (1220 observations)

Analysis by individual vowel

a See Table 1 for gender and age composition of participant sample.
Compared to the age differences, the gender differences in vowel production were found to be much smaller within the present dataset. There was a statistically reliable effect of Gender for the F2 of /æ/, but not for the F1 of /æ/. That is, women retracted /æ/, but there was no statistical support for them also lowering /æ/. For /ε/, the picture was reversed: there was a Gender effect for F1, but not for F2. We thus find that women were more likely to lower /ε/, but we do not find statistical evidence that they retracted /ε/ more than men did. Women also exhibited reliably more fronted realizations of /ʌ/.
Again, there was no indication of any Age * Gender two-way interactions for the analyses of individual vowels (all p > .05). This is another piece of evidence in support of the notion that age-related differences and gender-related differences are independent of each other.
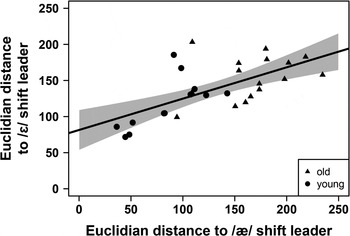
The CS has been described as a pull shift, specifically a lowering and retraction of /æ/ followed by /ε/. However, so far, researchers have analyzed the connection between these two vowels only impressionistically, noting that where one is lowered/retracted, the other one is too. Here, we provide more stringent quantitative evidence for a connection between /æ/ movement and /ε/ movement. The link between these two vowels can be quantified by measuring the degree to which the position of an individual speaker's /æ/ corresponds to the speaker's position of /ε/. We selected two speakers with the most retracted/lowered mean realizations, which happened to be a male speaker for /æ/ and a female speaker for /ε/. We then calculated the Euclidian distance to the F1/F2 position of these shift leaders for each speaker and each vowel separately. The resulting measure characterized how advanced each speaker was with respect to the two leaders selected. Crucially, across speakers, Euclidian distance from the shift leader in /æ/ was found to be correlated with Euclidian distance in /ε/ [correlation test, t(26) = 4.31, p = .0002], as shown in Figure 3. The correlation between the two distances was quite high (r = .65). Figure 3 furthermore shows older speakers to be considerably further away from the /æ/ and /ε/ shift leaders (who are from the young group anyway), reflecting the age effect already reported. Finally, this visualization also suggests that the relationship between /æ/ and /ε/ was not qualitatively different for young and old speakers; in both groups the positions of the two vowels were associated with each other in a continuous fashion. A formal test of this idea in a linear regression (/ε/ distance as a function of /æ/ distance * Age Group) revealed no significant interaction [F(3, 20) = .78, p = .52], suggesting that the distance slopes were similar for both groups.
Correlation between /æ/ and /ε/ “shift-leadingness,” with each data point representing a single speaker: speakers who were closer to the shift leader in /æ/ were also closer to the shift leader in /ε/.

Figure 3 only shows the distance to the shift leaders (shown in Figure 2) and cannot be interpreted to show that the distances between the /æ/ and /ε/ means themselves differed by group. Examining the average Euclidian distance between /æ/ and /ε/ for each speaker revealed no main effects of Age [F(1, 24) = 3.41, p = .078] or Gender [F(1, 24) = 3.07, p = .09], and no interaction effect [F(1, 24) = 2.16, p = .15]. Descriptive analysis of numerical trends revealed slightly higher /æ/ to /ε/ category distance for young speakers than for old speakers (174 Hz vs. 148 Hz) and also slightly higher distance for female speakers as opposed to male speakers (177 Hz vs. 149 Hz). These results are consistent with the idea that the diachronic progression of the CS involves dispersal, making /æ/ and /ε/ slightly more distinct; however, the absence of strong statistical support for increased category distance indicates that the pull chain movement of /ε/ following /æ/ is a stronger pattern than the concomitant dispersal.
Although these findings do not in and of themselves support a chain shift proposal (i.e., /æ/ and /ε/ could be moved along the trajectory because the same pressure to optimize perceptual dispersal acts on them simultaneously), they do at least show that the positions of the two vowels are associated within speakers, suggesting that some systemic pressure (chain shift, dispersal, etc.) is active, in other words, the movements of the two vowels are connected in apparent time.
Discussion
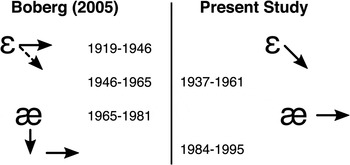
Figure 4 summarizes the movements observed by Boberg (Reference Boberg2005) in Montreal and the present study, with a side-by-side comparison of the birth years of each study's subject groups. Boberg (Reference Boberg2005) found lowering of /æ/ between his oldest and middle age groups followed by retraction in the youngest speakers, that is, two distinct movements, first downward and then back. In contrast, here we find /æ/ to be retracting without lowering. For /ε/, Boberg (Reference Boberg2005) found retraction with marginal but nonsignificant lowering between his middle and youngest groups (represented by a dashed arrow in Figure 4), similar to our finding of more robust movement along the F2 dimension; however, we also find a smaller but statistically reliable amount of lowering of /ε/ along the F1 dimension. Thus, we find /ε/ to be both lowering and retracting, with retraction as the more dominant pattern.
Comparison of results from Boberg (Reference Boberg2005) and our production experiment. Birth years of the groups in each study are listed: Boberg's (Reference Boberg2005) middle group is approximately equivalent to our older group, while our younger group represents a generation not covered by the previous study.

Because the oldest speaker in our young age group was born after Boberg's (Reference Boberg2005) youngest speaker, we interpret these differences as supporting his assertion that “/æ/ began to move lower among baby-boomers but reached the maximum extent of this shift (the bottom of the vowel space) by the mid-1960s” (144). In contrast, there was still room along the front-back dimension, allowing for further retraction. The more recently initiated movement of /ε/, on the other hand, exhibits the same pattern as was observed for Boberg's (Reference Boberg2005) middle and young groups, with /ε/ showing significant retraction and (now statistically reliable) lowering. This temporal hypothesis corresponds with our finding of lower variability in /æ/ than in /ε/ for our young group, suggesting that the movement of /ε/ is still in full force even as /æ/ has fully stabilized in F1 and has slowed down its movement in F2. The finding that the younger group and women pronounce comparatively fronted /ʌ/ is not unprecedented among CS studies; we will return later to a discussion of the consequences of this possible increase in overlap between /ε/ and /ʌ/ in the vowel space.
PERCEPTION STUDY
Perception studies in the context of vowel shifts
In an early study of intercommunity variation in speech perception, Willis (Reference Willis1972) analyzed differences in vowel categorization between Fort Erie, Ontario, and Buffalo, New York. Western New York preserved the /a/–/ɔ/ distinction, while the low back merger had been well-reported across Canada by the time of Willis's study. Though neither Buffalo's Northern Cities Shift nor Ontario's CS had been noted in the sociolinguistic literature at the time of his investigation, Willis (Reference Willis1972:249) observed upstate New Yorkers' “peculiar pronunciation … variously described as fronting, lengthening, and diphthongization of /æ/.” He focused on how each community's /ε/–/æ/ (bet vs. bat) and /æ/–/ɔ/ (hat vs. hot) spoken distinctions were reflected in their perceptual categorizations of vowels. His major finding was that the two groups of respondents indeed tended to divide their vowels differently depending on the pronunciations most often used within their communities.
De Decker (Reference De Decker2010) tested vowel assignments of /æ/ and /ɔ/ among Ontario English speakers of various ages. He resynthesized the vowel in sack to create 19 different stimuli, with F1 held constant around 1000 Hz and F2 ranging from 2006 Hz to 1259 Hz. The result was a single continuum of sounds from sack to sock, which participants categorized as sack, sock, or “could be either.” He found an effect of gender among the young and middle-aged listeners, with women more likely to accept more retracted stimuli (lower F2) as instances of /æ/.
In a handful of cases, perceptual investigations have been paired with analyses of speech production. Janson (Reference Janson1983, Reference Janson, Ohala and Jaeger1986) explored a vowel shift in Stockholm Swedish. He elicited participants' spoken /o:/ and /a:/ and administered a perceptual experiment involving a forced choice between the two vowels along a single 20-step continuum. He found that the differences in vowel production between young and old speakers were considerably larger than the differences in perceptual categorization, suggesting that a shift in perception may lag behind changes in production.
Kendall and Fridland (Reference Kendall and Fridland2010) investigated how individual variation in the production of /ε/ and /eɪ/ in the Southern Vowel Shift in Memphis, Tennessee, affects categorization of the two vowels along a single seven-step continuum. They found that listeners with greater degrees of /eɪ/ centralization in their own speech classified more central stimuli as /eɪ/ than nonshifted listeners did (see also Fridland & Kendall, Reference Fridland and Kendall2012; Kendall & Fridland, Reference Kendall and Fridland2012). This is one of the clearest demonstrations of an association between production and perception in ongoing vowel shifts; it supports the view, voiced by Roeder (Reference Roeder2010:179), that “individuals have a more difficult time understanding pronunciations that they themselves do not use, even if those pronunciations reflect standard local norms.”
In our perception experiment, we explore whether a similar coupling can be observed for the CS as well. Specifically, if a vowel shift in production goes along with a shift in perception, we would expect young female listeners to be most likely to accept highly retracted vowels as belonging to the /æ/ and /ε/ categories. If, however, as in Janson's (Reference Janson1983, Reference Janson, Ohala and Jaeger1986) analysis of Swedish vowels, perception lags behind production, we should see less pronounced differences in our perception study than in the production study. Specifically, following Janson (Reference Janson1983:31), it is plausible that younger speakers “still must classify the older generations' sounds correctly—something they learned when they were small children. Thus perception cannot shift too radically away from the parents' pattern.”
Procedure
The listeners were the same 28 subjects that participated in the production study. The perception task was conducted immediately after the production task.
We created stimulus vowels covering a two-dimensional continuum of F1 and F2 values. Participants had the four short/lax monophthongs /ε/, /æ/, /ʌ/, and /ɔ/ as simultaneous response options (4-AFC task). These four categories were represented by the words bat, bet, but, and bought appearing on the screen as four large, labeled buttons of equal size. Each of the stimuli was presented once to all subjects in a single, randomized order.
We synthesized the vowel stimuli in Praat (Boersma & Weenink, Reference Boersma and Weenink2013). Stimuli all had a falling fundamental frequency (F0) contour from 150 Hz to 100 Hz, making them sound like a human male voice. The average duration of stressed short vowels ranges from about 75 msec to 250 msec in North American English (Escudero & Polka, Reference Escudero, Polka, Sole, Recansens and Romero2003; Wang & van Heuven, Reference Wang, van Heuven, van de Weijer and Los2006). We therefore synthesized vowels with a duration of 250 msec; piloting the task revealed that this duration made stimuli still sound like short vowels while at the same time making them easy to perceive.
The stimuli ranged in steps of 50 Hz along an F1 continuum from 700 Hz to 950 Hz (6 steps) and along an F2 continuum from 1200 Hz to 1950 Hz (16 steps), yielding a total of 96 stimuli (6 F1 values × 16 F2 values). When comparing the F1 × F2 space spanned by these continua to measurements of Montreal English provided by Boberg (Reference Boberg2005), the space spans the entirety of the distribution of /æ/ and /ʌ/, as well as most of /ɔ/ and the lower/backer section of /ε/.
Each trial started with a 250-msec masking tone of 150 Hz, followed by 250 msec of silence and then one 250-msec vowel stimulus. The experimental procedure was written in JavaScript and run on Firefox 3.0. The experimental session started with six practice stimuli.
Results
Overall, participants categorized most stimuli as /æ/ (~38%), followed by /ʌ/ (~22%), /ε/ (~21%), and /ɔ/ (~18%). These overall response proportions did not differ starkly between the two age groups for /æ/ (old: 38%, young: 39%) or for /ɔ/ (old: 25%, young: 19%). However, listeners from the younger group overall indicated hearing more /ε/ (24%) than listeners from the older group (19%) did; listeners from the older group overall categorized more tokens as /ʌ/ (25%) than listeners from the younger group (19%) did.
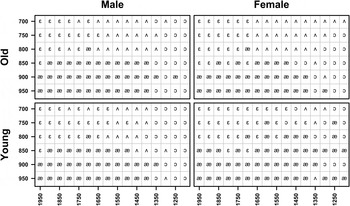
Figure 5 shows the most frequent categorization for each cell of the F1 × F2 space sampled by the synthetic vowel stimuli. First of all, it should be noted that there were many similarities among the four different groups. A noteworthy difference that appears to be somewhat systematic is that young female listeners were more likely to categorize vowels with low F2 (retracted) as /æ/. Moreover, for both men and women from the younger group, relatively lower F2 values were still accepted as /ε/. Finally, all listeners seemed to have difficulty localizing /ʌ/ at a consistent location along either the F1 or F2 dimension. Young female listeners in particular did not characterize many tokens as /ʌ/ at all.
Most frequent categorization based on F1 × F2 cell of the synthetic vowel continuum, split up by male/female and young/old responses; x-axis represents F2; y-axis represents F1.

To assess categorization statistically, we partitioned the F1 continuum and the F2 continuum for each of the four vowels /ε/, /æ/, /ʌ/, and /ɔ/ and each listener separately, using the binary partitioning algorithm from the R package “party” version 1.0.25 (Hothorn, Hornik, & Zeileis, Reference Hothorn, Hornik and Zeileis2006). This algorithm tries to find the binary split point that results in the purest division between one category and another. For example, listener F1937 was estimated to have an F2 threshold for /ε/ at 1650 Hz: most vowels with F2 values above it were categorized as /ε/, and most vowels with F2 values below it were categorized as something else, so taking 1650 Hz as the threshold creates the clearest division between “/ε/” and “non-/ε/” responses. For /ε/, a meaningful split could be estimated for all listeners. For /æ/, 6 listeners did not have a clear threshold, for /ɔ/ this number was 4, and for /ʌ/ it was 13 (of 28 participants). The fact that it was impossible for the binary partitioning algorithm to determine /ʌ/ thresholds for a large proportion of our listeners suggests that this vowel in particular was difficult to localize in the perceptual space that we presented to them.
These listener thresholds were then analyzed with analyses of variance with the factors Age Group and Gender. Interestingly, there were no statistically reliable effects for either one of these factors for any of the vowels, regardless of whether F1 or F2 thresholds were analyzed (all F < 3). For /ʌ/ thresholds along the F2 dimension, there were age [F(1,12) = 4.03, p = .067] and gender differences [F(1,12) = 3.6, p = .081] that were almost statistically reliable. Younger listeners had F2 categorization thresholds on average 131 Hz lower than those of older listeners; female listeners had categorization thresholds on average 103 Hz lower than those of male listeners. This suggests that for young listeners and female listeners, the threshold between /ε/ and /ʌ/ is perceptually retracting, with the space categorized by /ʌ/ shrinking rather than expanding at the expense of /ɔ/. For young women, /ʌ/ categorization is disappearing altogether, while /æ/ is taking over the parts of the vowel space that characterize /ɔ/ for other listeners.
As noted in the results section of the production study, we quantified each speaker's “shift-leadingness” by measuring the Euclidian distance to two particularly retracted/lowered speakers (see Figure 2). To test whether this speech production-based measure predicted a speaker's categorization thresholds in perception, we performed correlations of /ε/ and /æ/ Euclidian distances with all categorization thresholds. There were no statistically reliable effects (all p-values > .05); that is, we do not find evidence that a speaker's own production is related to their thresholds in perception.
Discussion
Our results show some tendencies for age and gender groups to pattern differently in perception. However, the picture is dominated by similarities between the groups, at least when compared to the large differences observed in the production study. It is possible that our failure to find reliable age, gender, or production effects in this perception experiment constitutes a type II error. For example, it could be that our design (or our analysis approach) did not have enough statistical power to investigate perceptual differences that were actually present in the population under study. However, we think that the present result can meaningfully be interpreted as a null result. First, we used the same number of speakers in both studies, and second, several ways of analyzing the perception data do not yield statistically reliable systematic differences between age groups or genders.Footnote 4 Thus, we are left to conclude that the differences in perception are at least smaller than the differences in production, consistent with Janson's (Reference Janson1983, Reference Janson, Ohala and Jaeger1986) statement that perception lags behind production in ongoing vowel shifts.
At the same time, younger women's acceptance of more retracted stimuli as /ε/ and /æ/ (Figure 4) demonstrates a tendency toward perception reflecting production patterns in this advanced group. Taken together with our finding that shiftedness in production does not correlate with shifted perceptual thresholds at the individual level, this raises the possibility that an individual's perceptual environment impacts their vowel categorization ability more than their own vowel production.Footnote 5 That is, perception is more strongly based on the surrounding sociolinguistic environment as a whole, which in most cases will include a fair degree of tokens from both young (shifted) and old (nonshifted) speakers. Although phonetic and psycholinguistic experiments have established links between perception and production (e.g., Jones & Munhall, Reference Jones and Munhall2000; Nielsen, Reference Nielsen2011), the vowel categorization processes investigated in this experiment may be comparatively less tied to how a speaker pronounces their own vowels.
OVERALL DISCUSSION
Our production study demonstrates that /æ/ and /ε/ are shifting in apparent time in the vowel spaces of English-speaking Jewish Montrealers. An analysis of interspeaker variation shows ordered heterogeneity, with young women leading the change and older men retaining the most conservative pronunciations, the typical progression for a sound change advancing in a community below the level of consciousness (Eckert, Reference Eckert1989; Labov, Reference Labov1990). It seems as though the operation of the CS in Montreal now involves the retraction of /æ/ without any accompanying lowering, whereas /ε/ is backing and slightly lowering in the vowel space.
As noted in the discussion of the production study, we interpret this to mean that the change has progressed in real time, as our participants represent an overall younger group than those in Boberg's (Reference Boberg2005) study. Now, our apparent-time data suggests that there is no further lowering of /æ/ for younger speakers, but there is still variation along the front-back axis. Over time, /æ/ has “bottomed out,” lowering as far in the vowel space as possible. This is consistent with Boberg's (Reference Boberg2005) finding of /æ/ lowering between his oldest and middle groups and then retracting in his youngest group.
The /ε/ vowel, on the other hand, appears to still be backing with a small but now statistically reliable amount of lowering. The correlation between individuals' participation in /æ/ and /ε/ shifting (Figure 3) could be taken as evidence for /æ/ movement “pulling” /ε/, in line with a chain shift interpretation. However, other interpretations of the /ε/ ~ /æ/ correlation are possible. For example, the shift could be a form of phonetic analogy, in which movement in /æ/ along the F2 dimension is mirrored by movement in /ε/ because phonetic dimensions are biased toward similar expression across different phonemes (see Wedel, Reference Wedel2006; Winter & Wedel, Reference Winter and Wedel2016). Alternatively, the link could perhaps be explained as a consequence of a move toward perceptual dispersal (see Vaux & Samuels, Reference Vaux and Samuels2015).
We favor the “pull chain” interpretation for several reasons. First, our findings suggest patterned variation along both F1 and F2 (not just a single dimension), and the apparent-time changes suggest that /æ/ has led the shift, followed by /ε/. In fact, /æ/ has stabilized, but /ε/ is still moving back and now shows stronger, not weaker, evidence of lowering. Parallel changes driven by phonetic analogy would be less likely to produce this sort of sequentiality. Second, an account that is merely based on phonetic dispersal is inconsistent with the observation that the distance between the /æ/ and /ε/ categories has not increased in a statistically reliable fashion, as well as the fact that /ε/ and /ʌ/ are moving toward each other, decreasing dispersion.Footnote 6 Third, phonologically neutral “phonetic drift” (Gardner, Roeder, & Childs, Reference Gardner, Roeder and Childs2016) does not explain the systematicity of the /æ/ and /ε/ movements, with the two being linked and with /æ/ leading /ε/. Thus, we find that a pull chain interpretation accounts best for the movement of the front monophthongs.
Though we do not necessarily believe it reflects an apparent-time change of the same importance, we find fronting of /ʌ/ in our younger and female groups. The original formulation of the CS included the assertion that /ʌ/ is either centralizing or lowering (see Figure 1) (Clarke et al., Reference Clarke, Elms and Youssef1995), and Eckert (Reference Eckert2008) claimed that /ʌ/ is fronting in the structurally similar California Shift. Durian (Reference Durian2012) reported lowering/retraction of /æ/, /ε/, and /ɪ/ and separately noted ongoing /ʌ/ fronting for speakers in Columbus, Ohio. While, according to statistics presented by Boberg (Reference Boberg2005:137), Labov et al.'s (Reference Labov, Ash and Boberg2006) sample of 10 Ontario speakers may exhibit some degree of fronting, Boberg (Reference Boberg2005) did not find statistically reliable /ʌ/ movement in his own Montreal sample. Other investigations since then have almost entirely disregarded /ʌ/ (Hoffman, Reference Hoffman2010; Roeder & Jarmasz, Reference Roeder and Jarmasz2009, Reference Roeder and Jarmasz2010; Sadlier-Brown & Tamminga, Reference Sadlier-Brown, Tamminga and Jones2008).
Traditional accounts of English phonology consider /ʌ/ as part of the same short vowel subsystem as /ε/ and /æ/; this makes the fronting of /ʌ/ puzzling, as it accelerates its collision course with /ε/ rather than moving in another direction to maintain perceptual dispersal. Theoretically, /ʌ/ could still maintain its status as an unmerged phoneme based on other phonetic cues, which would in turn suggest its membership in a subsystem structurally distinct from /ε/. Langstrof (Reference Langstrof2009), for instance, found evidence of duration being used as a primary cue differentiating /ɪ/ from /ε/ in archival recordings of New Zealand English, indicating one possible way for two vowels implicated in a shift to remain distinct at a stage when their F1/F2 ranges overlap.
As for categorization differences, our perception study finds some statistically weak indications of young females accepting more retracted vowels as /ε/ as opposed to /ʌ/, as well as a trend toward young females accepting more retracted stimuli as /æ/. The fact that the threshold difference for /ʌ/ is in the direction of the movement of retracting /ε/ rather than fronting /ʌ/ confirms our view that /ʌ/ movement is neither as perceptually salient nor as dramatically pronounced as the rest of the CS.
Overall, however, the picture in the perception study is dominated by similarities between the age and gender groups, mirroring Janson's (Reference Janson1983, Reference Janson, Ohala and Jaeger1986) findings of an ongoing sound change in Sweden. In particular, we suggest that while speakers participate in the shift in production, as listeners they must accommodate the fact that they are continuously exposed to both innovative and conservative variants in perception. We find no within-participant correlation between shiftedness in production and shiftedness in perception, but we do find trends in the direction of the shift at the group level. This indicates that an individual's perceptual performance may not simply be a reflection of their own production; instead, other factors such as their perceptual and sociolinguistic environment mediate this link.
A caveat with regard to the results of the perception experiment is that the vowel stimuli were played in isolation, with no surrounding consonantal context. Other successful perception studies have nested their vowel stimuli between consonants (De Decker, Reference De Decker2010; Rakerd & Plichta, Reference Rakerd and Plichta2010). Though several studies (Fox, Reference Fox1989; Rakerd, Reference Rakerd1984; Strange, Edman, & Jenkins, Reference Strange, Edman and Jenkins1979; Strange, Verbrugge, Shankweiler, & Edman, Reference Strange, Verbrugge, Shankweiler and Edman1976) indicated that a consonant-vowel-consonant (CVC) stimulus improves accuracy in vowel categorization tests, Macchi (Reference Macchi1980:1641) “failed to provide evidence that vowels spoken in consonantal context are better identified than naturally produced isolated vowels.” This finding is in line with the results of Strange, Jenkins, and Johnson (Reference Strange, Jenkins and Johnson1983), who found error rates in phoneme mapping with isolated short vowel stimuli based on modified natural speech to be relatively low. Diehl, McCusker and Chapman (Reference Diehl, McCusker and Chapman1980) found a slight advantage in selecting written CVC syllables if modified natural stimuli were reinserted between consonants, but they found no identification advantage using synthesized stimuli. Though we acknowledge that a CVC stimulus could have been a methodological improvement, we do not believe that the lack of consonantal context is a big concern for the present perception study.
Another potential shortcoming of the perception experiment is that the speaking voice was entirely decontextualized. The stimuli themselves were all produced by a single synthesizer script, so they were controlled for any non-F1/F2 phonetic features, such as the values of F0, F3, and breathiness, which have been shown to carry social and linguistic information marking gender and age (Johnson, Strand, & D'Imperio, Reference Johnson, Strand and D'Imperio1999). The F0 contour of 150 Hz to 100 Hz made the synthetic voice seem relatively more male than female, but the stimuli were otherwise unmarked for any dialect or age group. Knowledge about a speaker's gender (Johnson et al., Reference Johnson, Strand and D'Imperio1999; Strand, Reference Strand1999), age (Drager, Reference Drager2010), and dialect (Hay, Nolan, & Drager, Reference Hay, Nolan and Drager2006; Niedzielski, Reference Niedzielski1999) has been found to influence speech perception behavior; perhaps hearing a “male” voice could have caused listeners to ascribe certain sociolinguistic features to the presented stimuli. For example, since our production study showed male speakers to be less advanced in the CS than female speakers are, listeners might have attributed conservative vowel positions to the speaking voice. Finally, the use of synthesized stimuli (though convincingly human-sounding) may have suggested a more formal variety of English, which could lead to a reduction of shift phenomena that are presumably associated more strongly with informal speech styles.
CONCLUSION
The evidence presented here contributes to the development of theories concerning the phonological and phonetic underpinnings of the CS. The results of our production task, when compared with Boberg's (Reference Boberg2005) apparent-time results for Anglophone Montrealers, indicate that changes seem to have occurred in the trajectories of /æ/ and /ε/: /æ/ has “bottomed out” in the F1 dimension and is now only retracting, while /ε/ exhibits both retraction and lowering.
Two results from our production study are worth highlighting. First, we find /æ/ and /ε/ positions to be linked within individuals. This, together with the fact that /æ/ appeared to lead the CS and is now stabilizing, suggests to us that the CS is most adequately characterized as a pull shift triggered by the merger of the low back vowels. Second, we found some degree of /ʌ/ fronting, although this was much less pronounced than any changes among the front vowels. This corroborates various reports of /ʌ/ fronting in other varieties of Canadian and American English.
The results of our paired-study methodology, which incorporated both production and perception, augment the literature on how ongoing vowel shifts are expressed in speaking and listening behavior, and how these two levels are related to each other. While the speakers in our sample varied in production as to their degree of participation in the shift, their vowel categorizations did not differ as much along either F1 or F2. Shift leaders were not observed to significantly shift in perception, despite younger speakers and women showing a weak trend toward accepting more retracted stimuli as /æ/ and /ε/. By collecting production and perception data from the same participants, we have demonstrated that while one might expect to find similar community-wide variability in vowel categorization as in vowel pronunciation, the need to accommodate to both innovative and conservative variants exerts a strong homogenizing effect in the perceptual domain.
APPENDIX A
Participants in this study were recorded reading the following sentences. The 44 target words containing the vowels under investigation are presented in bold, as participants saw them. The 22 anchor vowels extracted to conduct normalization are also underlined here.
-
1. He bought it at the mall, not at the supermarket.
-
2. Don't make such a fuss, I can solve it.
-
3. Did you make a bet, or do you not gamble?
-
4. Are you on the staff, or a customer?
-
5. Give me a hug, it's been a bad day.
-
6. Did you sleep on a bed, or a cot?
-
7. Was the game a loss, or a win?
-
8. I want a pen, not a pencil.
-
9. I want them in a stack, not all messed up.
-
10. The door has a knob, not a handle.
-
11. Whatever he says, I don't believe.
-
12. He wants to sell, not buy.
-
13. Was your day rough, or easy?
-
14. He doesn't eat ham, because he keeps Kosher.
-
15. It's a sock, not a stocking.
-
16. Does your phone buzz, or ring?
-
17. Is the phenomenon a cause, or an effect?
-
18. That bird is a gull, not a crow.
-
19. Go past the lab, and then turn left.
-
20. If you don't have a pass, you can't enter.
-
21. He broke his neck, not his back.
-
22. When I nod, enter the room.
-
23. Clean up all that mud, your hands are filthy!
-
24. She grows holly, not juniper.
-
25. Has he gone, or is he still here?
-
26. Hold the cat by the belly, not the arms.
-
27. Are you stuck, or can you continue?
-
28. It's in the valley, not on the mountain.
-
29. It's my friend Stef, not Michael.
-
30. The pear was soft, not hard.
-
31. Was it her mom, or her dad?
-
32. The dog was a mutt, not a purebred.
-
33. Do you play jazz, or the blues?
-
34. His dinner was bad, so he sent it back.
-
35. The dog may beg, but I won't give him a treat.
-
36. He fell in a gully, but we got him out.
-
37. Hand me the pan, not the pot.
-
38. Is that from Jess, or from George?
-
39. Is that a gem, or a fake stone?
-
40. That's not a rat, it's a mouse!
-
41. The guy's name was Sal, not Mike.
-
42. Did you run, or walk here?
-
43. Are you chewing gum, or food?
-
44. He poured me a lot, not just a bit.