1 Introduction
News media focus intently on the urban–rural divide as a source of American political polarization. For example, The New York Times featured 48 articles about America’s urban–rural political divide in 2018 and 32 more in 2019.Footnote 1 In one week in June 2019, The Washington Post wrote articles on “How rural America can grab a bigger megaphone,” “Idealizing rural America,” and “When we think of America, we shouldn’t think rural.” Clearly journalists and opinion writers believe the urban–rural gap is a critical political cleavage in American politics. This interest in the urban–rural gap is shared by political scientists trying to understand increasing geographic divides in politics around the world (Rodden Reference Rodden2019) and rising rural resentment in the American political system (Cramer Reference Cramer2016). Accessible information on how to best conceptualize and measure rural concepts relevant to political science will enable researchers to more deeply explore the geographic political divide.
We intend for this article to equip readers with a methodological toolbox for studying the rural continuum in politics, with application to the United States. We focus on rural politics as a specific case of political geography that has high salience in our current politics, although many of the principles and methods we discuss are applicable to studies of political geography in general. To this end, we outline the resources available to political scientists to select appropriate geographic units and account for different concepts of rurality within their indicators. Meanings of urban and rural are varied, based on characteristics of locations (such as geographic distance, population density, and the economic basis of the economy) and personal identity. We begin by dissecting two measurement decisions crucial to the study of rural politics. The first challenge is choosing a unit of aggregation that reduces measurement error without unduly limiting potential data sources. The second challenge is choosing a measurement classification schema that accurately accounts for the theoretical notion of rurality intended by the researcher. This discussion of construct validity is applicable beyond the field of American politics, and we encourage other subfields and disciplines to engage in similar discourses about geographic construct validity. To improve access and quality of rural indicators, we introduce a new dataset of urban–rural classifications of U.S. state legislative districts and use it to replicate Broockman’s (2013) study of legislative responsiveness.Footnote 2 We then illustrate the consequences of geographic measurement decisions in studying rural American politics. First, we show that recent scientific knowledge on rural politics is sensitive to measurement decisions by replicating “Economic Segregation and Unequal Policy Responsiveness” by Flavin and Franko (Reference Flavin and Franko2020). Second, we demonstrate the importance of differentiating rural identity and rural location by showing remarkably low correlations between rural self-identification and actual rural residence (Mummolo and Nall Reference Mummolo and Nall2017). We argue that this distinction should be closely considered in research on the urban–rural divide. We conclude with a summary of the tools available to researchers to match their rural concept to existing datasets.
Despite its challenges, dismissing research on the urban–rural divide due to difficulties with conceptualization and measurement would miss out on very important political questions. Most evidently, rural political preferences and voting behavior may be crucial to understanding the rise of populism and growing political polarization in the United States and abroad. We provide practical advice for measuring the urban–rural continuum with a substantive emphasis on the rural end of the spectrum. Rural communities are critical to politically relevant topics of economic opportunity, economic mobility, and public health, and have outsized weight in American political institutions. Rural communities also feature prominently in discussions of political districting and gerrymandering. In this article, we provide guidance for empirically oriented scholars to examine the rural elements of these questions.
1.1 San Diego: Urban, Rural, or Both?
The example of San Diego, CA, sets forth the problem of measuring the concept of rurality for the purpose of conducting political science research. By many accounts, the city of San Diego is unequivocally urban, because it is the eighth largest city in the United States and home to 1.3 million people packed in at a density of 4,326 people per square mile. Much of the data on San Diego are measured at the level of its eponymous San Diego County, which has almost 2 million additional residents living outside San Diego city limits. It is the fifth most populous county in the United States, with more residents than 20 states. The county’s economy is largely service-based, focused on healthcare, computer and biotechnology, higher education, and military services.
Despite its metropolitan reputation, San Diego is geographically large, and population density varies widely. Covering 4,525 square miles, it takes over 2 hr to drive across the county from the border with Mexicali, Mexico to Fallbrook, CA, on the Orange County border. Many of San Diego County’s residents live in suburbs, exurbs, small towns, and remote rural areas. One such example is the unequivocally rural mountain town of Julian, CA, that has a population of 1,500, a population density of 190 people per square mile, and an agriculture-based economy.
San Diego County is commonly treated as an urban agglomeration, implicitly assuming a uniform distribution of people and preferences across the county. If we are trying to understand the causal links of rurality to political behavior, we obscure enormous variation on both factors by measuring San Diego County as urban. The political factors associated with urbanity, captured in San Diego’s average value, may explain why the county voted for Democrat Hillary Clinton over Republican Donald Trump by a margin of 18 points, but its suburban, exurban, and rural residents on the eastern edge of the county returned federally indicted Republican Congressman Duncan Hunter to office in 2018 by a margin of 4 points.Footnote 3
Analyses that code San Diego County as metropolitan erase the geographic, economic, and cultural heterogeneity within the county and fail to account for its (likely related) political heterogeneity. Perhaps the averaging out of San Diego’s population density, economic structure, or rural preferences reduces theoretical nuance, but may otherwise seem harmless from a measurement standpoint. After all, our theories are often primarily concerned with the “average resident” or the “median voter” in the county. Yet this logic is fundamentally challenged by concerns with the modifiable areal unit problem (MAUP), whereby measuring the same concept at different unit scales or zones results in different values (Lee and Rogers Reference Lee and Rogers2019; Wong Reference Wong, Fotheringham and Rogerson2009). We would get a very different accounting of the “rurality” of San Diego if we measured it as San Diego city, San Diego County, North–East–South-Coastal San Diego County (a common subdivision), zone improvement plan (ZIP) codes within, or the county’s incorporated cities.
This problem is not unique to San Diego. One-fifth of rural Americans live in metropolitan counties. Each time we measure rurality, we encounter choices of: (1) the appropriate geographic unit of aggregation and (2) the appropriate conceptualization of rurality to our theory. In the next section, we describe geographic unit options in American politics, and the trade-offs involved in choosing them. In the following section, we discuss different conceptualizations of rurality and how scholars can account for their preferred conceptualization across different geographic units.
2 Units of Aggregation
For most questions of political behavior, the optimal unit of analysis is the individual. With aggregation of data, we introduce choices about the appropriate unit of aggregation and aggregation statistic. In the case of geographic data, we must also consider the MAUP. Nonetheless, many important political phenomena are place-based, requiring aggregations into neighborhoods, communities, or local areas. We focus on choosing a unit of aggregation that reduces measurement error without unduly limiting potential data sources.Footnote 4
When studying geographic aggregations, researchers should be focused on choosing the unit that is theoretically relevant to the question at hand. For example, if we wish to evaluate preferences of state legislators from rural districts in comparison to those from urban districts, the clear unit of analysis is the legislative district. Similarly, we might examine voting in the U.S. Senate by comparing votes cast by Senators from predominantly rural states to those in majority urban states.
For many questions of political behavior, however, the unit of analysis will not be so clear. If we want to link individuals in surveys to the rurality of their location, for example, it is not obvious what the unit of aggregation should be. Is that individual’s location best captured by her ZIP code? Her county? Her legislative district? None of those measures accurately captures a universal notion of a “community” or “neighborhood,” the most common reference point when coding a location’s rurality (Wong et al. Reference Wong, Bowers, Williams and Simmons2012). Yet counties and districts frequently employed as indicators of an individual’s location.
As discussed briefly above, the MAUP has important implications for the choice of unit of aggregation. The MAUP involves two central features—problems of zoning and problems of scale. The zoning problem refers to the choice of where to draw our lines of geography. In most cases, we are using administrative “zones” to draw our lines. Research on the MAUP reveals that if we used some other zoning schema, such as simply shifting the administrative boundaries in one direction or another while retaining their size, our new units would have different means and standard deviations than the previous units. Thus, our results using existing administrative units provide a specific characterization of our geography. If this characterization of our geography is theoretically appropriate, there is no concern with the MAUP. However, if we have simply chosen the unit of geography that is available (such as the county) but is not theoretically relevant for the question at hand, we are faced with the possibility of the MAUP and our results being contingent upon our selection of a theoretically arbitrary geographic unit. With a plausible reformulation of that geography, the results may differ (Lee and Rogers Reference Lee and Rogers2019).
The MAUP scale problem refers to the size of the units employed. If we employ big units, such as the U.S. state, or counties such as San Diego, we have an average value that obscures considerable heterogeneity on most variables. If we use a smaller unit, such as the ZIP code tabulation areas (ZCTAs) or Census blocks, we include many “extreme” values that mischaracterize the experience of those living within them. Intuitively, the scale of the aggregation will be consequential for the characterizations we will discern from those units. These concerns need to be considered carefully when choosing the unit of analysis. Some of the classification schema discussed below may help to “scale” the measure to reduce concerns with the scaling problem of the MAUP.
Although the MAUP cannot be “solved,” we provide advice on how to minimize its potential impact. To summarize, we advocate focusing on the unit of aggregation implied by the author’s theory. If no clear theoretical unit is identified, scholars can demonstrate robustness in their results by aggregating to different units of analysis and by “scaling” the results to the closest approximate unit using the detailed urban–rural identification schema we lay out below.
2.1 Counties
County is a commonly selected unit of analysis in American politics research (e.g., de Benedictis-Kessner and Warshaw Reference de Benedictis-Kessner and Warshaw2020; Nall Reference Nall2015; Acharya, Blackwell, and Sen Reference Acharya, Blackwell and Sen2016). Counties are administrative units immediately below the state government.Footnote 5
The geographic size and political relevance of counties vary tremendously across states. In some states, counties have immense political authority and taxation and redistribution power, while in other states, the counties exist solely as units of aggregation. Rhode Island, Connecticut, and half of Massachusetts’ counties have no political function. In general, as one moves from the northeast corner of the country to the southwest corner, counties gain political importance, which is also highly correlated with the recency of county establishment. Counties may have broader authority in rural areas where unincorporated populations are more common (Scala and Johnson Reference Scala and Johnson2017). In addition to any political functions, counties are almost always employed as the substate unit used for data produced by the national and state governments. Because of their consistency over time and the preponderance of data availability, they are a common unit of geography in American politics research. However, counties have immense variation in their physical and population size.Footnote 6
Counties are extremely heterogenous; they are enormous in the western states and much smaller in the eastern states. Counties in the eastern United States were determined using a system of metes and bounds, essentially a detailed description of the county’s border using natural and cultural landmarks, such as rivers and churches. Counties in the western United States were drawn largely after the invention of land-surveying technology, which allowed for straight county borders that could extend into stretches of uninhabited land. For this reason, western counties are physically larger and can contain immense amounts of empty space. For example, San Bernardino County, CA, is geographically larger than nine states, and is close to the size of West Virginia.
Within-county heterogeneity is especially prevalent in the western United States, where much of the rural population of interest lives, because of the large physical size of counties. This raises concerns that the western counties are hiding much more variation in population density, political opinion, and economic structure when represented in research by county-level averages. Counties may not be comparable units in a theoretical or empirical sense for many studies.
Many scholars do not use a county-level urban–rural classification as their main independent or dependent variable but instead employ one in their control variables (e.g., Acharya et al. Reference Acharya, Blackwell and Sen2016; Gomez, Hansford, and Krause Reference Gomez, Hansford and Krause2007; Cho and Nicley Reference Cho and Nicley2008). It may seem that such a choice would not impact the main results, because measurement error is within the controls, not the variables of focus. However, even a control for rurality with a county indicator, when the county is not the theoretical unit, can significantly alter the results of the main variables (Soifer and Alvarez Reference Soifer and Alvarez2017; Lee, Rogers, and Soifer Reference Lee, Rogers and Soifer2019).
Given that the county is a common geographic unit of data collection of the American government, we may not be able to study smaller units.Footnote 7 The preponderance of data available at the county level may outweigh the costs of masking urban–rural divisions. To be sure, some questions, such as those about county sheriffs (Nemerever Reference Nemerever2019) or county legislatures (de Benedictis-Kessner and Warshaw Reference de Benedictis-Kessner and Warshaw2020) necessitate counties as the unit of analysis.
2.2 ZIP Code Tabulation Areas
Another commonly collected geographic unit is the ZCTA. The United States Postal Service uses ZIP codes to assign an address to a mail distribution center in a way that maximizes mail route efficiency. ZCTAs are created by taking the modal ZIP code in a census block and merging all adjacent census blocks with the same modal ZIP code.Footnote 8 There are 42,000 ZIP codes and 32,000 ZCTAs in the United States. The Census collects select demographic information for ZCTAs, and it is a preferred geographic unit of analysis for survey data, because ZCTAs are much smaller than counties. The mean population of a ZCTA is 7,638 people, with a standard deviation of 4,696 people. It is more common for a survey to ask for a respondent’s ZIP code than their full address (which they may be reluctant to share) or their census block (which they are highly unlikely to know). Yet, ZCTAs are not likely to be theoretical units of political interest.
2.3 Census Tracts, Census Blocks, and Precincts
Less frequently used units of aggregation include census tracts, census blocks, and voting precincts. Census tracts are statistical subdivisions of a county ranging between 1,200 and 8,000 residents that are used primarily for purposes of the Census.Footnote 9 Census blocks are subdivisions of census tracts, and thus counties and states. Unlike census tracts, census blocks are not bounded by population requirements and tend to remain more stable over time than tracts.Footnote 10 Political outcomes (e.g., distribution of programs or government funding), election returns, and measures of public opinion are rarely made available at the census tract or block level, in part, because they are politically arbitrary aggregations. Conversely, demographic information is not often collected by voting precinct. Researchers can use geographic information systems (GIS) and aerial interpolation to overlap census tract or block boundaries with voting precincts to ascribe demographic data to precincts (see Karp and Banducci Reference Karp and Banducci2000 for an applied example).Footnote 11 A second option is to seek out state-specific relationship files, such as the 2010 Census Block to Precinct Conversion File provided by the California Statewide Database. However, this is not yet available for many states and remains a promising opportunity for data creation.
3 Urban–Rural Classification Schema
Research on rural politics measures rurality in myriad ways, including population density (e.g., Acharya et al. Reference Acharya, Blackwell and Sen2016; Cho and Gimpel Reference Cho and Gimpel2010; Primo and Snyder Reference Primo and Snyder2010; Urban and Niebler Reference Urban and Niebler2014), absence of urbanity (e.g., Broockman Reference Broockman2013; Warshaw and Rodden Reference Warshaw and Rodden2012), agricultural economy (e.g., Scala and Johnson Reference Scala and Johnson2017), and population size (e.g., de Benedictis-Kessner and Warshaw Reference de Benedictis-Kessner and Warshaw2020). A substantial amount of research, however, alludes to rural places or rural voters, without serious efforts at conceptualization. For example, rural areas are often assumed to have agricultural or extractive economies. The routine account of rural demography is characterized as the cross section of whiter, older, and less educated. Yet these notions are at odds with fuller accounts of rural populations, which include substantial minority populations, affluent areas holding second homes, and significant nonagricultural industry. An important step in advancing research on rural politics in America will be closer consideration of what is theoretically important about rural America for researchers, and how those theoretical ideas of rurality might be operationalized. In this section, we discuss construct validity and lay out possibilities for coding common geographic units according to different classifications.
In our Supplementary Materials, we include an annotated bibliography of rural measurement strategies used in the American Political Science Review, American Journal of Political Science, and Journal of Politics in the last 10 years. We categorize the authors’ operationalizations as: Archival (i.e., using urban–rural designations from historical sources), Land Use Laws, Multiple Measures, Percent Urban, Population Density, Population Size, Self-Identification, and the largest category, Unclear. This bibliography provides a broad perspective of the variation in rural measurement in recent research, including inattention to careful measurement.
Once we have chosen the theoretically relevant unit of analysis, we must select the rural classification that best fits the theoretical construct of the research. The choice of rural classification is a theoretical one. Scholars may be interested in rurality, as it relates to population size or density, adjacency or proximity to a metropolitan area, commuting population, agricultural economy, or distance to public services. These measurement strategies use objective classifications to assign individuals or geographic areas to urban–rural categories, regardless of how urban or rural they believe themselves to be.Footnote 12 In contrast, recent rural ethnographies, such as Cramer (Reference Cramer2016), focus on rural self-identification, i.e., people’s beliefs that they are rural. Rural individual or group identity, or rural consciousness, should be measured by self-identification, which we discuss in Section 7.Footnote 13
3.1 Metropolitan, Micropolitan, or Nonmetropolitan
The Office of Management and Budget (OMB) classifies counties as Metropolitan, Micropolitan, or Neither. By definition, Metropolitan Statistical Areas must contain an urban core of 50,000 or larger population, while a Micropolitan Statistical Area contains an urban core of at least 10,000 population. All counties that are not part of a Metropolitan Statistical Area are considered nonmetropolitan, or rural (Office of Management and Budget 2010). Importantly, this is not equivalent to a measure of urban–rural. Counties included in metropolitan and micropolitan statistical areas contain both urban and rural territory and populations, such as the vast Grand Canyon, which spans two “metropolitan” counties in northeastern Arizona.
Studies of voting behavior that use this OMB measure (Morrill, Knopp, and Brown Reference Morrill, Knopp and Brown2007; Scala, Johnson, and Rogers Reference Scala, Johnson and Rogers2015) may not directly capture urban–rural electoral dynamics. Instead, these studies using metro/nonmetro counties capture the voting behavior of counties that contain a metropolitan area of 50,000 or more people compared with counties that do not contain a metro area of this size. Scholars interested in political behavior would be better-off employing measures that capture economic, cultural, or political differences across rural and urban areas, rather than the OMB metro/nonmetro classification of counties.
3.2 Holistic Scales: Rural–Urban Commuting Area Codes, Rural–Urban Continuum Codes, and Urban Influence Codes
A more detailed schema for coding the urban–rural spectrum is rural–urban commuting area (RUCA) codes. RUCA codes are released by the Department of Agriculture Economic Research Service (ERS) and use population density, urbanization, and daily commuting to classify census tracts into the 10 categories listed in Table 1. Within each integer category are subcategories for different commuting patterns. For example, category 6.2 has more commuting to a large UC than category 6.3. This allows researchers to distinguish between people who live in rural areas but have access to urban job opportunities and resources (such as hospitals) from those who live in rural areas and do not have regular contact with urban areas. Commuting distances can also proxy for access to political participation. Gimpel and Schuknecht (Reference Gimpel and Schuknecht2003) find that the distance and congestion of the commute to polling locations is associated with voter turnout rates. The RUCA code is a more specific operationalization than using a single factor such as population size or population density, maximizing researchers’ ability to detect differences between the lived experiences of rural and nonrural populations. RUCA codes are available for 1990, 2000, and 2010.
USDA rural–urban commuting area codes.

Although the Census Bureau publishes RUCA codes only for census tracts, the University of Washington Rural Health Research Centers publishes RUCA approximations for ZCTAs.Footnote 14 ZCTA-level codings are especially useful to political scientists because ZIP code is often the lowest geographic unit identified in major surveys, such as the cooperative congressional election study (CCES). ZCTA RUCA codes are available based on: (1) 2004 ZIP code areas and 2000 Census commuting data and( 2) 2006 ZIP code areas and 2000 Census commuting data.
After opting to use RUCA codes, researchers must decide whether to use them as a categorical variable or to aggregate them into urban and rural bins. Choosing which categories belong in the urban and rural bins changes not only the qualities of the populations, but the size of the sample and sampling frame. Sixteen percent of the U.S. population is rural if rurality is defined as those not living in a metropolitan area (codes 4–10). However, only 3% of the United States is rural using a strict definition of rural areas (code 10).Footnote 15 To see this visually, A1 shows how the size of the rural population shrinks, as the classification standards become more stringent.
Given more extensive county-level data availability, many researchers will decide to use county-level schema that classify counties according to similar criteria as the RUCA codes. The rural–urban continuum codes (RUCCs) and urban influence codes (UICs) are released by the USDA ERS. RUCCs distinguish counties by the population size of their metro area, degree of urbanization, and adjacency to a metro area (if nonmetro; Monogan and Gill Reference Monogan and Gill2016). UICs distinguish metropolitan counties by population size of their metro area, and nonmetropolitan counties by size of the largest city or town and proximity to metro and micropolitan areas. UIC codes are available for 1993, 2003, and 2013. RUCC codes are available for 1974, 1983, 1993, 2003, and 2013. RUCC codes span a larger period of time (1974–2013).
The RUCC and UIC codings are similar. When applied to CCES respondents, for example, RUCC and UIC correlate at 0.92. Table A1 enumerates these schemas alongside the OMB county-level codes. The USDA ERS has classified RUCC and UIC categories into a metropolitan/nonmetropolitan binary, but like the RUCA codes, researchers can choose to combine the categories or maintain the original coding and use it as a categorial variable.Footnote 16
3.3 Measuring Education, Economic Structure, Healthcare, Etc.
Scholars may also wish to study geographic units tied to specific policy delivery, such as school districts or proximity to healthcare. For scholars interested in differences in urban and rural schools, all U.S. public schools and school districts are coded on a 12-point scale incorporating both population size and distance to metropolitan areas.Footnote 17 Alternatively, ArcGIS enables researchers to overlap election returns with other data.
Measures of population size or density should not be used as a proxy for other concepts that might be more directly accounted for with existing data. For example, if scholars want to know which counties have low education levels and persistent poverty, two characteristics common in, but not unique to, rural areas, scholars can use the USDA ERS County Typology Codes. County typology codes classify counties by most prominent economic sector (farming, mining, recreation, nonspecialized, or government) and by individual indicators for the presence of any of the above categories. The typology also includes nonmutually exclusive binary indicators of low education, low employment, population loss, retirement destination, persistent poverty, and persistent child poverty. For example, USDA typology codes have been used to show how vote choice varies between rural recreation-based economies and rural farming-based economies (Scala et al. Reference Scala, Johnson and Rogers2015).Footnote 18
4 State Legislative District Urban–Rural Dataset
Holistic measures of urban–rural geography are not always available at the units of analysis of interest to scholars. For example, scholars of American politics may be interested in measuring the urban–rural makeup of state legislative districts to answer a wide range of questions. However, existing data do not provide high-quality mapping of urban–rural indicators onto state legislative districts.Footnote 19 To fill this need, we created a dataset of RUCA codes assigned to state legislative districts for boundaries in 2007, 2010, 2012, 2014, and 2016.
We created the State Legislative District Urban–Rural Dataset using the geographic relationship files from the Missouri Census Data Center’s Geocorr program. The Geocorr program allows us to match the census tract RUCA codes from the U.S. Census onto corresponding legislative districts. We use three methods for assigning RUCA codes to state legislative districts.
The first method probabilistically assigns RUCA codes to state legislative districts. Probability-based assignments allow researchers to avoid averaging the RUCA codes, which are ordinal variables and should not be treated as numbers. This method is similar to the approach used by Tausanovith and Warshaw (Reference Tausanovith and Warshaw2013). They probabilistically assign survey respondents to state legislative districts based on the proportion of people in their ZIP code that live in each district. For the creation of our dataset, we probabilistically assign RUCA codes to state legislative districts based on the proportion of the district population belonging to each of the 10 RUCA categories. One downside of this method is that it is possible that a state legislative district is assigned a RUCA code that represents a very small population of the district. While this procedure may introduce noise into the dataset, this type of assignment occurs without systematic bias.
The second method is using the averages of the RUCA scores weighted by population. Unlike probabilistic assignment, this value represents the diversity of RUCA codes within a district by using the average of RUCA values within the district instead of selecting a single RUCA value within the district. A drawback of this method is that the RUCA codes are ordinal values that thus should not be averaged, although this is common practice among political scientists.
The third method is to assign the RUCA code that describes the plurality of the legislative district. Unlike the first method, it ensures that the RUCA code is representative of a plurality of the district. This method is more accurate for districts in which a clear majority of the population belong to a specific RUCA code than it is for legislative districts nearly evenly split among many different RUCA codes. This method is likely too imprecise for statistical analyses but would be a useful descriptive statistic of the most common geographic classification within a district.
We encourage researchers to use data produced by the method that best aligns with their theory and to employ more than one measure in robustness checks. The correlations between the measures are shown in Table 2. The weighted average and plurality methods are highly correlated. Using them interchangeably is unlikely to significantly alter empirical results. As noted above, the plurality measure is not an appropriate method for drawing conclusions about a district overall.
Correlations among state legislative district RUCA classification methods.

Notes: Pearson’s correlations between methods of assigning RUCA codes to state legislative districts. Ninety-five percent confidence intervals in parentheses below the correlation coefficients.
More information on the creation of this dataset and diagnostic tests are included in the online Supplementary Materials. The methods used to create this dataset can be applied to other political units of aggregation, such as assigning RUCA codes to congressional or school districts.
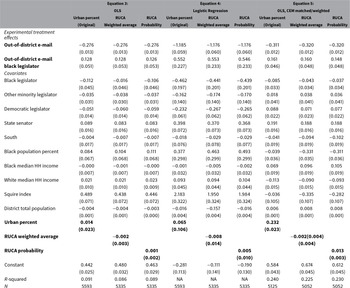
We pilot this dataset in a replication of “Black Politicians Are More Intrinsically Motivated to Advance Blacks Interests: A Field Experiment Manipulating Political Incentives” (Broockman Reference Broockman2013).Footnote 20 Broockman controls for the urbanity of state legislative districts with the variable “Urban Percent.” We replicate the analyses from Brockman (Reference Broockman2013) using the weighted average RUCA score and the probabilistically assigned RUCA score. These results are presented in Table 3.
Replication of Table 2 from Broockman (Reference Broockman2013).

Note: Dependent variable in all regressions is whether the legislator responded to the e-mail.
Across all three model specifications, both of the RUCA substitutions result in increased the statistical significance of Broockman’s experimental treatment effects, despite a decrease in sample size. The variables “out of district email” and the conditional effect “out of district email*black legislator” increase from
 $p <$
0.05 to
 $p <$
0.01 in the replications. There are also changes in the control variables. In Equation 5, the control variable for black legislator is no longer statistically significant, but it increases in its statistical significance for Equations 3 and 4. Also in Equation 5, the magnitude and statistical significance of the South control variable increases. Finally, for all three equations, the coefficient on the Squire Index variable increases from
 $p <$
0.05 to
 $p <$
0.01. Overall, after substituting a more precise measure of district geography for “Urban Percent,” we can be more confident, now at
 $p <$
0.01, that black legislators are intrinsically motivated to advance black peoples interests, given the increase in significance from Broockman’s original results.
5 Empirical Consequences of Measurement Decisions
In this section, we use descriptive data to show how choices of unit and rural concept may be consequential for measurement precision and group-level estimates.
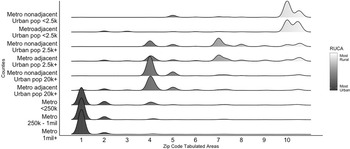
Many studies in American politics rely on the CCES; thus, we demonstrate our next point using the geographic locations of CCES respondents, 2006–2018. This group is a commonly studied sample of respondents, so it is particularly useful to know more about their geographic distribution. Figure 1 depicts the ZCTA-level urban–rural heterogeneity within counties, even when they are sorted into RUCC codes. Each row is a different RUCC category. The density curve shows the distribution of rurality within each category of county, measured at the ZCTA level. The geographic heterogeneity is not too surprising, given that most counties contain urban, suburban, and rural populations. In fact, less than 2% of the population lives in a completely rural county, and less than 4% lives in a completely urban county. In general, ZIP codes are much less heterogenous due to their small size. Slightly over 20% of ZIP codes in the United States are rural, and slightly less than 40% of ZIP codes are core metropolitan areas. The other 40% of ZIP codes are in some classification between mostly urban and mostly rural. ZCTAs offer significant improvement on measurement precision and should be used in place of county whenever possible.
Geographic heterogeneity of CCES respondents within counties.
Notes: Counties are coded by RUCC. ZCTAs are coded by RUCA.

Second, classification decisions can affect descriptive statistics or group means. For example, studies concerning socioeconomic status should be especially mindful of differences in demographic variables based on measurement decisions. Using county as the unit of analysis and RUCC as the coding schema, the median rural household income is $4,168 less than the median nonrural household. Measured using RUCA at the ZCTA level, the median rural household income is $6,938 less than the median nonrural household.Footnote 21 The rural gap in median household income increases by over two-thirds when the measurement strategy is refined.
Finally, the measurement schema can distort the geographic divide in public opinion. Scala and Johnson (Reference Scala and Johnson2017) examine public opinion across geographies in the United States. Crucially, the authors further divided the counties beyond the metropolitan/nonmetropolitan binary. The metropolitan category contains four types of counties: large core, large suburbs, small core, and small suburbs. The nonmetropolitan category contains four types of counties: adjacent micro, adjacent other, nonadjacent micro, and nonadjacent other. If you collapse the data in their Table 1 (our Figure A3), you will find that 50% of individuals in metropolitan counties identify as Democrats, compared to 28% of individuals in nonmetropolitan counties. This cut of the data obscures that small metropolitan suburbs have the lowest levels of Democratic identification of all counties, both metropolitan and nonmetropolitan. Scala and Johnson’s (Reference Scala and Johnson2017) division of public opinion across eight types of counties demonstrates how careful selection of measurement schema generates more precise conclusions.
Thus far, we have addressed how to choose units of analysis and classification schema and demonstrated some of their empirical consequences. Next, we illustrate these concepts by replicating and extending recent political science findings.Footnote 22
6 Replication of Flavin and Franko (Reference Flavin and Franko2020)
In the 2020 Political Behavior article “Economic Segregation and Unequal Policy Responsiveness,” Flavin and Franko examine the links between economic context and policy responsiveness in the U.S. House of Representatives. They find that regardless of an individual’s level of income, those who live in affluent areas are better represented by their member of Congress. They also find that living in rural parts of the country leads to significantly better representation. They measure representation by matching CCES survey items asking individual citizens their preference on legislation to the roll call votes by their representatives on those exact pieces of legislation. We selected this research to replicate, because it is a recent, top-rated article that features an easy-to-interpret urban–rural variable in their main analysis.
One of the covariates in their analysis is the rural/urban status of each ZIP code. Flavin and Franko employ rurality as a proximate sociopolitical context that may affect political behavior, similar to its function in other political behavior studies such as Nall (Reference Nall2015). In their article, they define rural ZCTAs as those that are not located within an urban area or UC.Footnote 23 The Census defines urban areas and clusters as ‘UAs of 50,000 or more people and UCs of at least 2,500 and less than 50,000 people.” Problematically, this definition conflates rural with nonurban.Footnote 24
Wilson’s Mills, NC, provides an example of the potential problems of this coding scheme. Wilson’s Mills has a population of 2,400 and is classified as rural under this coding schema. However, Wilson Mill’s is only 30 miles from Raleigh and the greater Research Triangle region. The majority of that 30-mile drive is not through sparse farmland but sprawling suburbs. The RUCA code for Wilson’s Mills is 4.2, a micropolitan area core with primary flow within a large UC of 10,000–49,999 (large UC). We should not consider Wilson’s Mills rural considering that it is a half-hour’s drive from Raleigh, which is the state’s second largest city of nearly half a million residents, with significant job opportunities, healthcare providers, and educational opportunities.
We replicate their analysis by replacing their measurement schema with ZCTA-level RUCA codes from the University of Washington. For the binary iteration of our variable, we classify all ZCTAs with a RUCA value of 7 or greater as rural.Footnote 25 The categorical version of our new variable leaves the value of the rural variable as the RUCA code so that each observation takes an integer from 1 to 10. Tables A5 and A6 show our results alongside the original results published in Flavin and Franko (Reference Flavin and Franko2020).
The results of interest are visualized in Figure 2, which depicts the coefficient values of the dependent variable and rural variable across three different models. Each model uses a different measurement of rurality, as detailed in the previous paragraph. The original rural variable, labeled Original Binary Rural, is significant and positively related to opinion-vote congruence. The authors interpret this as, “living in rural parts of the country and residing in areas with higher levels of income inequality both lead to better representation in our model” (Flavin and Franko Reference Flavin and Franko2020, p. 856). When we recode the variable to only capture rural locations as defined by RUCA greater than or equal to 7, labeled New Binary Rural, the variable is no longer statistically significantly different from zero, but we cannot be certain that it is “different” from the original coding, because the confidence intervals of the two coefficients overlap. The second recoding, Categorical Rural, is more consequential than the first. Categorical Rural is not statistically significantly different from zero but is different from the original coding (the confidence intervals do not overlap). Moreover, the reduction of the standard error on Categorical Rural relative to the other two rural variables demonstrates that is a more precise measure of rurality, resulting in less variation in the coefficient estimate. In general, researchers should opt for measurements that more precisely capture the conceptual definitions of their variables.
Coefficient plot of Flavin and Franko (Reference Flavin and Franko2020) replication.

Their study includes two subsidiary dependent variable tests including “contact by a campaign” and “made political donations.” Our replications for these variables are in Table A6. In their original analyses, Flavin and Franko do not find statistically significant effects of rural residence on either of these variables. However, upon substituting our measurement strategy for theirs, rurality becomes statistically related to making political donations. When interpreting empirical analyses and drawing conclusions about rural populations, it is important to consider that models using a less precise measure of rurality could be statistically insignificant, while an alternative measure is statistically related to the dependent variable in question.
More importantly, perhaps, the recoding of the rural variable changes the main results. Flavin and Franko argue that rich, segregated areas are “better” represented by members of Congress. With our two alternative codings of rurality, however, the statistical association between rich areas and representation quality becomes weaker and insignificant in common metrics. We cannot say that the new Rich Insulation Index coefficients are statistically different from the original Rich Insulation Index, because the 95% confidence intervals of the three coefficients overlap. However, an important difference in the two new models measuring rural differently is that zero is now inside the 95% confidence interval for the Rich Insulation Index—calling into question whether or not there is a nonzero effect of Rich Insulation on substantive representation.
Yet there is no definitive way to account for geographic location in our studies, and therefore, our alternative results are not more objectively “correct” than Flavin and Franko’s. Without changing the measurement strategy—and consequently, the significance of the primary results—their results might be more accurately presented by changing the framing of the analysis. If the concept and/or measurement is about urbanism, then the variable should be labeled nonurban rather than rural. However, this erases important political differences between suburbs, exurbs, and rural areas. A potential explanation that merits further exploration is whether suburbs are better represented than other nonurban areas, and well-represented suburban districts are driving the results in the original study. Because rurality is not central to their analysis, aside from it being an appropriate control variable, changing “rural” to “nonurban” (or conversely “urban”) would not change the article’s motivation, empirical strategy, or conclusions.
Scholars who do not focus on rural issues may wonder if our discussion so far in this paper has direct bearing on their research. Most American politics research evaluates rurality as a control variable, not the variable of interest. These results highlight that how we measure rural, even as “just” a control variable, is consequential to our empirical results and interpretation of scientific findings. Again, we emphasize that even a rural control variable can impact the main empirical results. Many scholars in American politics use such variables regularly and should be aware of the potential consequences for their results.
We also replicated Broockman (Reference Broockman2013) above, as well as Hersh and Nall (Reference Hersh and Nall2016) and Urban and Niebler (Reference Urban and Niebler2014), both shown in our Appendix. The “Selection Process for Replication” document in our Supplementary Materials provides a more detailed description of our selection process. The Broockman Replication shows that more refined rural measurement can potentially enhance the fit of scholars’ models. The Hersh and Nall replication found very similar results across rural indicators in a very rigorous set of specifications. The Urban and Niebler results show broadly consistent results with the original, but the underlying estimates for their propensity scores change when substituting RUCC scores for their density measure. Moreover, the coefficient estimates for their main effects are smaller and the standard errors somewhat larger, when substituting RUCC for a county population density measure. Overall, we find that rural measurement impacts model estimates, as demonstrated across a range of replication studies.
7 Rural Location Versus Rural Identity
Some researchers may be interested in rural identity, distinct from rural location. Researchers should not assume that people who live in rural areas self-identify as rural or that people living in nonrural areas do not identify as rural. This is an unfounded assumption that could undermine both conceptual understanding and empirical findings. Mummolo and Nall’s (Reference Mummolo and Nall2017) survey design provides us leverage to answer the question of whether or not self-identification is interchangeable with geographic location. Using their data, we show that studies of rural consciousness may be sensitive to the measurement choice of geographic identification versus self-identification. Thus, we suggest scholars concerned with rural identity collect self-identification data.Footnote 26
Participants in the Mummolo and Nall (Reference Mummolo and Nall2017) study were asked, “Which best describes the neighborhood where you now live?” and could choose from the following options: City (downtown with a mix of apartments, offices, and shops), City (in a more residential neighborhood), Suburb (in a neighborhood with a mix of apartments, offices, and shops), Suburb (in a neighborhood with houses only), Small town, Rural area (on a farm), or Rural area (not on a farm).
For our analysis, we collapsed the pairs of City, Suburb, and Rural categories. To compare the self-identification with actual geographic location, we coded each respondent as City, Suburban, Small Town, or Rural using the provided ZIP codes. We assigned the RUCA codes to the Mummolo and Nall (Reference Mummolo and Nall2017) categories using the following schema: “City” includes RUCA 1–3, Suburban includes RUCA 4–6, Small Town includes RUCA 7–9, and Rural includes RUCA 10 (RUCA code descriptions are listed in Table 1).Footnote 27 These data come from the ZCTA version of the RUCA codes provided by the University of Washington Rural Health Research Center.
The left graph in Figure 3 shows the breakdown of geographic location for all respondents who consider themselves to be rural. Strikingly, a minority of respondents who described their neighborhood as rural actually live in an area considered rural by RUCA, either 15% or 28% depending on whether small towns are considered rural. A more forgiving interpretation of the data which classifies the rural, small town, and suburb categories as rural increases the proportion of self-identified rural respondents who live in a noncity area to 52%—barely better than a coin flip. The right graph in Figure 3 shows how respondents from rural areas self-identify. The majority of rural respondents say that they are indeed rural. The second most popular answer is small town, with hardly any rural respondents saying they live in a suburb or city. Considered together, these figures inform us that rural people accurately self-identify as rural most of the time, but respondents from small towns, suburbs, and even cities commonly describe themselves as rural.Footnote 28
Geographic analysis of respondents from Mummolo and Nall (Reference Mummolo and Nall2017).

To be sure, we may not expect there to be perfect alignment between self-identification and RUCA identification. First, RUCA and similar measures are objective, uniformly applied standards to all data points, transparent, and replicable. Self-identified respondents likely apply different standards, compare themselves to different reference points, and may be influenced by group identities or rural stereotypes propagated by media. Second, although ZCTAs are far more precise than counties, there could still be zoning issues that account for the geographic mismatch (e.g., a rural respondent lives on the edge of a small town ZCTA). Given that the conclusions hold when rural and small town are combined, this is less of a concern than the first point.
The first implication is that rural identity is not the same as rural residence (Bell Reference Bell1992). As we stated earlier, concepts such as “rural consciousness” (Cramer Reference Cramer2016) do not necessarily require rural residence (Wong et al. Reference Wong, Bowers, Williams and Simmons2012). Mummolo and Nall measure rural identification in a very direct way by asking people if they live in an urban, suburban, small town, or rural area. This is not quite the same as rural consciousness. Cramer (Reference Cramer2016) defines rural consciousness as an ethos containing three core beliefs: decision-makers (policymakers) ignore rural places, rural places do not get a fair share of resources, and rural folks are fundamentally different than urban folks (lifestyle, values, and work ethic). It is possible for someone to hold the three core beliefs of Cramer’s rural consciousness without residing in a rural area, or for someone who lives in a rural area to not hold any of these three beliefs. Although recent political science research cites Cramer’s concept of rural consciousness (e.g., Lacombe Reference Lacombe2019; Jacobs and Munis Reference Jacobs and Munis2018), rural consciousness has yet to be measured at the aggregate level.Footnote 29
The second implication of this analysis is that self-identified rural people live in locations at every point on the urban–rural spectrum. These results also suggest potential challenges for classification of urban locations and urban-identifying individuals. A significant population of individuals living in dense urban locations identify as rural, indicating that they may hold preferences or identities typically associated with those in more rural locations. Political science has not yet come to grips with the difference between geographic self-identification and geographic location. This disconnect merits additional research.
8 Advice for Choosing Measurement Schema
Having laid out the menu of options and demonstrated their use through replications, in this section, we offer suggestions for how scholars might think about choosing a rural classification schema—both the concept and the unit—for their research. The first principle of classification is theoretical—scholars should have a notion of what is important about rural location or rural identity from the perspective of their research to guide their selection of concept. Table A4 provides examples of classification schemes for common concepts of rurality in political science. As noted by Scala and Johnson (Reference Scala and Johnson2017),“any rural–urban classification system is a compromise between detail and summary,” and we advise authors to carefully weigh these trade-offs. Other notions of rural may relate to agricultural production, in which case USDA typology codes are sensible. If the idea is rural identity, scholars will likely need to ask that in surveys themselves (e.g., Mummolo and Nall Reference Mummolo and Nall2017). We emphasize the need to take the concept of rural seriously, because rural variables have often been included in analyses uncritically.
Once scholars have a classification in mind, they must choose an appropriate unit. Again, this should be a theoretical choice. For scholars examining county-level phenomena, the county is the correct unit, and the county-level classifiers should be employed. For many facets of political behavior, however, we do not know the theoretical unit. To capture those living in a rural “community” or “neighborhood,” there is no theoretical unit that can be captured in aggregated data (Kwan Reference Kwan2012). People identify their community or neighborhood differently (Wong et al. Reference Wong, Bowers, Williams and Simmons2012), further complicating researchers’ use of respondents’ self-identification to measure geographic location. The definition of a community or neighborhood is individual even if the concept is aggregated.Footnote 30
When scholars do not know the theoretical unit, a few choices are available to alleviate concerns with operationalization and minimize the MAUP. If scholars have individual-level location data, it may be possible to use ArcGIS to map different “zones” and scales to capture the rural location concept to include in their analysis. By showing the (lack of) sensitivity of their analysis to the choice of rural concept, readers can be more assured of the validity of the results. For certain research questions, the collection of individual data on the rural concept to aggregate to different levels may be the most appropriate path.
Many scholars will not have individual point data because of limitations of survey or government data. Table A2 lists the aggregation levels found in surveys common to the study of American politics. In many cases, scholars may want to select a relatively small unit, such as a ZCTA, to pair with individual level data. As described above, the ZCTA is a much more precise accounting of rural geography than county. The concept of rural is much more homogeneous within ZCTAs, so there should be a better mapping of concept to measure at the individual level. Classifying survey respondents at lower levels of classification may substantially reduce sample sizes, however. Furthermore, “going smaller” will not eliminate concerns with the MAUP. The best option to reduce concerns with the MAUP is to show robust results at different “zones” and scales.
Even if a scholar knows the theoretical unit, there may not be data at that unit. For example, if scholars wondered how unemployment rates in manufacturing affects voting in rural towns or in elections in the House of Representatives, they would find that industry-specific unemployment data in the Quarterly Census of Employment and Wages are only produced at the county level. The use of county-level data to address questions at the town or House district level would, in most cases, be problematic. For these questions, the data cannot approximate the unit, so scholars would need to revise the research question or collect original data to achieve a viable research approach. Using data at inappropriate units, even as a control variable, has the potential to alter empirical results in unpredictable ways (Soifer and Alvarez Reference Soifer and Alvarez2017; Lee and Rogers Reference Lee and Rogers2019; Lee et al. Reference Lee, Rogers and Soifer2019).
9 Conclusion
In this article, we have detailed the challenges to studying rural America and offered potential solutions. We point to two important choices—the geographic unit and the classification—that should guide the researcher’s choice of measurement. We distilled technical information for political scientists to provide descriptions of the unit and classification options and linked them to available tools and data. We provide an original dataset of urban–rural classifiers at the U.S. state legislative district level. We demonstrated the consequentiality of measurement choices in a replication study. Critically, we also showed empirically that rural self-identification is not the same as objectively defined rural location. This result has bearing on important questions of political behavior linked to the urban–rural divide. We hope that our efforts will prove useful to a range of scholars in American politics and public policy, and with adaptation, to scholars in comparative politics.
The study of political geography, including rurality, requires scholars to use observational, aggregated data. These data may not be provided in the format preferred by the researcher, forcing researchers to consider suboptimal data and operationalizations. We have emphasized that these decisions can matter. Given the potential impact of these choices, we implore scholars to think carefully about what they mean by rural, to state their notion explicitly and to try to match their concept to measurement. Failure to specify appropriate geographic conceptualization, or to substitute geographic concepts for identity concepts, may result in a disconnect between readers and writers and between concept and measurement. Much like the ubiquitous “South” control variable in state politics, many political scientists have relegated rurality to a dummy variable control or a catch-all term for people who do not live in urban areas. We hope to push scholars to place more effort in their research on the conceptualization and measurement of rurality.
Acknowledgments
We thank Editor Jeff Gill, four anonymous reviewers, Seth Hill, David Broockman, Kim Dionne, Pat Flavin, Thad Kousser, Jonathan Mummolo, Clayton Nall, and the participants of the 2019 Political Methodology Conference and 2019 Southern California Political Methodology Conference for their helpful comments on this project.
Data Availability Statement
Replication code for this article has been published in Code Ocean, a computational reproducibility platform that enables users to run the code and can be viewed interactively at Nemerever and Rogers (Reference Nemerever and Rogers2020a). A preservation copy of the same code and data can also be accessed via Dataverse at Nemerever and Rogers (Reference Nemerever and Rogers2020b).
Supplementary Material
For supplementary material accompanying this paper, please visit https://dx.doi.org/10.1017/pan.2020.47.