


1. Introduction
The formation of glacier ice in the melt-free zone of polar ice sheets results from a complex process of densification of dry snow deposited on the surface and can be presented as a sequence of five stages. For example, at Vostok Siaiion this process has been described by Salamalin and others (1985) and Lipcnkov (1989). In the initial stage, the densification of snow is mainly a structural re-arrangemem and sintering process due to ice-grain surface forces, the thermal gradient and ice load. Snow has a minimal volume concentration of closed (isolated) pores and is present down to a density of about 0.55.Mg m−3. The second stage is firn. It is characterized by Viscoplastic deformation of ice grains under increasing overburden pressure. When all pores become closed, usually at 50-120 m below the surface, the atmospheric air is trapped in the form of bubbles, and thus the third Stags, defined as bubbly ice. comes into being. Further densification of sinking bubbly-ice sediments is essentially a relaxation process corresponding lo air-bubble constriction in a plastically deforming polycrystalline ice matrix driven by the pressure drop between the two phases. At a depth of 500-1000 m (depending on temperature) the bubble pressure becomes sufficient for the formation of the mixed air clathrate hydrates (Reference Miller,Miller. 1969). Below this depth, the two-phase bubbly ice changes into a three-phase aggregate, which is the main attribute of the fourth Stage, where air bubbles and air-hydrate crystals coexist in the ice matrix. The gas phase progressively disappears with depth in the transition zone that may be half to twice as thick as the bubbly-ice stratum. Below the lower boundary of the transition zone. the two-phase aggregate (distinguished as the fifth stage) consisting of Ice and hydrates is present down to the bottom of the ice sheet. The three phase transformations of glacier ice after pore close-off involve different mechanisms and rates of densification. so they must be distinguished (Reference Lipenkov.Lipenkov, 1989). The densification process within the bubbly-ice stratum considered below is of special interest because it is suitable for studying the rheological properties of ice at relatively low stresses. Also, the density distribution within this stratum is presumed to record past variations of initial ice porosity and bubble pressure at pore close-off. Modelling the bubbly-ice densification is still considered to be a necessary step in the theoretical study of air-hydrate formation in ice sheets.
The first quantitative descriptions of the densification of bubbly glacier ice under overburden pressure were given by Reference Langway,Langway (1958), Reference Bader,Bader (1965), Gow (1968), Reference Shumskiy,Shumskiy (1969) and Reference Nakawo, and Narita,Nakawo and Narita (1985) on the basis of phenomenological approaches or simply as appropriate approximations of experimental data. Salamalin and others (1985) employed a more rigorous averaging procedure (Reference Bensoussan,, Lions, and Papanicolaou,Bensoussan and others, 1978) to develop in general the same densification model as the one constructed within the framework of the cell-structure approximation by Reference Wilkinson. and Ashby,Wilkinson and Ashby (1975) for simulating ceramics production processes. This model was applied to deduce the parameters of the power creep law of pure ice from porosity profiles measured along five deep ice cores retrieved in Antarctica and Greenland. Later, the inferred rheological parameters of ice were used by Reference Lipenkov,, Salamatin, and Grigor’yeva.Lipenkov and others (1989b) for simulating climatically induced signals in porosity (density ) profiles in ice sheets. Using the same theoretical approach, Reference Lipenkov. and Salamatin,Lipenkov and Salamatin (1989) also studied the volume relaxation of the ice cores recovered at Vostok Station. Results of the investigations carried out in this field in 1982-89 have been reviewed by Reference Salamatin, and Lipenkov.Salamatin and Lipenkov (1993).
The mathematical models mentioned above essentially use (a) a power creep law for ice and consider (b) bubbly-ice densification as a process of hydrostatic compression at (c) the averaged pressure in the ice matrix equal to the absolute load pressure. All of these assumptions are somewhat limiting. First. Reference Pimienta,Pimienta (1987) and Reference Pimienta, and Duval,Pimienta and Duval (1989) have shown that asymptotically, as the bubble-ice pressure drop decreases, the rheological behavior of ice becomes linear viscous. Although this is not revealed in ice-porosity prediction, it changes the estimate of air-bubble pressure at large depths. Secondly, due to the lateral constraints, the deformation of the ice matrix in the bubbly-ice densification process is a composition of hydrostatic and deviatoric uniaxial (vertical) compression of comparable strain rates. Thirdly, the deformation of bubbly ice on the micro-scale of a single bubble is also subjected to “additional” deviatoric strains induced by the global macro-scale movement of the ice sheet. To account for these peculiarities, special research has been carried out to derive general rheological relations governing the creep flow of bubbly ice and its expansion (compression) in pressure relaxation processes (Reference Salamatin, and Duval,Salamatin and Duval, 1997).The kinematic interaction of ice-sheet How with compressibility effects has also been considered (Reference Salamatin,Salamatin. 1991). In addition, a comprehensive experimental study of bubbly-ice densification has recently been undertaken on the vostok ice core. The new-data set obtained includes for the first time direct measurements of bubble pressure in unrelaxed ice and enables theoretical models to be more precisely validated by experimental data. Thus, we need: (1) to develop a new model in order to overcome the above-mentioned drawbacks by introducing all the recent theoretical results and (2) to revise the model application, taking into account the new experimental data. In accordance with this two-fold purpose, our work will he presented in two parts: I. Theory and II. Applications. In this first paper, we develop an improved Mathematical model sufficient for predicting bubbly-ice densification between the close-off level and the air-hydrate formation zone; we also conduct a preliminary investigations and sensitivity study of the model. In the companion paper (Reference Lipenkov,, Salamatin, and Duval,Lipenkov and others. 1997) (hereafter referred to as paper II ) we use the model to Interpret the ice-core data.
2. General Equations Governing Densification of Bubbly Ice
Since bubbly ice is a two-phase heterogeneous medium from a mechanical point of view, we should distinguish two space scales when modeling the densification processes: (i) a micro-scale associated with a characteristic size of pores and (or) a characteristic distance between neighboring air inclusions, and (ii) a macro-scale corresponding to the typical dimensions of the domain where bubbly-ice densification takes place. Here, we use a “macro-continual” approach to describe the behavior of the air-ice mixture in terms of the macro-scale, averaged characteristics introduced conventionally in the mechanics of multi-phase media:
-
C ice porosity (air-volume concentration);
-
ρ, density of bubbly ice, ρ = ρi(l−c), where p\ is the density of pure ice (p\ is assumed to be constant I;
-
v. averaged velocity vector:
-
Pi, Pb, averaged pressure in the ice matrix and the mean pressure in bubbles, respectively;
-
T, deviator of macro-stresses in the ice matrix.
The mass and momentum balance equations governing the slow creep motion of glacier ice can be Written in the form:

where g is the gravity vector. t is the time and ∇ is the differential nabla operator.
Equation (2.1) are general. Rigorous definitions of the above characteristics and corresponding constitutive relations completing the system in Equation (2.1) may differ from one stage of densification to another. However, in any case they must be based on and deduced from the analysis of deformation processes on the micro-scale level. Such an analysis has been undertaken for bubbly media by Reference Salamatin, and Duval,Salamatin and Duval (1997) within the framework of homogenization methods for periodic structures (Reference Bensoussan,, Lions, and Papanicolaou,Bensoussan and others, 1978), The results are used below.
First of all, a simple mass-balance (state) equation holds for a specific volume of ideal gas c/(1−c) in a unit mass of ice provided neither phase change nor gas diffusion in the ice matrix takes place:

where T is lhe temperature (K) treated hereafter as a known value. Equation (2.2) means that the quantity in the square brackets is constant along bubbly-ice particle trajectories.
The near-sin face bubbly stratum of the ice sheet is composed of polycrystalline isotropic ice (see e.g. Reference Lipenkov,, Barkov,, Duval, and Pimienta,Lipenkov and others, 1989a). Therefore, one can write, as in Reference Glen,Glen (1955), Reference Budd,Budd (1969) and Reference Shumskiy,Shumskiy (1969). the following relation between deviatoric micro-stresses T and micro-strain rates ė in the ice matrix:

Rheological coefficient η is a function of the second invariant of the strain-rate tensor IIe, = 0.5ė : ė and temperature T.
In addition, the macroscopic bubble-compression rate ω can be defined as:

Finally, as proposed by Reference Salamatin, and Duval,Salamatin and Duval (1997) for ice with mono-dispersed spherical bubbles, we have the following rheological relations which determine the phase pressure drop and the deviatoric stresses in bubbly fee in a deformational process:

and

Here Ė is the deviator of the macro-strain-rate tensor:

where δ is is the identity tensor and superscript “s” denotes symmetrization; IIE: = 0.5Ė : Ė /k. is the tuning parameter, which varies within the range 0.4 ≤k≤1 for different approximations of micro-deformation in the bubble vicinity.
Equation (2.1), (2.2) and (2.4)−(2.7) form a complete model of bubbly-ice creep flow including bubble-pressure (density) relaxation effects. The deviatoric deformations of ice (IIE) and the bubble compression (ω) are closely interrelated, since both processes arc represented equally and symmetrically in the macro-scale rheological Equation (2.5) and (2.6).
Originally, the latter relations were derived for a periodic composition of ice with spherical bubbles. In reality, the shape of air inclusions can be rather irregular, especially in young ice. immediately alter pore close-off. Yet. we believe Equation (2.5) and (2.6) remain approximately valid in this case because the air-volume concentration in ice is relatively low (c < 0.1) and the deformation of ice-matrix cells each containing a small single bubble does not depend at first order on the bubble shape.
3. Analysis of Deformation Processes in the Upper Stratum of the Ice Sheet
The compressible air bubble-ice medium forms a relatively thin layer in the upper part of ice-sheet thickness. This specific stratum does not noticeably influence the overall movement of the glacier but is involved in complicated deformation processes which are responsible In the distribution of the vertical velocity near the ice-sheet surface (see-Fig. 1a). Here, we consider the kinematic interrelation between the global ice-sheet flow and the densification. as initially looked at by Reference Salamatin,Salamatin (1991).
Interrelation of Ice-Sheet Flow and Compressibility Effects
Let s be the distance from the ice divide along a certain flow tube confined between two close flowlines with a relative width H(s), as shown in Fig. 1a. The vertical coordinate is noted as z (the z axis is directed upward); u. W are the corresponding longitudinal and vertical velocities: l, z0 are respectively the ice-sheet surface and bed elevation; b is the ice accumulation rate, and u0, w0 are respectively, the sliding velocity and melting rate of ice at the glacier bottom.
It is also helpful to introduce the elevation of glacier surface (l′) and the modified coordinate (z′) measured in equivalent of pure ice:

The total volume rate of ice in the tube through its cross-section of unit width is

the corresponding flow rate due to sliding is (l′−Z0 )/u0, and the relative fraction of the flow rate caused by plastic shear deformations within the glacier body is then defined as

The latter ratio varies from 0 (no shear within the glacier) to slip in the basal layer). In some cases and. in particular, in the ice-sheet densification modeling this variable is likely to be considered as an adjustable (tuning) parameter.
Closer examination of the general Equation (2.1) for ice-creep motion along a flow tube under conventional boundary-layer (shallow-ice) approximation assumptions follows the profiles for the vertical and longitudinal velocities to be written explicitly with the snow-firn-bubbly-ice compressibility taken into account (Reference Salamatin,Salamatin, 1991):

Here. h = l − z is the depth and

The first formula in Equation (3.3) directly represents the Longitudinal velocity, u as the mean slab-flow velocity and superposed shear component for σ>0 U. The structure of the second formula for vertical velocity w although more complicated, is also clear. First terms respectively show contributions of (1) snow accumulation rate. (2) vertical motion of the ice-sheet surface, (3) densification rate of porous ice deposits, and (4) vertical deformation of the ice-sheet thickness in the slab-like flow at the surface horizontal velocity. The last two terms (being proportional σ) describe the direct impact of the shear strains in the glacier body and the influence of the ice thickness and the bed-relief lateral variations on the vertical velocity profile
According to Reference Lliboutry,Lliboutry (1981), the integrals G and F can be approximately evaluated:

where α0 is the apparent exponent in Glien’s power law modified in accordance with the non-isothermal conditions in the basal layer. Straightforward estimations by Lliboutry showed that α0 > 5-10. Hence, at least in the upper half of the glacier thickness, the terms
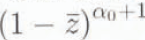

where Δ=l′ − z0 is the thickness of the ice sheet in ice equivalent and v is the downward vertical velocity of the ice sinking into depth relative to die glacier surface
In central regions of ice sheets, where A and u are relatively small, for example in Antarctica at Vostok Station, the accuracy of Equation (3.5) for v is not worse than 10−3 to 10−4 down to a depth of

Macro-Strain Rates in Bubbly Ice
It is now possible to estimate the deviatoric macro-strain rates in the bubbly-ice stratum and to express the tensor Ė via parameters describing the global flow of the tee sheet and the bubble-compression rate ω. Originally, the coordinate system h, S is curvilinear and not orthogonal. Nevertheless, in each point of the glacier body, we can introduce the local orthogonal (downward and horizontal) directions h, s see (Fig. 1a) and the transverse one. Let us now designate the normal (diagonal) components of the deviator Ė along these directions as q1, q2 and q3. respectively. By definition, from Equation (2.4), (2.7) and (3.5), taking into account that u does not depend on h in the upper part of the ice sheet, we have

Then, direct substitution of Equation (3.2) and (3.5) yilds

where

Here, qi′, i = 1,2,3, represent die normal deviatoric strain rates of the “exlernal” motion of the ice sheet (seeFig. 1a and b). Equation (3.6) show that on the maero-srale level the compressive deformation in bubbly ice of a glacier occurs, as illustrated by Fig. 1b and c. only in the vertical direction.
Different scales of ice deformation to be considered when modeling bubbly-ice densification in ice sheets (see the text for the meaning of the denotations). (a) Fragment of ice flow tube representing the “external” motion of the ire sheet. (b) Bubbly-ice aggrement or particle (macro-scale), (c) Unit cell containing a single bubble (micro-scale).

It should also be noted that the introduced h, s directions are the principal directions of the deformation in the upper part of the ice-flow tube, where the shear stresses and temperatures are comparatively low. to provide noticeable shear strain rates. Then, q1′,q2′ and q3′ are only non-zero components of the tensor Ė induced by the glacier motion and the corresponding effective strain rate ∊a can be determined as:

Further relevant to define the rate of horizontal ice-layer thinning as ∊1 = −q1′ and. using Equation (3.6) to write the second invariant IIE in Equation (2.5) and (2.6) in the form:

As a rule, in the central part of the ice sheet, not far from ice divides, the deformation is close to a simple two-dimensional extension and σ/(α₀+1)≪1, Thus we have

4. Mathematical Model of Bubbly-ice densification
Ice Porosity and the Rate of Bubble Compression
Hereafter we will use subscript “c” to denote the initial conditions (Tc,. Pbe,cc, …) at the upper boundary of bubbly ice, i.e. at the close-off depth hc , which corresponds to the end of tin pore-closure process in the ice sheet. These boundary parameters determine The constant quantity (the mass of air trapped in an ice particle) given by Equation (2.2), from which we obtain

where

whilst Ts and Ps, are the standard temperature and pressure (STP: TS = 273.1 K. Ps = 0.1013 MPa). Pbc is defined here as a bubble pressure prevailing at the end of pore closure and V is the air content expressed as a volume (STP) of dry air enclosed in a unit of mass of the ice sample The dimension-less complex γs(that must be distinguished from γs which is dimensional) is preserved in the “memory” Of any bubbly-ice particle in terms of porosity and, thus, has an important role a paleoclimatic indicator. Ii may be also directly obtained through air-content measurements.
Mass-balance Equation (2.1) together with Equation (2.4) lead to

which can be transformed into another equivalent form:

Substitution of Equation (4.1) finally gives:

Absolute Load Pressure and the Pressure in the Ice Matrix
Next, we introduce the load pressure

where Patm, is the atmospheric pressure in the ice equivalent: h′ =l′−Z′.
The averaged pressure in the ice matrix Pi (see Equation (2.1) and the load pressure p1 are not equal.This becomes evident if we write the projection of the momentum-balance Equation (2.1) on the h axis:

where T1 is the first component in the diagonal of the stress tensor T for the h direction (additional terms with shear stresses are omitted since they are negligible in the framework of the shallow-ice approximation). The integration of the latter equation taking into account Equation (4.4) yields the following relationship between the two pressures:

Hence, pi and P1 may be equal (which was assumed in previous models) only if T1 is negligible. This is not true in general (see the discussion and sensitivity tests below).
Formulation of the Model
Thus, Summarizing Equation (2.5)− (2.7), (3.6), (3.7) and Equation (4.1) (4.3) − (4.5), one obtains the model of bubbly-ice densification:

The interrelation of the deformation processes occurring in the glacier at different scale levels (schematically depicted in Fig. 1) is a highlight of the model. universal bubble-constriction rate ω due to the lateral constraints (seeFig. 1b) influences deviatoric strain rales q1, q2 and q3 in an ice fell surrounding a bubble (sec Equation (3.6) andFig. 1c). As a result, it is equally represented in the second invariant IIE of the macro-strain-rate tensor Ė in Equation (2.5) and (2.6) together with the global strain rates q1, q2 , q3 (i.e.∊1 and ∊a) of the glacier motion. Consequently, both appear (as IIE) in the main Equation (4.6) relating Pb, and yω
For given parameters ∊1 and ∊a and close-off conditions hc, pbc, γs as functions dependent on time tc, and the longitudinal coordinate s, the problem in Equation (4.6) is an integro-diflerential equation with respect to the bubble pressure Pb, prevailing in the particle of bubbly ice which was formed at close-olf depth at the moment t = tc . The trajectory of the particle: s = s(t). Ii = h(t), t >tc. is calculated on the basis of Equation (3.5):

The determine the ice temperature T. the energy equation has to be solved simultaneously with Etpiations (4.6) and (4.7).
5. Model Investigation
Ice-Flow Law
For practical use of the general model in Equal ions (4.6) and (4.7), we have lo assume a concrete form of the constitutive law in Equation (2.3). Let us accept the polynomial relationship between effective shear strain rate
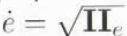
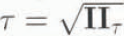

Here, α is a creep exponent and M1 and M2 are the rheo-logieal Coefficients, which are functions of temperature:

where μ1 and ?> are the constant factors. Q1 and Q2 are the apparent activation energies and Rs is the gas constant: Rs = 8.314J (mol.K)−1.
The rhcological law given by Equation (5.1) was found to litcloscly a wide variety of experimental data (Reference Budd,Budd, 1969; Reference Shumskiy,Shumskiy. 1969) and the following tentative estimates can be suggested: α ≈ 3.5. Q1 ≈ Q2 ≈ 60kJmol−1, while the factors μ1 and μ2 are of the orders of 1MPa year and 10−2 MPaα year, respectively.
The apparent viscosity η in Equation (2.3) is determined as a function of λ =4IIe, by

which is an immediate consequence of Equation (5.1).
Dimensionless Presentation
At this stage, it is relevant to establish the main dimension-less numbers of the process and to apply similarity theory and scale analysis in order lo examine Equation (4.6) and (4.7).
The difference between absolute load pressure and bubble pressure is maximal al the elosc-oiflevel where it is of the order of PIc, − Patm. The typical value P0 of (Pic − Patm) is then lo be taken as a scale for stresses in the bubbly-ice stratum. Let us also designate as tP the typical value of the accumulation rate b0. Then the space (h0) and lime (t0) scales are written as

The corresponding dimensionless variables are distinguished hereafter with super bars:

Consequently, the model in Equation (4.6) can be transformed into the following dimensionless form:


where η is the solution of the modified Equation (5.3)

At a given temperature T. parameters K1 and K2 are the main similarity criteria of the densification process. Preliminary estimates show that K1 ~ 0.03 − 0.3 and K2 ~ 0.03−0.3 at α= 3.5 for typical ranges of the scales: p0 ~ 0.4−0.7MPa b0. ~ 2.0−50 Mgm−3 a−1 and Tc ~ −50°C to 20°C(see paper H for more detailed data. Another dimensionless parameter γ0. which is a characteristic (equilibrium) value of the air-volume concentration in the ice, has the orderof 10−2.
In case of the estimate in Equation (3.8), ϵ 1 and ϵ a are of the same order as lhe characteristic space scale divided by the glacier thickness and for Δ ~ 100-3000 m they are small values:

Since e is also small: c < 0.1 and ω ∼1. the Iirst term on the righthand side of the integral Ecquation (5.5) is dominant. This suggcsis that P1 may be very close to Pi. whereas the relative external deviatoric macro-strain rates (ϵ 1 ϵ 1 ϵ 1 ϵ 1 and ϵ a) may haveonly a secondary inllncncc on the bubble-compression rate in central parts of ice sheets. However, a certain even small) perturbation of the latter equation leads to the eorrespontling relative change in ω which, in turn, results in a cumulative integrated I influence on the predictions of the decreasing porosity c. The significance of this effect will be demonstrated below in sensitivity tests. It is also obvious that in high-rate-deforming pans of ice sheets, particularly in marginal zones, ϵ 1 and ϵ a are not small and may play a primary role in densification processes.
At the same lime, a small ratio h0 /Δ is evidence that the relaxation Of bubbly ice occurs with in a relatively thin layer and short time interval. With ihis in mind. one could examine bubbly-ice densification as a stationbary process under constant (mean, present-day) conditions b. Patm. hc,Cc P1c, Pbc. and Tc. (if the typical time-scale of their fluciuations is much larger than t0 and without regard to possible geographical variations of the close-off characteristics.
Consequently, Equation (4.2) takes the form:

where v =v/b ⁰ In accordance with the definition in Equation after differentiation of Equation (3.5) for v with respect to h. we come to the dimensionless relation

Combining the two latter equations, we obtain

Hence

and the depth age relationship is given by

Thus, using Equation (5.7) to eleminate the time t from Eqtialion (5.5), we find that, for approximately constant temperature T ≈ T c

This enables direct calculation of the profiles of C and P b, VS depth h from Equation (5.5)−(5.8) for the high-rate quasi-stationary siagc of densification.
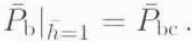
The corresponding boundary condition at pore close-off can be written as
Asymptotic Phase of the Process
Note that the above model and in particular Equation (5.7)− (5.9) remain valid for any ice particle even if the close-off conditions. at which it was formed, and the accumulation rate have changed in the past, i.e. for ice found at great depths: h ≫1 Therefore, the asymptotic behavior ofc and P b, as h →∞ (i.e. as the age of the particle becomes large), is important and gives a key for reconstructing the variations of the close-off characteristics which are associated with climate, provided thai the present-day conditions are comparatively steady.
Indeed, when c→0 for h ≫1 the bubble pressure P b becomes large in comparison with the integral on the right-hand side of Equation (5.5). Hence, we have

and using Equation (5.8), wc estimate ω as

Furthermore, asymptotically, as c→0 and ω decreases, Equation (5.5) and (5.6) yield

The model in Equation (5.10)−(5.11) is local in time. i.e. P b and c for large depth h do not depend on lhe history of the process. It is also important that at this stage of densification, which we hereafter reler to as an asymptotic phase, the bubble pressure docs not depend on the genetic complex ϒ s (or ϒ c), for which possible variations in accordance with Equation (5.11) are, thus, directly recorded in the porosity profile.
The above theoretical investigation provides a clear general picture of bubbly-ice densification and opens the way to numerical simulation of the process.
6. Computational Tests and Discussion
Finite-difference and iterative methods have been used to solve Equation (5.5)−(5.9) numerically. A special interactive computer systemFootnote * has been developed to study the densification process in glacier ice. It directly calculates porosity und bubble-pressure profiles vs depth h for given close-off conditions and pure-ice rheology, and solves the inverse problem of inferring the air content and rheological parameters of pure ice from porosity and/or bubble-pressure measurements. In this section, we discuss the sensitivity of the model results to variations of the different parameters taken in the dimensionless form.
The following values, typical for polar ice in lhe central parts of Aintartica and Greenland, for instance in Antarctica at Vostok Station, and consistent with the above estimates, have been chosen as basic tentative proxy of lhe model parameters:

Preliminary computations were performed to evaluate the influence of the tuning factor k and the “external” Strain rates ϵ a,ϵ 1 on the model predictions. As expected, it was Ioiiud thai variations of both k. within its uncertainty range from 0.4 to 1.0 and ϵ a,ϵ 1 from 0 to 0.04 (a plausible upper bound for the central parts of the ice sheets). do not change the solution notably. The maximum deviation of the porosity c and the bubble pressure P b from the basic profiles was observed to be within ±15-2%. Subsequently, these parameters (K, ϵ a,ϵ 1) were fixed in accordance with Equation (6.1) and remained unchanged for all the following computational runs.
Sensitivity to the Rheological Parameters of Pure Ice
The main series of the tests focused on the model sensitivity to the rheological parameters M1 and M2 (i.e. to variations of the criteria K1 and K2. The two terms of the polynomial law in Equation (5.1) obviously represent linear and power asymplotes for low and high slresses T respectively. Since ihe micro-scale stresses associated with bubbly-ice densification fall mostly in the transition zone between lineal and power rheolgical behaviors, both of lhe criteria are important. The transition zone is centered at


Relation (6.2) is represented in Logarithmic scales in Fig. 2a as curve 1 (the dashed lines show asymptotes). us assume now that curve 1 corresponds to the basic values: K1 = 2.5, K2 = 0.05. Then, if the criteria K1 and K2 are alternately changed the initial curve is modified, for example: at K1 = 1.0 and K2 = 0.05 we obtain curve 2. while at K1 = 2.5 and K2 =0.1 we get curve 3 in Fig. 2a. Thus, Fig. 2a illustrates a selective response of the polynomial rheological curve at low (high) stresses to a change mostly of the Criterion K1(K2). When using the ice-flow law given In curves 1-3 in Fig. 2a to simulate the densification process under fixed close-off conditions ( ϒ c =0.01), we obtain lhe corresponding profiles of bubble pressure P b (curves 1-3 in Fig. 2b) and ice porosity c (curves 1-3 in Fig. 2c) vs depth h .
Influence of pure-ice rheology and boundary conditions at pore close-off on ice-porosity and bubble-pressure profiles in ice sheets as revealed by computational tests. (a) Polynomial rheological law of ice in the normalized form. The curves 1-3 correspond to the various parameters K1 and K2 (indicated on the figure). The dashed lines ate asymptotes of curve I. (b) Relative bubble pressure P b vs normalized depth h The profiles 1-3 are computed with the same pairs of lhe parameters K1 and K2 as in (a), and under fixed close-off conditions ( ϒ c = 0.01). The dotted and dashed lines represent absolute load pressure P 1 and the pressure P i in the ice matrix, respectively. (c) Porosity (c) depth ( h ) profiles 1-3 calculated with the same model parameters as referred to for identically numerated P b- h profiles in (d) Porosity profiles I-III calculated with fixed ice rheology corresponding to the basic curve 1 in (a), and for various ϒ c (as indicated on the figure). The profile III (dotted line) is simulated with the same parameters as the curve II but P i is presumed to be identical to P 1.

The difference between curves 1 and 2 in Fig. 2b illustrates the fact that the bubble-pressure profile is significantly influenced by variations of the rheological parameter My.1 The maximal perturbations are observed, as expected, at large depth, i.e. in the low-stress range. On the other hand, when M2 is changed (compare curves 1 and 3 in Fig. 2b). only the upper part of the bubble-pressure profile is affected significantly in the zone where the effective stresses are relatively high. Thus, the bubble pressure is closely and Selectively linked to the rheological properties of pure ice. On the contrary, no significant change in the simulated porosity profile is observed al great depth, even if the “linear” viscosity M1 is changed, while the upper pari of the profile equally depends on both of the rheological parameters M1 and M2 (see the curves 1-3 in Fig. 2c). Therefore, the impacts of the factors M1 and M2 on density relaxation are practically indistinguishable
Sensitivity to the Pore Close-Off Conditions
According to Equation (4.1), when Pib ≫ μ, the porosity c approximately proportional to the air content V. Therefore, c keeps “memory” about past close-off conditions. Indeed, a high sensitivty of ice ice-porosity profile to realistic variations (see. for instance, paper II) of the genetic complex ϒ c is evident when comparing the profiles I ( ϒ c=0.01) and II ( ϒ c = 0.02) in Fig. 2d (both of the profiles were simulated with the same rheological parameters as those used for curves 1 in Fig. 2b and c) . On the other hand, numerical experiments show that afer pore close-off the bubble pressure P b very quickly becomes insensitive to plausible changes in ϒ c .This is in agreement with approximate Equation (5.10) and (5.11). All of the computational tests have confirmed that the asymptotic phase starts from h ≈3.0.
Significance of the Model Improvements
Summarizing the results presented above, we come to the following conclusions: (i)the stationary model is sufficient for interpreting the experimental data on huhhly-iee dcnsification (ii)both ice-porosity and bubble-pressure experimental profiles are necessary to obtain an adequate solution of the inverse problem of inferring rheological parameters of pure ice; (iii) the porosity profile can also be employed to deduce past variations of the pore close-off conditions expressed in terms of the dimensionless complex γs which is proportional to air content in ice The improvements made in ihe present consideration with respect to the earlier studies by Reference Salamatin, and Lipenkov.Salamatin and Lipenknov(1993), such as incorporating the generalized rheological model of bubbly ice and taking into account the difference between absolute load pressure and averaged pressure in the ice matrix, are important for both inverse and forward problems. The significance of the latter factor for predicting the icc-porosilv profile in the relaxation phase of bubbly-ice densification has already been discussed in section 5 and is demonstrated in Fig. 2d. One can see here that the discrepancy between simulated profiles II and III obtained with the same initial data, except that Pi = P1 for prolile III. may be similar to the impact of the principal model parameters: K1, K2 . and ϒ c The effect of using constitutive relations more sophisticated than the power-creep law is also shown to be substantial for simulating the densification process with respect to bubble-pressure relaxation. However, this innovation does noi significantly influence the results while modeling the post-drilling relaxation of ice density (Reference Lipenkov. and Salamatin,Lipenkov and Salamatin. 1989). since lhe latter process lake place at a relatively high bubble-ice pressure drop i.e. within the stress range where the power-law creep of ice is valid.
7. Conclusion
A generalized model of bubbly-ice densification beneath the close-off depth has been developed and investigated on the basis of similiarity theory and scale analysis. The interaction between the universal compression of bubbles and deviatoric strains in a non-linear viscous ice matrix is the principal peeuliarity of the deformation process in the upper stratum of ice sheets. Due to this. the rate of bubbly-ice densification may be considerably influenced by the global flow of the glacier but mainly in its hydrodynamically active regions.
Two phases of the densification have been identified. The first is a relatively short phase of densification governed by the initial difference between the absolute load pressure of ice sediments and lhe average pressure in air bubbles al the pore- close-off depth. This phase takes place within the depth interval 1.0< h ≤3.0, where ≤ is the ice-equivalent depth normalized so that ≤=1 at close-off. The difference between the absolute load pressure and the averaged pressure in the ice matrix is important especially when modeling porosity variations within this depth range. The second, the asymptotic phase of bubbly-ice densification, takes place at ≤>3.0, under minimal bubble-ice pressure-drop which is governed by the present-day accumulation rate. The rate of bubble compression at this stage is not sensitive to past changes in the pore close-off conditions and the bubble pressure does not depend on the air content in ice. On the Other hand, the ice-porosity profile is found be responsive to air-content variations.
Both ice-porosity and bubble-pressure profiles in ice sheets are sensitive to the rheological parameters of pure ice but only the bubble-pressure profile distinguishes the rheological properlies al low and high stresses. Finally, the stationary model of bubbly-ice densification appears to be Sufficient for interpreting the experimental data, provided that the conditions at the pore close-off depth are relatively steady during the typical duration of the process. In the accompanying paper (paper II), wc shall formulate the inverse problem and use die model to deduce rheological properties of pure ice as well as to estimate the air content from porosity and bubble-pressure profiles measured in ice sheets.
Acknowledgements
The authors are grateful to their colleagues from Kazan State University: V. A Chugunov, A. G. Yegorov, L. D. Eskin as well as to T. Hondoh from the Institute of Low Temperature Science (Sapporo) and J. Meyssonnier from the Laboratoire de Glaciologie el Géophysique de L’Envoironnement (L.E.G.G.), Grenoble, for helpful and stimulating discussions. Special thanks are addressed to P. Martinerie (L.G.G.E.) who thoroughly read the draft and suggested many constructive improvements. We also highly appreciate the very useful comments by K. Hutter (Institut für Mechanik. Darmstadt) taken into account in the final version of the paper .
This research was supported in Russia by the Russian Federation Stale Committee for Science and Technologies and the Russian Basic Research Foundation, and in France by the Programme National d’Etudcs de la Dynamique du Climat (C.N.R.S). the Département Sciences Pour l’Ingénieur du C.N.R.S. and Le Congrès de Mécanique à Grenoble.



