I. INTRODUCTION
Hafnium dioxide (HfO2) has been extensively studied due to a great number of its applications. For instance, HfO2 has been applied as a high-k dielectric in field-effect transistorsReference Park, Cho, Choi, Bae, Lee, Lee and Lee1–Reference Choi, Mao and Chang3 and different kinds of memory devices.Reference Sriraman, Li, Singh and Lee4,Reference Ye, Chang-Liao, Tsai, Tsai and Wang5 In addition, HfO2 thin films have been used in high-refractive-index layers of optical coatingsReference Hamden, Greer, Hoenk, Blacksberg, Dickie, Nikzad, Martin and Schiminovich6,Reference Chen, Zhao, Yu, Fang, Li, He and Shao7 and waveguides.Reference Concalves, Carturan, Montagna, Ferrari, Zampedri, Pelli, Righini, Ribeiro and Messaddeq8 In the majority of these applications, amorphous HfO2 films can be used. Crystallization of the films has usually led to the formation of polycrystalline structure with nonuniform material properties and great number of grain interfacesReference Mitchell, Aarik and Aidla9 that may result in increase of leakage current and/or light scattering. These detrimental effects might be weaker or even negligible in epitaxial films. Advantages of epitaxial dielectrics have been clearly demonstrated e.g., for capacitor structures with RuO2 electrodes and TiO2 dielectrics deposited on single crystal α-Al2O3 substrates.Reference Fröhlich, Aarik, Ťapajna, Rosová, Aidla, Dobročka and Hušeková10
Studies on epitaxial growth of HfO2-based dielectrics have been rather scarce, however. Epitaxial and/or quasi-epitaxial growth of HfO2 has been reported to take place on Si,Reference Dai, Lee, Wong, Chan and Choy11–Reference Zhang, Tu, Wang, Xiong, Yang, Wang and Du14 Ge,Reference Gusev, Shang, Copel, Gribelyuk, D’Emic, Kozlowski and Zabel15,Reference Delabie, Puurunen, Brijs, Caymax, Conard, Onsia, Richard, Vandervorst, Zhao, Heyns, Meuris, Viitanen, Brongersma, de Ridder, Goncharova, Garfunkel, Gustafsson and Tsai16 GaAs,Reference Hsu, Chang, Lee, Yang, Lee, Hong, Kwo, Huang and Lee17,Reference Liou, Chu, Chen, Lee, Chang, Lee, Hong and Kwo18 MgO,Reference Forsgren, Hårsta, Aarik, Aidla, Westlinder and Olsson19 and KCl,Reference Bagmut, Bagmut, Zhuchkov and Shevchenko20 whereas films on Si and Ge substrates have been of more significant practical importance. Main problems with epitaxy of HfO2 on Si, Ge, and GaAs are related to the formation of interfacial oxide, which tends to be amorphous and therefore has to be avoided or removed to realize epitaxial growth. Therefore, in corresponding studies, more attention has to be concentrated on the control of the substrate surface rather than on mechanisms of the film growth and epitaxial quality of films obtained.
According to literature data, α-Al2O3 seems to be a more convenient substrate material for investigation of epitaxial growth of oxides because the substrate surface pretreatment is less critical in this case. Thin films of ZrO2,Reference Asaoka, Katano and Noda21 TiO2,Reference Schuisky, Hårsta, Aidla, Kukli, Kiisler and Aarik22 SnO2,Reference Tarre, Rosental, Aidla, Aarik, Sundqvist and Hårsta23 Fe2O3,Reference Lie, Fjellvag and Kjekshus24 and Cr2O3Reference Mändar, Uustare, Aarik, Tarre and Rosental25 have been epitaxially grown at relatively low temperatures using the atomic layer deposition (ALD) method on α-Al2O3 substrates. Taking into account these encouraging results, the present work was performed to investigate the possibilities for ALD of epitaxial HfO2 on α-Al2O3. Epitaxial HfO2 films on these substrates are of interest because the films of HfO2 and Al2O3 individually or in combination have an increasing application potential, e.g., in optical waveguides,Reference Ribeiro, Messaddeq, Goncalves, Ferrari, Montagna and Aegerter26,Reference Aslan, Webster, Byard, Pereira, Hayes, Wiederkehr and Mendes27 as well as in gate dielectric stacksReference Mroczyński, Taube, Gierałtowska, Guziewicz and Godlewski28 and metal-oxide-semiconductor capacitors.Reference Lee, Chin, Chu, Lin, Lee, Tung, Lee, Hong and Kwob29,Reference Lee, Choi, Cho, Park, Hwang and Kim30
For these reasons, we investigated ALD of HfO2 films on single crystal α-Al2O3(1 $\bar 1$02) (r-cut Al2O3) substrates. We demonstrate that by applying HfCl4 and H2O as precursors, textured epitaxial HfO2 can be grown by ALD on these substrates at temperatures down to 450 °C.
II. EXPERIMENTAL
HfO2 films were grown in an experimental hot-wall flow-type reactorReference Aarik, Aidla, Kiisler, Uustare and Sammelselg31 on r-cut Al2O3 substrates using HfCl4 (99.9%, Alfa-Aesar, Karlsruhe, Germany) and H2O as precursors. HfCl4 was volatilized at 140–143 °C. Vapor of H2O was generated from de-ionized water kept at 20–23 °C. Nitrogen (99.999%, AGA, Tallinn, Estonia) was used as a carrier and purging gas. The nitrogen flow was 120 sccm and the total gas pressure ranged from 2.0 to 2.2 mbar in the reaction zone. For deposition of the films, the samples were exposed to HfCl4 for 2 s, purged by N2 for 2 s, exposed to H2O for 2 s and purged by N2 for 2 s. The growth temperature (T G) and number of deposition cycles were varied from 400 to 750 °C and from 100 to 3200, respectively.
X-ray diffraction (XRD), x-ray reflection (XRR) and x-ray fluorescence (XRF) methods were used for analysis of crystal structure and characterization of density (ρ), root-mean square (RMS) surface roughness (σ), and thickness (t) of the films. Most of XRR patterns were recorded on a reconstructed topographic diffractometer URT–1 (Nauchpribor, Oriol, Russia) by using Cu Kα radiation (2.2 kW source). Crystal quality analysis, in-plane texture analysis, reciprocal space mapping and high resolution XRR measurements were performed on material research diffractometer SmartLab (Rigaku™, Tokyo, Japan) by using Cu Kα radiation (9 kW source). Combination of XRR and XRF methods were used to determine the film thickness, density, and roughness. For XRF spectroscopy studies, we applied XRF analyser ZSX400 (Rigaku™, Tokyo, Japan) with wave length dispersive x-ray spectrometer. Additional information about the surface roughness was obtained from atomic force microscopy (AFM) measurements.
III. RESULTS AND DISCUSSION
A. Crystal structure and lattice orientation
1. Phase composition
X-ray analysis of films deposited on α-Al2O3 substrates revealed only four clear reflections in the measurement range of 20–75° (Fig. 1). Two strong reflections (at 25.57 and 52.46°) corresponded to the family of lattice planes {1 $\bar 1$02} of the substrate. Two other reflections at 33.8° (interplanar spacing d = 0.265 nm) and 71.1° (d = 0.1325 nm) were close to the reflections 002 and 004 or 020 and 040 of the monoclinic phase, or 200 and 400 of the cubic phase, or 020 and 040 of the orthorhombic phase of HfO2. The film that was grown at T G = 400 °C showed asymmetric broadening of the main reflection peaking at 33.8°. The asymmetry could be explained by contribution of two or more reflections indicating existence of multiple growth directions. By taking into account the stability of different phases of HfO2, the reflections most probably originated from the (001) or (010) planes of monoclinic HfO2. Unambiguous indexing of the HfO2 reflections was, however, not trivial because the 002 and 020 reflections were very close to each other. Although the (001) plane gave the closest match with the observed reflections, indexing to the plane (010) could also be considered by assuming some strain in the lattice. It is worth mentioning that in polycrystalline HfO2 films with monoclinic structure deposited on silicon and amorphous silica substrates at 300–500 °C, the (001) orientation has also been the predominant one.Reference Aarik, Aidla, Mändar, Sammelselg and Uustare32 In that case, however, the preferential orientation was developed because of higher growth rate in the corresponding direction rather than that due to the effect of the substrate on the orientation of the crystal structure. Therefore complex XRD φ-scan and in-plane texture measurements were performed in the present work for phase identification and determination of in-plane as well as out-of-plane orientation of the thin film structure on α-Al2O3 substrates.
XRD patterns of HfO2 grown on α-Al2O3(1 $\bar 1$02) substrates by using 800 ALD cycles.

2. Lattice orientation
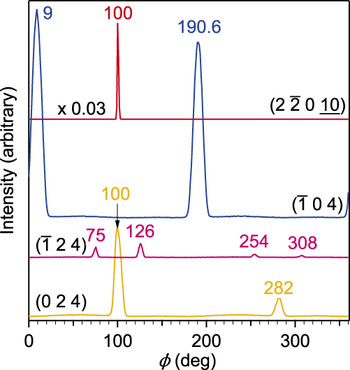
In-plane lattice orientation was analyzed by XRD φ-scan of the reflection 2 $\bar 20 \underline 1 \underline 0$ of α-Al2O3 and reflections
 $\bar 1$04, 104,
 $\bar 1$24, 024 of monoclinic HfO2. From six equivalent planes of the form {2
 $\bar 2$010} for α-Al2O3(1
 $\bar 1$02), only one, that had a small angle (25.4°) with the substrate surface, could be seen in nonsymmetrical coplanar φ-scan diffraction pattern. As expected, a single reflection, that corresponded to the zone [110] (or [
 $\bar 1$2
 $\bar 1$0], [
 $\bar 21$10]) of α-Al2O3 was seen at φ = 100.0° (Fig. 2).
XRD φ-scan reflections from the lattice planes of the α-Al2O3 substrate and HfO2 film. The indices of planes are shown at corresponding patterns. For clarity, an intensity scaling factor of 0.03 was used for the α-Al2O3 pattern. A label near a peak shows the location (φ) of the reflection. Thickness of the HfO2 film was 170 nm.

For HfO2, only one reflection (e.g.,  $\bar 1$04) out of two in the form {
 $\bar 1$04} was expected to appear on its φ-scan at the sample orientation, where the zone [010] [interception of planes (
 $\bar 1$04) and (002)] is oriented perpendicular to the primary beam direction. The φ-scan of
 $\bar 1$04 showed two broad reflections at 9 and 190.6° (Fig. 2), however. The observed angle between the zones [110] of α-Al2O3 and [010] of HfO2 was about 90°. Thus, observation of two reflections for the form {
 $\bar 1$04} can be explained by existence of two equivalent lattice orientations of HfO2, related by 2-fold symmetry operation.
Two reflections of the form { $\bar 1$24}, located at a distance of about 53.6° (the angle between the zones [210] and [2
 $\bar 1$0]) from each other, were expected to appear on the φ-scan of reflection
 $\bar 1$24. The experiment recorded two reflections at 75 and 126°. Another pair of reflections at 254 and 308° (Fig. 2) was related to two equivalent lattice orientations of HfO2.
Two reflections 024 and 0 $\bar 2$4 [belonging to zones [100] and [
 $\bar 1$00] when intercepting with plane (001)] out of four of the family {024} were expected and were observed (at 100 and 282°) on its φ-scan. The first observed reflection coincided with the zone [110] of α-Al2O3. This result allowed us to conclude that the film-to-substrate orientation relation was (001)[100] HfO2//(1
 $\bar 1$02)[110]α-Al2O3. The existence of two different lattice orientations of HfO2 domains on α-Al2O3(1
 $\bar 1$02) substrate did not increase the number of observed reflections for the form {024}, because the sets of reflections, related by 2-fold symmetry overlap with each other.
The conclusion about the crystallographic orientation of the film and substrate was also confirmed by the consistency of the expected and observed angles between the reflections and zones for all three φ-scan analyses. The calculated angle between the zones [100] and [210] of HfO2 was 26.8°. This value matched well with the angle of 25° between the observed reflections of φ-scans for reflections (024) and ( $\bar 1$24).
3. Match of 2D cells
In the case of epitaxial films, the film-to-substrate in-plane orientation, determined by XRD, should be a result of matching the 2D unit cells of the substrate and film. The surface structure of α-Al2O3(1 $\bar 1$02) has been described in detail by Trainor et al.Reference Trainor, Eng, Brown, Robinson and De Santis33 Comparison of the 2D models for α-Al2O3(1
 $\bar 1$02) and HfO2 (001) planes performed in the present study (Fig. 3) showed the existence of rectangular 2D unit cells on these planes, whereas the cell parameters were u[110] = 0.476 nm, u
 $_{[ {\bar 111}]}$ = 0.513 nm for α-Al2O3 and v[100] = 0.512 nm and v[010] = 0.517 nm for HfO2. According to the φ-scan analysis (Fig. 2) two in-plane orientation relations were observed: (i) u[110]//v[100] and u
 $_{[ {\bar 111}]}$//v[010]; (ii) u[110]//v
 $_{[ {\bar 100}]}$ and u
 $_{[ {\bar 111}]}$//v
 $_{{[0} {\bar 10}]}$. The unrelaxed misfit strain, defined as ε0 = (a s − a f)/a f, where a f and a s are unstrained lattice spacings for the film and substrate, respectively, have values of ε0//[110] = −7.0%, ε0//[
 $\bar 1$11] =−0.8% in different directions of the 2D-cell basis vectors of α-Al2O3(1
 $\bar 1$02). The negative strain of HfO2 results in compression of its lattice in the directions, which are parallel to the surface, and extension in the perpendicular direction.
Structure models showing in-plane unit cells and atomic arrangements for atomic planes of (a) α-Al2O3(1 $\bar 1$02) and (b) HfO2 (001). Large spheres designate oxygen atoms and small spheres Al or Hf atoms. The intensity of the shading (color) is proportional to the coordinate of an atom in the direction of surface normal. The labels at the arrows show the corresponding crystallographic directions. All atoms are shown at their positions in the bulk structure, i.e., the surface reconstruction is not taken into account.

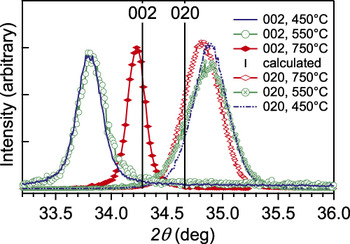
The expected deformed state of the film, i.e., compression of the lattice in direction [010] and extension in direction [001], was observed by recording reflections 020 (in-plane scan) and 002 (symmetrical out-of-plane scan) of HfO2 for films grown at 450, 550, and 750 °C. Figure 4 shows that the reflection 002 was located at lower and 020 at higher angles compared to their positions for an unstrained lattice. With the increase of T G from 450 to 750 °C, the lattice strain, calculated from the shifts of reflections, decreased from the value of 1.5–0.2% in the direction of surface normal and from −0.75 to −0.4% in the direction [110] of the α-Al2O3 lattice. This decrease of the lattice strain was accompanied by the improvement in out-of-plane texture with increasing T G (Fig. 5).
Diffraction reflections 002 (out-of-plane scan) and 020 (in-plane scan) of films grown at 450 °C (t = 61 nm), 550 °C (t = 53 nm), and 750 °C (t = 52 nm). The calculated positions of the reflections for a bulk monoclinic hafnium oxide (ICSD collection code 27,313) are shown by vertical lines. The intensities of the reflections were scaled to have the same level.

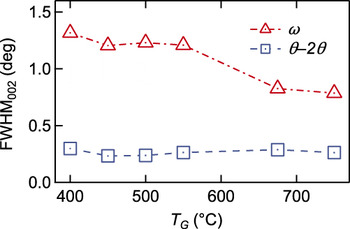
Influence of T G on FWHM of the reflection 002 of monoclinic HfO2 in ω (rocking curve) and θ-2θ scan modes for films deposited by applying 800 cycles. Film thicknesses decreased from 62 to 55 nm with the increase of T G from 400 to 750 °C.

The in-plane orientational relationship of the substrate and film that was determined by φ-scan analysis can be explained by matching of atomic arrangements in two-dimensional (2D) unit cells (Fig. 3). It can be seen from Fig. 3 that anion and cation sub-lattices of both structures show similar spatial patterns. The evaluations of matching performed by lattice overly calculations (program MercuryReference Macrae, Bruno, Chisholm, Edgington, McCabe, Pidcock, Rodriguez-Monge, Taylor, van de Streek and Wood34) showed small values for root-mean-square distances (RMSD) between the corresponding atoms of the substrate and film. The RMSD value was 0.025 nm for cations and 0.018 nm for anions. The distance was calculated over a surface area of 1.2 nm2, i.e., over five 2D unit cells. It is important to note that the same match of lattices can be observed if the film lattice is 2-fold rotated around the directions of [010] and [001]. This explains why two reflections on the φ-scan of ( $\bar 1$04) and two pairs of reflections on the φ-scan of the reciprocal lattice point [[
 $\bar 1$24]] were observed (Fig. 2). In conclusion, the observed epitaxial growth of monoclinic HfO2 film on hexagonal α-Al2O3 is not surprising because the plane (1
 $\bar 1$02) of α-Al2O3 and (001) of HfO2 both have rectangular symmetry with comparable values of cell parameters. Moreover, the atomic arrangements on these planes are very similar to each other.
4. Crystal quality
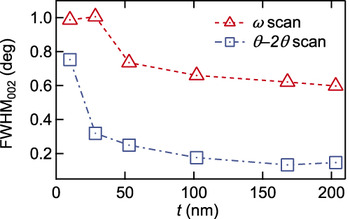
Rocking curve (ω-scan) analysis of the films was performed to determine the out-of-plane epitaxial quality (mosaicity) and its dependence on T G and t (Figs. 5 and 6). The ω-scans were measured by rocking around the zone [110] of α-Al2O3. Decrease of FWHM from 1.3 to 0.8°, indicating improvement in out-of-plane texture was observed with increasing T G in the range of 450–750 °C, whereas the decrease was fastest between 550 and 675 °C (Fig. 5). Improvement in out-of-plane texture was also seen with increasing t at T G = 750 °C (Fig. 6). Thinner films (up to 30 nm) showed the FWHM as high as 1.0°. The minimum values of around 0.6° were detected at t of about 200 nm. For comparison, the measured miscut and mosaicity angles of substrates were 0.5 and 0.05°, respectively. Relatively large mosaicity of the films can be explained by significant strain in the lattice of HfO2. Relaxation of the strain results in the appearance of dislocations in the lattice. According to the calculations, the misfit dislocations should appear with a period of 14 cell parameters (about 7.3 nm) in direction [100] of HfO2 and with a period of 128 cell parameters (64 nm) in direction [010]. Most probably, the dislocations are located at the grain boundaries.
Influence of the film thickness on FWHM of the reflection 002 in ω and θ-2θ scan modes for films grown at T G = 750 °C.

High resolution in-plane φ-scan texture analysis of the broadening for the reflection 020 (denoted as FWHM020) was performed for characterization of the in-plane texture. This reflection was selected because the atomic plane (010) was oriented perpendicular to the sample surface and gave therefore unbiased mosaicity compared to the nonsymmetric reflections that were used for in-plane texture analysis. Four samples grown at T G = 750 °C showed FWHM020 values of 0.10° at t = 10 nm, 0.72° at t = 53 and 102 nm and 0.81° at t = 154 nm. The small value of FWHM020 for the thinnest film (150 growth cycles) is a clear indication of a good in-plane epitaxial orientation of the film and substrate lattices. When the film grew thicker, the lattice relaxation took place and increased the disorientation of lattices, reflected by the increase of FWHM020.
We also estimated the effective x-ray volume weighted crystallite size from Scherrer equation, by assigning the full physical broadening of the reflection 002 (θ-2θ scans in Figs. 5 and 6) to the size broadening and using LaB6 powder (SRM-660) as a standard material for elimination of geometric broadening. The size did not depend considerably on T G, being about 36 nm for films grown at T G = 400 °C, increasing up to 50 nm at T G = 500–550 °C and then decreasing to 44 nm at T G ≥ 550 °C. About two times smaller x-ray crystallite size compared to the film thickness at T G = 400 °C can be explained by existence of considerable stresses in the structure of HfO2, that similarly to size effects, also contributed to the broadening of the reflections and reduced the apparent crystallite size values.
B. Density and surface roughness
Estimated densities of the films ranging from 9.8 to 10.3 g/cm3 were close to the density of monoclinic single-crystalline HfO2 (ρcalc = 10.1 g/cm3) and did not depend markedly on the film thickness and T G.
Comparison of the RMS surface roughness values (Fig. 7) and, particularly the dependencies of the surface roughness on the film thickness (Fig. 8), led us to a conclusion that the character of the film growth in its initial stage markedly depended on the temperature in the range of 450–750 °C. For instance, the low RMS roughness of 7–30 nm thick films deposited at 450–550 °C (Fig. 8) is directly related to a very uniform nucleation. Due to uniform nucleation of the film at these temperatures and differences in the unit cells of the substrate and film, significant strain was created in those films as can be concluded from the data depicted in Fig. 4. The increase of the film thickness to 50–60 nm caused, however, a significant roughening of the surface. A possible reason for surface roughening with increasing film thickness might be Stranski-Krastanov-type nonuniform growth that appears at a certain film thickness.Reference Daudin, Widmann, Feuillet, Samson, Arlery and Rouviere35
Variation of RMS roughness with T G for HfO2 films deposited on α-Al2O3(1 $\bar 1$02) substrate by applying 800 cycles.

Variation of RMS roughness with thickness (t) of HfO2 films deposited on α-Al2O3(1 $\bar 1$02) substrate at T G = 450, 550, and 750 °C.

By contrast, the RMS surface roughness of 7-nm thick films deposited at 750 °C was as high as 3 nm. However, the roughness did not increase notably with the increase of the film thickness to 100 nm (Fig. 8). Consequently, island growth was initiated at this temperature in the very beginning of deposition. This led to more independent formation of grains. As a result, the films, deposited at 750 °C, were significantly less strained than those deposited at 450–550 °C (Fig. 4).
It should be mentioned that the surface roughness determined by AFM was markedly lower than that obtained from XRR measurements. Probable reasons for this difference were finite sizes of the AFM tip (tip curvature was up to 10 nm) and thickness gradients that could cause apparent increase in the XRR roughness. Therefore, AFM measurements most likely under-estimated and XRR measurements over-estimated the surface roughness. The general trends observed by AFM and XRR were similar, however, except for the roughness values of the films deposited on α-Al2O3 at T G < 550 °C (Fig. 7).
Comparison of the surface roughness values determined for epitaxial films (Fig. 7) with those measured earlier by AFM for polycrystalline films of similar thicknessReference Rammula, Aarik, Mändar, Ritslaid and Sammelselg36 showed a marked advantage of the former films. The RMS surface roughness of epitaxial films (Fig. 7) was 1.5–3 times lower than that of polycrystalline films deposited at the same temperatures on Si and SiO2 substrates.Reference Rammula, Aarik, Mändar, Ritslaid and Sammelselg36
C. Growth rate
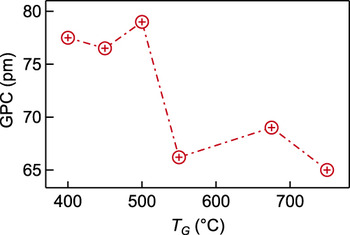
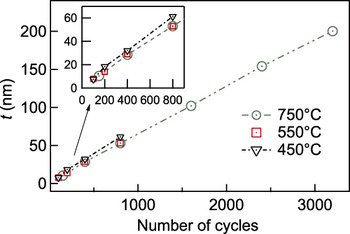
The influence of T G on the growth per cycle (GPC) of HfO2 was relatively weak at temperatures studied in this work. Nevertheless, GPC was higher at 400–500 °C than that determined at 550–750 °C (Fig. 9). Nucleation delays that had markedly influenced the mean GPC in the high-temperature HfCl4-H2O ALD processes on silicon substratesReference Aarik, Aidla, Kikas, Käämbre, Rammula, Ritslaid, Uustare and Sammelselg37 were negligible on the α-Al2O3 substrates at growth temperatures up to 750 °C, as demonstrated the dependence of the film thickness on the number of cycles (Fig. 10). Similarly, it was possible to exclude the changes in surface roughness as possible reasons for the observed dependence of GPC on T G. Indeed, the surface roughness (Fig. 7) and, correspondingly, the effective surface area of the films deposited at T G exceeding 600 °C were not lower than those of the films deposited at 400–500 °C. Hence, there was no correlation between GPC and the effective surface area that could influence the growth rate. Consequently, the decrease of GPC with increasing T G was most probably a result of decreasing density of adsorption sites for the precursors on the surface of (001) oriented monoclinic HfO2 film. This conclusion is in good agreement with results published for polycrystalline HfO2 films deposited on Si and SiO2 substrates.Reference Aarik, Aidla, Mändar, Sammelselg and Uustare32,Reference Rammula, Aarik, Mändar, Ritslaid and Sammelselg36 In these films, preferential (001) orientation was developed at 400–500 °C due to faster growth of crystallites with this orientation compared to that of crystallites with other orientations. At higher T G, however, the growth of HfO2 with (100) orientation became more significant in the nonepitaxial polycrystalline films.Reference Rammula, Aarik, Mändar, Ritslaid and Sammelselg36 At the same time the overall GPC of those films stayed at the same levelReference Mitchell, Aarik and Aidla9 or slightly decreasedReference Aarik, Aidla, Mändar, Sammelselg and Uustare32,Reference Rammula, Aarik, Mändar, Ritslaid and Sammelselg36 with the increase of T G from 450 to 750 °C. Consequently, the corresponding changes in the preferential orientation were related to the decrease of the growth rate of crystallites with the (001) orientation. As the (001) orientation was the only one that was present in the epitaxial films, the decrease of GPC of these films with the increase of T G from 400–500 to 750 °C was obviously related to the same effect.
Variation of GPC with T G for films deposited by applying 800 cycles.

Dependence of film thickness (t) on the number of ALD cycles applied for deposition of the films on the α-Al2O3 substrate at T G = 450, 550, and 750 °C. The inset shows the variation of thickness in the initial growth stage.

Absence of nucleation delays on the α-Al2O3 substrates (Fig. 10) allowed us to conclude that the island growth, which caused relatively high surface roughness of very thin films deposited at 750 °C was not related to nucleation problems on the substrate surface. More likely, Stranski-Krastanov type growth was the reason for surface roughening. However, the 3-dimensional growth started at much smaller film thickness at 750 °C than at 450–550 °C. A similar effect has earlier been observed in the case of epitaxial growth of GaN on AlN.Reference Daudin, Widmann, Feuillet, Samson, Arlery and Rouviere35 As a result of this difference, the mean strain was smaller in our films deposited at 750 °C compared with that of the films grown at lower temperatures (Fig. 4).
V. CONCLUSION
The results obtained demonstrate that epitaxial HfO2 thin films can be deposited on single crystal r-cut Al2O3 by ALD at substrate temperatures ranging from 450 to at least 750 °C. The film-to-substrate out-of-plane orientation was determined to have a single (001)HfO2//(1 $\bar 1$02)α-Al2O3 relationship. Since the in-plane orientation showed existence of two possible relationships: [100]HfO2//[110]α-Al2O3 and [
 $\bar 1$00]HfO2//[110]α-Al2O3, the film had multiple in-plane domains, and therefore, it can be defined as a textured epitaxial film. These orientational relationships are in agreement with the results of two-dimensional conformation analysis of unit cells for the film and substrate. The main advantage revealed for the epitaxial films in this study was markedly lower surface roughness compared to that of polycrystalline films deposited on Si substrates. Consequently, the surface roughening of polycrystalline films is in significant extent related to the dependence of the growth rate on crystallographic orientations of the monoclinic phase formed in the films.
ACKNOWLEDGMENTS
The authors thank Alma-Asta Kiisler for technical assistance in sample preparation. This work was partially supported by Estonian Research Council (projects ETF7845, ETF7603 and ETF9088), Estonian Center of Excellence in Research Project TK117T and Estonian Ministry of Education and Research (project IUT2-24).