





Introduction
Obsessive-compulsive disorder (OCD) is a mental illness characterized primarily by obsessions and compulsions, which severely impair patients’ social functioning, career development, and educational progress (Stein, Reference Stein2002). Epidemiological studies indicate that the global lifetime prevalence of OCD is ~2–3%, affecting over 130 million individuals worldwide (Huang et al., Reference Huang, Wang, Wang, Liu, Yu, Yan, Yu, Kou, Xu, Lu, Wang, He, Xu, He, Li, Guo, Tian, Xu, Xu and Wu2019; Osland, Arnold, & Pringsheim, Reference Osland, Arnold and Pringsheim2018; Roh, Jang, & Kim, Reference Roh, Jang and Kim2023). Cognitive fusion (CF), a core concept in Acceptance and Commitment Therapy (ACT), has gained increasing attention in OCD research in recent years. Grounded in Relational Frame Theory (RFT), CF reflects a psychological process in which individuals overidentify with the content of their thoughts, equating subjective cognitions with objective reality. Substantial evidence indicates that OCD patients exhibit marked CF; they tend to excessively attend to and identify with intrusive thoughts, perceiving them as real and significant, which in turn leads to pathological compulsive behaviors aimed at controlling or eliminating these thoughts (Reuman, Jacoby, & Abramowitz, Reference Reuman, Jacoby and Abramowitz2016). However, the specific mechanisms underlying CF and its neurobiological basis remain poorly understood. Investigating the psychological and neural correlates of CF holds important theoretical and practical significance for clarifying the pathogenesis of OCD and developing effective clinical interventions.
Previous studies by our team have demonstrated that first-episode, drug-naïve OCD patients exhibit significantly increased amplitude of low-frequency fluctuations (ALFFs) in the left dorsolateral superior frontal gyrus (SFGdl) and bilateral orbital middle frontal gyri, with ALFF in the left SFGdl significantly correlated with CF and mediating the effect of CF on obsessive-compulsive symptoms (Suo et al., Reference Suo, Zhang, Li, Xu, Zeng, Lei, Zhang, Luo, Xia, Zeng and Hu2026). This finding highlights CF-related abnormalities in brain function. Nevertheless, functional brain activity is supported by underlying anatomical structures. Chronic psychopathological processes can cumulatively alter brain microstructure and macrostructure through mechanisms of neuroplasticity (Xiao et al., Reference Xiao, Hou, Xiao, Zhou, He, Dong and Hu2024). Therefore, a deeper investigation into the neuroanatomical substrates of CF is crucial for a comprehensive understanding of the pathology of OCD.
Voxel-based morphometry (VBM) is a classical method for detecting regional abnormalities in gray matter volume (GMV). Numerous VBM studies have confirmed widespread gray matter alterations in OCD patients. For example, a meta-analysis by Hu et al. (Reference Hu, Du, Chen, Li, Zhou, Zhang, Liu, Lu, Mreedha, Huang and Gong2017) revealed that adult OCD patients show significant GMV reductions in regions such as the prefrontal cortex and anterior cingulate cortex, alongside volume increases in the striatum, supporting the classic cortico-striato-thalamo-cortical (CSTC) circuit hypothesis. However, the brain functions as a complex network system reliant on coordinated interactions among distributed regions. Analytical approaches focusing solely on local GMV are insufficient for capturing interregional connectivity and cooperation. Structural covariance network (SCN) analysis, an emerging network-based method, quantifies covariation in morphological features across brain regions within a population, reflecting coordinated maturational processes and shared neurotrophic regulation during development (Alexander-Bloch, Giedd, & Bullmore, Reference Alexander-Bloch, Giedd and Bullmore2013; Duan & Wen, Reference Duan and Wen2023). Compared to functional connectivity, SCN may better reflect long-term, stable neurodevelopmental characteristics. Reess et al. (Reference Reess, Rus, Gürsel, Schmitz-Koep, Wagner, Berberich and Koch2018) found that OCD patients exhibit reduced local clustering coefficients within gyrification-related SCN, suggesting impaired topological organization of structural brain networks. Although existing studies have examined structural network abnormalities in OCD, no research to date has explored how CF modulates patterns of coordinated development across brain regions, that is, whether high levels of CF are associated with pathological structural coupling within specific brain networks.
Beyond mechanistic investigations, identifying objective biomarkers capable of predicting treatment response represents another urgent clinical need. Current reviews indicate that existing structural neuroimaging markers still lack sufficient accuracy in predicting individual responses to pharmacological or psychotherapeutic interventions (Moreau, Hansen, & Bogdan, Reference Moreau, Hansen and Bogdan2025). Moreover, macroscopic structural changes in the brain are often regulated by fine-grained gene expression patterns. The Allen Human Brain Atlas (AHBA) provides high-resolution, whole-brain gene expression data, enabling direct linkage between neuroimaging phenotypes and transcriptomic features (Arnatkeviciute, Fulcher, & Fornito, Reference Arnatkeviciute, Fulcher and Fornito2019). Research has shown that spatial variations in gene expression are closely associated with normal brain development and degenerative changes, and imaging-derived phenotypic regions in disorders correspond to transcriptional dysregulation in postmortem brain tissue (Arnatkeviciute, Fulcher, Bellgrove, & Fornito, Reference Arnatkeviciute, Fulcher, Bellgrove and Fornito2022). Thus, integrating structural imaging abnormalities in OCD with AHBA transcriptomic data can help explore the normative molecular profiles that may confer regional vulnerability to these structural alterations.
In summary, this part of the study employs a multimodal approach combining VBM, SCN, and moderation analysis in a cohort of first-episode, drug-naïve OCD patients to systematically investigate brain structural abnormalities in OCD and their clinical relevance. Specifically, we aim to (1) verify abnormalities in regional GMV and SCN in OCD patients, (2) clarify the moderating effect of CF on the strength of structural network connectivity, thereby elucidating the neuroanatomical basis of psychological inflexibility, and (3) using longitudinal follow-up data, evaluate the predictive value of baseline structural features for the improvement rate of CF after 8 weeks of pharmacological treatment. Furthermore, by integrating AHBA transcriptomic data, we seek to characterize the normative transcriptomic landscape spatially associated with structural abnormalities in key brain regions. This work is expected to offer new insights into the pathophysiology of OCD and the prediction of treatment response.
Methods
Participants
This study recruited 80 first-episode, drug-naïve patients with OCD and 70 healthy controls (HCs). Patients were recruited from the Psychosomatic Medicine Department of the First Affiliated Hospital of Nanchang University between July 2023 and November 2025. All patients met the diagnostic criteria for OCD according to the Diagnostic and Statistical Manual of Mental Disorders, Fifth Edition (DSM-5), confirmed by two experienced psychiatrists. The Structured Clinical Interview for DSM-5 (SCID-5) was administered to all participants for standardized diagnostic assessment.
Inclusion criteria for OCD patients were: (1) meeting DSM-5 criteria for OCD; (2) first episode and no prior treatment (pharmacological, psychological, or physical); (3) a total score ≥ 16 on the Yale-Brown Obsessive Compulsive Scale (Y-BOCS); (4) age 18–55 years; (5) Han Chinese ethnicity and right-handedness; and (6) capacity to provide informed consent. Exclusion criteria included: (1) any current or lifetime comorbid psychiatric disorder per SCID-5 (e.g. major depressive disorder, generalized anxiety disorder, bipolar disorder, schizophrenia, and substance use disorder); (2) clinically significant depressive (Beck Depression Inventory, BDI ≥14) or non-OCD-related anxiety symptoms; (3) history of neurological or major medical illness; (4) pregnancy or lactation; (5) MRI contraindications; and (6) structural brain abnormalities on conventional MRI.
HCs were required to have no current or past psychiatric disorders per SCID-5, be aged 18–55 years, Han Chinese, right-handed, and capable of providing informed consent. They were excluded for any personal or first-degree family history of psychiatric disorders, neurological illness, head trauma, major medical conditions, substance abuse, intellectual disability, MRI contraindications, pregnancy, lactation, or structural brain abnormalities.
A priori power analysis using G*Power 3.1 indicated a minimum of 26 participants per group was required (power = 0.8, α = 0.05, effect size d = 0.8). The study was approved by the Medical Ethics Committee of the First Affiliated Hospital of Nanchang University (No. IIT-2020-31). All participants provided written informed consent.
Clinical assessments
Demographic information was collected via a custom questionnaire. Symptom severity was assessed using the Beck Anxiety Inventory (BAI), Beck Depression Inventory (BDI), and the Y-BOCS. The Chinese version of the Cognitive Fusion Questionnaire (CFQ) was used to measure CF. All scales have demonstrated good reliability and validity in Chinese populations.
MRI data acquisition
MRI scans were acquired using a 3.0T Signa Premier scanner (GE Healthcare, USA) equipped with a 48-channel head coil. High-resolution T1-weighted structural images were acquired using a 3D fast spoiled gradient echo sequence: repetition time (TR)/echo time (TE) = 1900/3.0 ms, flip angle = 12°, matrix = 256 × 256, field of view (FOV) = 256 × 256 mm2, isotropic resolution = 1.0 mm3. Participants were instructed to keep their eyes closed, remain awake and motionless, and not think of anything in particular.
Pharmacological treatment and follow-up
Patients received 8 weeks of open-label monotherapy with a selective serotonin reuptake inhibitor (SSRI: sertraline, fluoxetine, fluvoxamine, paroxetine, or escitalopram). The choice and dose were determined by a senior psychiatrist based on clinical profile and tolerability, following a rapid titration schedule. Concomitant use of antipsychotics or mood stabilizers was prohibited. Short-term (≤ 4 weeks) use of low-dose benzodiazepines or Z-drugs for severe insomnia was permitted but discontinued at least 24 hours before the week-8 assessment. All SSRI doses were converted to fluoxetine equivalents. Clinical assessments were repeated at the end of week 8.
MRI data preprocessing
Structural T1 images were converted from DICOM to NIFTI format using dcm2nii (Digital Imaging and Communications in Medicine to Nifti, http://www.cabi.gatech.edu/mricro/mricron/dcm2nii.html). Preprocessing was conducted using SPM12 and the Computational Anatomy Toolbox (CAT12, http://dbm.neuro.uni-jena.de/cat12/) toolbox (Gaser et al., Reference Gaser, Dahnke, Thompson, Kurth and Luders2024). Steps included manual reorientation to the anterior commissure, quality control (excluding datasets with translation >2 mm or rotation >2°), bias-field correction, segmentation into gray matter, white matter, and cerebrospinal fluid, and spatial normalization to Montreal Neurological Institute (MNI) space using the DARTEL algorithm. Modulated GMV images were generated with a resolution of 1.5 mm3 and smoothed with an 8 mm full-width at half-maximum Gaussian kernel. Total intracranial volume (TIV) was calculated for each participant.
Statistical analysis
Demographic and clinical data were analyzed using SPSS 25.0. Continuous variables were compared using independent t-tests or Mann–Whitney U-tests, as appropriate. Categorical variables were compared using chi-square tests.
VBM
A whole-brain VBM analysis comparing GMV between OCD patients and HCs was performed in SPM12. Age, gender, and TIV were included as covariates. An absolute threshold mask of 0.2 was applied. Results were considered significant at a voxel-level threshold of p < 0.001 uncorrected, combined with a cluster-level family-wise error (FWE) correction of p < 0.05 and a cluster extent of >20 voxels. The anatomical labels for the significant peak MNI coordinates were determined using the Automated Anatomical Labeling version 3 (AAL3) atlas.
Seed-based SCN analysis
Brain regions showing significant GMV differences in the VBM analysis were used as seeds for SCN analysis, performed using the Brain Covariance Connectivity Toolkit (BCCT_V2.1, https://github.com/JLhos-fmri/BrainCovarianceConnectToolkitV2.1) (Xu et al., Reference Xu, Zhang, Liu, Dai, Xie, Hao, Yu, Liu, Zhang, Ye, Qi, Zhang, Zhang and Lu2021). For each group, a seed-based SCN map was created by computing Pearson’s correlation between the seed region’s GMV and the GMV of every other voxel in the brain, using the AAL3 atlas. To test group differences in structural covariance patterns, voxelwise general linear models (GLMs) were fitted with the following specification:

where Vi denotes the GMV at voxel i, Group is a binary indicator, Vseed is the subject-specific GMV of the seed region, and β3 represents the interaction term that tests whether group moderates the seed-target structural covariance. Age, gender, and TIV were included as covariates (β4–β6). All statistical tests were two-tailed. Multiple comparisons were controlled using Gaussian Random Field (GRF) theory with a voxel-level threshold of p < 0.001 (uncorrected) and a cluster-level threshold of p < 0.05.
Modulation analysis of SCN by cognitive fusion
To investigate the specific modulatory effect of CF on brain structural networks in OCD, we performed a seed-based modulation analysis of the structural covariance network (MOD-SCN) within the OCD cohort. The model was designed to test whether CF modulates the morphological association between a seed region and target regions. To dissociate the unique contribution of CF from general psychopathology, baseline symptom scores (Y-BOCS total, BDI, and BAI) were included as nuisance covariates. A voxelwise GLM was specified as follows:

where Vi denotes the GMV at voxel i, β0 is the intercept, β1 is the main effect of CF, β2 indexes the baseline structural covariance between the seed GMV and target GMV, and β3 is the interaction term of interest that tests whether CF moderates the seed-target structural covariance. Age, gender, and TIV (β4–β6) and baseline clinical scores (Y-BOCS, BDI, BAI; β7–β9) were included as covariates of no interest. The primary statistical inference targeted the interaction coefficient β3.
Voxelwise inference on β3 was conducted using two-tailed t-tests. Multiple comparisons were controlled using a cluster-level FWE correction: voxelwise threshold p < 0.001 (uncorrected) combined with cluster-level p < 0.05 (FWE-corrected), with a minimum cluster extent of k > 20 to exclude very small clusters. Clusters showing significant positive or negative modulation by CF were defined as GMV in CF-modulated SCN key nodes; mean GMV values were extracted from these clusters for each subject and used as regions of interest (ROIs) in subsequent correlation, regression, or predictive analyses.
Treatment-response prediction analysis
Baseline GMV values were extracted from the key nodes identified above. Pearson correlation coefficients were first computed between each node’s baseline GMV and the CF reduction rate at 8 weeks. If a significant correlation was observed, hierarchical multiple linear regression was performed to further evaluate predictive power and specificity. In Model 1, with CF reduction rate as the dependent variable, the first block included demographic and clinical covariates: age, gender, years of education, illness duration, TIV, baseline Y-BOCS, baseline anxiety and depression scores, medication dose (fluoxetine-equivalent), and baseline seed-region GMV. Inclusion of seed-region GMV aims to demonstrate that predictive power does not simply arise from the seed’s baseline volume at the circuit level. Model 2 added the baseline GMV of the identified key node (Enter Method) on top of Model 1 to test its independent predictive contribution to CF improvement after adjusting for the above factors. Model 3 further included the 8-week Y-BOCS reduction rate on top of Model 2. This step is intended to verify whether the regional structural marker specifically predicts improvement in CF rather than merely reflecting concurrent global improvement in obsessive-compulsive symptoms.
Gene association analysis
The Brain Annotation Toolbox (BAT v1.1) (https://istbi.fudan.edu.cn/lnen/info/1173/1788.htm) was used to explore the transcriptomic profiles associated with the key brain regions identified above (Li et al., Reference Li, Lin, Ren, Cheng, Zhang and Han2024). Gene expression data were sourced from the AHBA (Hawrylycz et al., Reference Hawrylycz, Lein, Guillozet-Bongaarts, Shen, Ng, Miller, van de Lagemaat, Smith, Ebbert, Riley, Abajian, Beckmann, Bernard, Bertagnolli, Boe, Cartagena, Chakravarty, Chapin, Chong and Jones2012). Analysis was primarily focused on the left hemisphere due to limited right-hemisphere donor samples in the AHBA (Arnatkeviciute et al., Reference Arnatkeviciute, Fulcher and Fornito2019). Parameters were set to a 6-mm region-of-interest radius, a minimum of 5 samples per ROI, and 5000 permutations for inference p < 0.05 (FWE-corrected). Significant genes were uploaded to the Database for Annotation, Visualization, and Integrated Discovery (DAVID; https://davidbioinformatics.nih.gov/) database for functional enrichment analysis based on Kyoto Encyclopedia of Genes and Genomes (KEGG) pathways and Gene Ontology (GO) terms (Biological Process [BP], Cellular Component [CC], and Molecular Function [MF]), using a significance threshold of p < 0.05 (false discovery rate [FDR]-corrected).
Results
Baseline demographic and clinical characteristics
Following strict quality control, 75 patients with OCD and 66 HCs were ultimately included in the analyses. The two groups were well-matched in age, gender, years of education, and TIV, with no significant differences (p > 0.05). Clinically, the OCD group scored significantly higher on the CFQ than the HCs group (p < 0.001), indicating pronounced CF deficits in patients. Detailed demographic and clinical characteristics are presented in Table 1.
Demographic and clinical characteristics of OCD patients and HCs

Table 1. Long description
The table consists of five columns: Variables, O C D (n = 75), H Cs (n = 66), t/Z/chi-squared, and P.
* Age (years): O C D 24.45 plus or minus 6.62; H Cs 24.74 plus or minus 3.93; t/Z/chi-squared -1.581; P 0.114.
* Gender (female, %): O C D 33 (44.00%); H Cs 31 (53.03%); t/Z/chi-squared 1.147; P 0.284.
* Education (years): O C D 13.43 plus or minus 2.46; H Cs 13.56 plus or minus 3.38; t/Z/chi-squared -1.299; P 0.194.
* Duration of illness (months): O C D 13.45 plus or minus 13.89; H Cs not applicable.
* Y-B O C S: O C D 23.36 plus or minus 4.31; H Cs not applicable.
* B D I: O C D 4.54 plus or minus 2.70; H Cs not applicable.
* B A I: O C D 35.53 plus or minus 10.09; H Cs not applicable.
* C F Q: O C D 44.36 plus or minus 9.99; H Cs 24.77 plus or minus 11.07; t/Z/chi-squared -8.278; P less than 0.001.
* T I V: O C D 1479.07 plus or minus 136.83; H Cs 1519.10 plus or minus 138.74; t/Z/chi-squared -1.722; P 0.087.
Note: O C D is Obsessive-Compulsive Disorder; H Cs is Healthy Controls; Y-B O C S is Yale-Brown Obsessive Compulsive Scale; B D I is Beck Depression Inventory; B A I is Beck Anxiety Inventory; C F Q is Cognitive Fusion Questionnaire; T I V is Total Intracranial Volume.
Note: OCD, obsessive-compulsive disorder; HCs, healthy controls; Y-BOCS, Yale-Brown Obsessive Compulsive Scale; BDI, Beck Depression Inventory; BAI, Beck Anxiety Inventory; CFQ, Cognitive Fusion Questionnaire; TIV, Total Intracranial Volume. Bold value indicates statistical significance.
Clinical outcomes after 8 weeks of pharmacotherapy
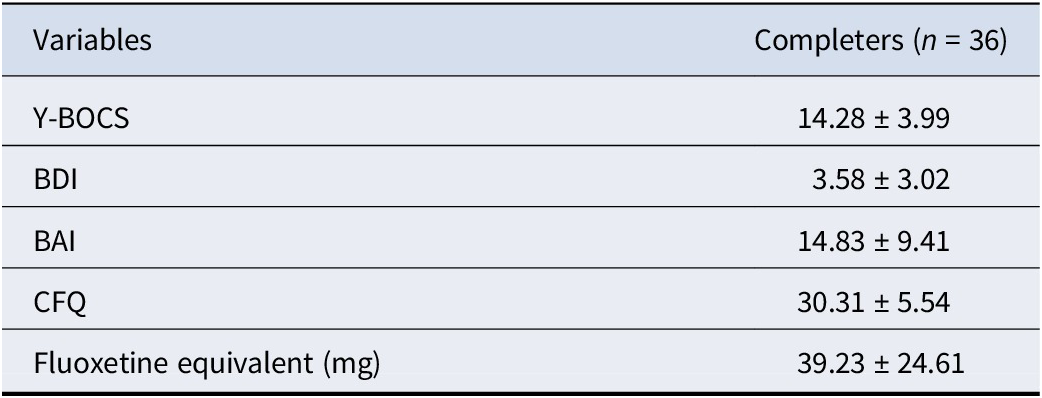
Thirty-six patients completed the 8-week follow-up and clinical reassessment. Medication distribution among completers was as follows: sertraline (n = 14), fluvoxamine (n = 14), paroxetine (n = 4), escitalopram (n = 3), and fluoxetine (n = 1). Completers and noncompleters did not differ significantly in baseline demographic or clinical features (p > 0.05). The completer group had a mean age of 24.03 ± 6.97 years (20 males and 16 females). A comparison of baseline characteristics between completers and noncompleters is shown in Table 2. After treatment, patients showed significant clinical improvement. CFQ scores decreased significantly from baseline to 30.31 ± 5.54, and reductions were also observed in Y-BOCS, BDI, and BAI scores. Post-treatment clinical data are detailed in Table 3.
Demographic and clinical characteristics by follow-up completion status

Table 2. Long description
The table consists of five columns: Variables, Completers (n = 36), Noncompleters (n = 39), t/Z/chi-squared, and P.
* Age (years): Completers 24.03 plus or minus 6.97; Noncompleters 24.85 plus or minus 6.35; t/Z/chi-squared -0.860; P 0.390.
* Gender (female, %): Completers 16 (44.44%); Noncompleters 17 (43.59%); t/Z/chi-squared 0.006; P 0.941.
* Education (years): Completers 13.25 plus or minus 2.49; Noncompleters 13.59 plus or minus 2.45; t/Z/chi-squared -0.850; P 0.395.
* Duration of illness (months): Completers 15.25 plus or minus 14.99; Noncompleters 11.79 plus or minus 12.77; t/Z/chi-squared -0.867; P 0.386.
* Y B O C S: Completers 22.94 plus or minus 4.19; Noncompleters 23.74 plus or minus 4.44; t/Z/chi-squared -0.682; P 0.495.
* B D I: Completers 4.28 plus or minus 2.50; Noncompleters 4.85 plus or minus 2.88; t/Z/chi-squared -0.637; P 0.524.
* B A I: Completers 34.89 plus or minus 9.88; Noncompleters 36.13 plus or minus 10.38; t/Z/chi-squared -0.414; P 0.679.
* C F Q: Completers 44.31 plus or minus 9.43; Noncompleters 44.41 plus or minus 10.60; t/Z/chi-squared -0.191; P 0.848.
* T I V: Completers 1501.09 plus or minus 154.91; Noncompleters 1458.74 plus or minus 116.07; t/Z/chi-squared 1.347; P 0.182.
Note: Y-BOCS, Yale-Brown Obsessive Compulsive Scale; BDI, Beck Depression Inventory; BAI, Beck Anxiety Inventory; CFQ, Cognitive Fusion Questionnaire; TIV, Total Intracranial Volume.
Clinical outcomes at 8-week follow-up

Table 3. Long description
The table consists of two columns: Variables and Completers (n = 36). The data is presented as mean plus or minus standard deviation.
* Y B O C S: 14.28 plus or minus 3.99.
* B D I: 3.58 plus or minus 3.02.
* B A I: 14.83 plus or minus 9.41.
* C F Q: 30.31 plus or minus 5.54.
* Fluoxetine equivalent (mg): 39.23 plus or minus 24.61.
Note: Y B O C S refers to Yale-Brown Obsessive Compulsive Scale, B D I refers to Beck Depression Inventory, B A I refers to Beck Anxiety Inventory, and C F Q refers to Cognitive Fusion Questionnaire.
Note: Y-BOCS, Yale-Brown Obsessive Compulsive Scale; BDI, Beck Depression Inventory; BAI, Beck Anxiety Inventory; CFQ, Cognitive Fusion Questionnaire.
Group differences in GMV
Whole-brain VBM analysis, controlling for age, gender, and TIV, revealed widespread GMV abnormalities in OCD patients compared to HCs. The OCD group exhibited significantly increased GMV in the right triangular part of the inferior frontal gyrus (p < 0.05, FWE-corrected) and the left angular gyrus (p < 0.01, FWE-corrected). Conversely, significant GMV reductions were found in the left middle temporal gyrus, left medial superior frontal gyrus, right SFGdl, and the right anterior cingulate/paracingulate gyri (all p < 0.05, FWE-corrected). Detailed statistical values and MNI coordinates are listed in Table 4 and illustrated in Figure 1.
Gray matter volume analysis results between OCD group and HCs

Table 4. Long description
The table contains seven columns: Brain region, Cluster size in voxels, Peak M N I coordinates (x, y, z), t-value, and p F W E.
Results for O C D greater than H C s:
* Right inferior frontal gyrus, triangular part: Cluster size 217, M N I (44, 17, 30), t 4.81, p 0.035.
* Left inferior parietal angular gyrus: Cluster size 370, M N I (-35, -36, 63), t 4.45, p 0.002.
Results for O C D less than H C s:
* Left middle temporal gyrus: Two clusters. First: size 215, M N I (-53, -62, 0), t -4.40, p 0.036. Second: size 353, M N I (-50, -18, -18), t -4.02, p 0.003.
* Left medial superior frontal gyrus: Two clusters. First: size 357, M N I (-11, 57, 9), t -4.16, p 0.002. Second: size 902, M N I (-14, 71, 15), t -3.99, p less than 0.001.
* Right dorsolateral superior frontal gyrus: Cluster size 214, M N I (14, 42, 29), t -3.81, p 0.037.
* Right medial and paracingulate gyrus: Cluster size 245, M N I (11, 0, 35), t -3.74, p 0.020.
Note: O C D stands for obsessive-compulsive disorder; H C s stands for healthy controls; M N I stands for Montreal Neurological Institute.
Note: OCD, obsessive-compulsive disorder; HCs, healthy controls; MNI, Montreal Neurological Institute. Bold value indicates statistical significance.
Comparison of gray matter volume differences between OCD patients and healthy controls. Red regions represent brain areas with significantly increased gray matter volume in the OCD group, while blue regions represent areas with significantly decreased gray matter volume. The color bar indicates t-statistical values for between-group comparisons. OCD: obsessive-compulsive disorder patients; HC: healthy control.

Figure 1. Long description
The figure displays axial, coronal, and sagittal brain slices comparing gray matter volume. The top section, labeled “OCD > HC,” highlights specific brain regions in red, indicating significantly increased gray matter volume in the OCD group, such as the right inferior frontal gyrus and left inferior parietal angular gyrus. The bottom section, labeled “HC > OCD,” highlights regions in blue, indicating significantly decreased gray matter volume in the OCD group, such as the left middle temporal gyrus and left medial superior frontal gyrus. A color bar indicates t-statistical values.
Alterations in SCN
Seed-based SCN analysis, using the VBM-derived regions as seeds, demonstrated significant alterations in structural network connectivity in OCD. After controlling for confounders, 28 structural covariance connections showed significant between-group differences (p < 0.05, GRF-corrected). Notably, the OCD group predominantly exhibited enhanced structural covariance strength. For instance, using the left angular gyrus as a seed, its connections with the right lingual gyrus, left medial orbitofrontal cortex, and left triangular part of the inferior frontal gyrus were significantly stronger. When seeding from the left middle temporal gyrus, its widespread connectivity with frontal regions (e.g. inferior frontal gyrus and medial superior frontal gyrus), cerebellar areas (lobules 9 and 7b), and the somatosensory cortex (postcentral gyrus) was significantly enhanced in patients. A comprehensive list of altered network connections is provided in Supplementary Table S1 and visualized in Figure 2.
Chord diagram and brain map showing differences in structural covariance connectivity between the OCD group and HCs. The diagram displays 28 structural covariance connections with significant differences (p < 0.05, GRF corrected). Left panel: Colored nodes represent seed regions, gray nodes represent target regions, and connecting lines match the colors of their corresponding seed regions. Right panel: Red nodes represent target regions, while other colored nodes represent seed regions. All connections shown reflect enhanced structural covariance in OCD patients compared to HCs. OCD, obsessive-compulsive disorder; HCs, healthy controls.

Figure 2. Long description
The image contains two panels showing enhanced structural covariance in OCD patients compared to healthy controls. The left panel is a circular chord diagram where colored nodes represent seed brain regions, gray nodes represent target regions, and connecting lines match the colors of their corresponding seed regions. The right panel is an axial view of a 3D brain showing the same network in anatomical space, where red nodes represent target regions and other colored nodes represent seed regions connected by lines.
Modulatory effect of CF on structural covariance in OCD
Modulation analysis revealed a significant positive moderating effect of CF scores on specific structural networks. Specifically, CF scores significantly moderated the structural covariance, with higher scores being associated with stronger covariance between the left angular gyrus and the right middle temporal gyrus (p < 0.001, FWE-corrected), right cerebellar lobule VIII (p < 0.05, FWE-corrected), and the right medial superior frontal gyrus (p < 0.01, FWE-corrected). Furthermore, CF positively modulated the connectivity between the right medial/paracingulate gyri and the left supplementary motor area (p < 0.05, FWE-corrected), as well as the left SFGdl (p < 0.05, FWE-corrected). This indicates that patients with higher levels of CF exhibited greater structural synchrony between these brain regions. Detailed results of the modulation analysis are presented in Table 5 and Figure 3.
Modulation analysis of structural covariance network analysis results

Table 5. Long description
The table contains eight columns: Seed region, Brain region, Cluster size in voxels, Peak M N I coordinates (divided into x, y, and z), t-value, and p sub F W E.
* For the seed region Left inferior parietal angular gyrus:
- Right middle temporal gyrus: 1379 voxels, M N I (63, -56, 4), t 4.79, p < 0.001.
- Right middle temporal gyrus (second cluster): 733 voxels, M N I (58, -4, -22), t 4.21, p 0.012.
- Right cerebellum lobule V I I I: 572 voxels, M N I (21, -56, -46), t 4.56, p 0.033.
- Right medial superior frontal gyrus: 794 voxels, M N I (9, 33, 50), t 4.32, p 0.008.
* For the seed region Right medial and paracingulate gyrus:
- Left supplementary motor area: 637 voxels, M N I (-4, -6, 74), t 4.25, p 0.030.
- Left dorsolateral superior frontal gyrus: 670 voxels, M N I (-16, 21, 42), t 3.94, p 0.024.
Note: M N I stands for Montreal Neurological Institute.
Note: MNI, Montreal Neurological Institute. Bold value indicates statistical significance.
Chord plot and brain map showing cognitive fusion-modulated structural covariance networks in the OCD group. Six structural covariance connections significantly modulated by cognitive fusion are illustrated (p < 0.05, FWE corrected). Left: Colored nodes indicate seed brain regions, gray nodes indicate target brain regions, and connection lines are color-coded to match their respective seed regions. Right: Red nodes denote target brain regions, while remaining colored nodes denote seed brain regions. All depicted connections represent positive regulatory effects of cognitive fusion on structural covariance in OCD patients.

Figure 3. Long description
The image contains two panels showing the positive regulatory effects of cognitive fusion on structural covariance in OCD patients. The left panel is a chord diagram where colored nodes indicate seed brain regions, gray nodes indicate target brain regions, and connection lines match their respective seed regions. The right panel is a 3D brain map displaying the same six connections, with red nodes denoting target brain regions and remaining colored nodes denoting seed brain regions.
Prediction of treatment response by brain structural features
Pearson correlation analysis showed that the percentage reduction in CF scores after 8 weeks of treatment was significantly positively correlated with baseline GMV in the right cerebellum lobule VIII (r = 0.407, p = 0.014), the right medial superior frontal gyrus (r = 0.353, p = 0.035), and the left SFGdl (r = 0.576, p < 0.001) (Figure 4). Subsequent hierarchical linear regression analysis demonstrated that Model 1, which included only demographic and clinical variables, did not yield any significant predictors. Model 2, which added baseline GMV of the left SFGdl, showed a significant increase in explanatory power. GMV in this region was a significant positive predictor of CF reduction (β = 0.672, p = 0.001). Interestingly, in this model, illness duration also emerged as a significant negative predictor (β = −0.434, p = 0.024), demonstrating a statistical suppression effect. In Model 3, after further controlling for the percentage reduction in Y-BOCS scores at week 8, the predictive effect of left SFGdl GMV on CF reduction remained significant (β = 0.683, p = 0.001). This suggests that the structural integrity of this region is a specific predictor of CF improvement, independent of the overall alleviation of obsessive-compulsive symptoms. Detailed regression results are shown in Supplementary Tables S2–S4.
Scatter plot showing the correlation between baseline gray matter volume and cognitive fusion improvement rate after 8 weeks of treatment. The x-axis represents extracted gray matter volume values of key network nodes modulated by cognitive fusion at baseline, and the y-axis represents the cognitive fusion reduction rate after 8 weeks of treatment.

Figure 4. Long description
The figure consists of six scatter plots labeled A through F with trend lines. In all plots, the x-axis represents baseline gray matter volume of specific network nodes modulated by cognitive fusion, and the y-axis represents the cognitive fusion reduction rate. Plots C (Right cerebellum lobule VIII), D (Right medial superior frontal gyrus), and F (Left dorsolateral superior frontal gyrus) show an upward-sloping trend line, indicating statistically significant positive correlations. Plot F shows the strongest positive correlation with r = 0.576 and p < 0.001.
Transcriptomic association analysis
Gene association analysis based on the AHBA identified 2,777 genes whose spatial expression patterns were significantly correlated with the GMV map of the left SFGdl. Functional enrichment analysis revealed that among KEGG pathways, these genes were significantly enriched in pathways closely related to neurotransmission and synaptic plasticity, including the ‘Oxytocin signaling pathway’, ‘Calcium signaling pathway’, ‘Glutamatergic synapse’, and ‘Neuroactive ligand-receptor interaction’. For GO terms, enrichment was observed for ‘chemical synaptic transmission’ in BP, ‘glutamatergic synapse’ in CC, and ‘protein binding’ in MF. Detailed enrichment results are presented in Figure 5.
Gene enrichment analysis results spatially correlated with left dorsolateral superior frontal gyrus gray matter volume. The left bubble plot shows KEGG pathway enrichment results, while the right bar chart displays GO ontology enrichment results.

Figure 5. Long description
The image contains two panels. The left panel is a bubble plot showing the top 10 significant KEGG pathways, with “Neuroactive ligand-receptor interaction” and “Glutamatergic synapse” prominent. Bubble size represents gene count, and color represents the log10(P-value). The right panel is a horizontal bar chart showing Gene Ontology enrichment, categorized into Biological Process, Cellular Component, and Molecular Function. Key enriched terms include “chemical synaptic transmission,” “glutamatergic synapse,” and “protein binding.”
Discussion
This study investigated the neuroanatomical basis of CF in first-episode, drug-naïve OCD patients using a multimodal approach combining VBM, SCN analysis, and spatial transcriptomics. Our principal findings were: (1) OCD patients exhibited widespread GMV abnormalities, including reductions in frontal-limbic regions and increases in parietal and inferior frontal areas; (2) structural covariance within fronto-parieto-cerebellar circuits was significantly enhanced in OCD; (3) CF levels were positively associated with variations in the strength of structural covariance between the left angular gyrus and several frontal control regions as well as the cerebellum; (4) baseline GMV in the left SFGdl independently predicted the rate of CF improvement following pharmacotherapy; and (5) spatial transcriptomic analysis linked the structural signature of the left SFGdl to the expression of genes enriched in pathways such as glutamatergic synapse and oxytocin signaling.
Gray matter volume alterations in OCD
Our VBM results revealed extensive GMV abnormalities in first-episode OCD, supporting not only the classic CSTC circuit hypothesis but also implicating broader cortical networks involving parietal and temporal lobes. We observed significant GMV reductions in the right anterior cingulate/paracingulate gyri, left medial superior frontal gyrus, and right SFGdl. This aligns with consistent evidence pointing to structural deficits within the frontal-limbic system as a core pathological feature of adult OCD. For instance, Pujol et al. (Reference Pujol, Soriano-Mas, Alonso, Cardoner, Menchón, Deus and Vallejo2004) and a recent coordinate-based meta-analysis by Del Casale et al. (Reference Del Casale, Ferracuti, Mancino, Arena, Bilotta, Alcibiade, Romano, Bozzao and Pompili2024) identified volume reductions in the medial frontal and anterior cingulate cortices as among the most robust cortical findings in adult OCD. The pathophysiology underlying this atrophy may involve neurodegenerative processes or aberrant synaptic pruning associated with chronicity. Functionally, these regions are crucial for executive control and conflict monitoring; their structural compromise may underlie impairments in fear extinction, cognitive inflexibility, and inhibitory control over compulsion (Del Casale et al., Reference Del Casale, Ferracuti, Mancino, Arena, Bilotta, Alcibiade, Romano, Bozzao and Pompili2024; Pujol et al., Reference Pujol, Soriano-Mas, Alonso, Cardoner, Menchón, Deus and Vallejo2004).
Beyond classic frontal regions, we found GMV reduction in the left middle temporal gyrus, supporting the view that OCD pathophysiology extends beyond the CSTC circuit. This finding is consistent with reports, including a meta-analysis by Hu et al. (Reference Hu, Du, Chen, Li, Zhou, Zhang, Liu, Lu, Mreedha, Huang and Gong2017), suggesting temporal-insular abnormalities are more prominent in drug-naïve adult patients. Structural impairment in this DMN node may relate to memory encoding deficits and abnormal introspective processes, such as rumination on obsessive thoughts (Tian et al., Reference Tian, Shi, Tao, Yang, Guo, Wen, Wei, Chen, Zhang, Cheng and Han2025).
Notably, contrasting with frontal and temporal atrophy, we found GMV increases in the left angular gyrus and the right triangular part of the inferior frontal gyrus. While early studies reported parietal reductions (Valente et al., Reference Valente, Miguel, Castro, Amaro, Duran, Buchpiguel, Chitnis, McGuire and Busatto2005), recent meta-analyses, including that by Del Casale et al. (Reference Del Casale, Ferracuti, Mancino, Arena, Bilotta, Alcibiade, Romano, Bozzao and Pompili2024), have documented GMV increases in the left parietal cortex in adult OCD. The angular gyrus, a DMN hub involved in self-referential processing and attentional reorienting, may undergo compensatory neuroplastic changes (Menzies et al., Reference Menzies, Chamberlain, Laird, Thelen, Sahakian and Bullmore2008; Szeszko et al., Reference Szeszko, MacMillan, McMeniman, Chen, Baribault, Lim, Ivey, Rose, Banerjee, Bhandari, Moore and Rosenberg2004). We speculate that its increased volume might reflect a structural adaptation to the chronic need for patients to excessively mobilize posterior attentional and DMN resources to manage intrusive thoughts and attentional fixation. Similarly, enlargement of the right inferior frontal gyrus, a key node for inhibitory control, could represent a compensatory mechanism stemming from persistent efforts to suppress compulsive urges.
In summary, our findings suggest a spatially specific pattern of neuroanatomical remodeling in OCD: regions responsible for top-down control show structural deficits, while areas involved in self-referential processing and inhibitory control exhibit compensatory enhancement.
Alterations in structural covariance networks
Our SCN analysis revealed abnormal co-developmental patterns in OCD, characterized by widespread enhancement of structural covariance, particularly between the left angular gyrus/middle temporal gyrus and the frontal/cerebellar regions. This heightened anatomical coupling suggests excessive morphological integration between specific brain networks in OCD.
The enhanced covariance between the left angular gyrus and frontal regions (e.g. inferior frontal gyrus and orbitofrontal cortex) aligns with findings from Subirà et al. (Reference Subirà, Cano, de Wit, Alonso, Cardoner, Hoexter, Kwon, Nakamae, Lochner, Sato, Jung, Narumoto, Stein, Pujol, Mataix-Cols, Veltman, Menchón, van den Heuvel and Soriano-Mas2016), who reported increased striatal-inferior frontal covariation in OCD. From a neurodevelopmental perspective, structural covariance reflects shared trophic influences or synchronized synaptic pruning (Alexander-Bloch et al., Reference Alexander-Bloch, Giedd and Bullmore2013). The enhanced coupling between a core DMN node (angular gyrus) and regions central to cognitive control may indicate suboptimal network segregation during development. This is supported by graph theory analyses from the ENIGMA consortium, which found reduced clustering and modularity in OCD structural networks, suggesting insufficient differentiation (Yun et al., Reference Yun, Boedhoe, Vriend, Jahanshad, Abe, Ameis, Anticevic, Arnold, Batistuzzo, Benedetti, Beucke, Bollettini, Bose, Brem, Calvo, Cheng, Cho, Ciullo, Dallaspezia and Kwon2020). Thus, the increased structural coupling we observed may form the anatomical basis for difficulties in flexibly shifting between self-referential thought and goal-directed behavior.
Furthermore, we found extensive abnormal covariance involving the cerebellum (lobules 9 and 7b) with cortical regions. Growing evidence implicates cerebello-cortical circuits in psychopathology. Our findings of enhanced temporal/frontal-cerebellar volume synchronization resonate with the dysmetria of thought theory, which posits that the cerebellum regulates the accuracy and fluidity of cognitive and affective processes via connections with prefrontal and association cortices (Schmahmann, Guell, Stoodley, & Halko, Reference Schmahmann, Guell, Stoodley and Halko2019). The observed hyper-integration may reflect an overly stable anatomical substrate that underpins the difficulty in inhibiting repetitive thoughts or behaviors in OCD.
Notably, our finding of widespread GMV covariance enhancement contrasts with a study by Reess et al. (Reference Reess, Rus, Gürsel, Schmitz-Koep, Wagner, Berberich and Koch2018), which reported reduced connectivity in a gyrification-based SCN. This discrepancy may reflect the differential sensitivity of morphological metrics to developmental timing. While cortical folding is largely determined prenatally, GMV changes are more influenced by postnatal processes like synaptic pruning and myelination. Therefore, our GMV-based findings may specifically indicate aberrant synchronization of late cortical maturation, where functional modules that should develop independently retain excessive morphological links.
Collectively, our SCN results demonstrate abnormal structural network organization in OCD, characterized by hyper-integration within a fronto-parieto-temporo-cerebellar circuit. This supports the expansion from a CSTC-centric model to a whole-brain network perspective and underscores a pathological mechanism of ‘over-integration and under-differentiation’.
Modulation of structural covariance networks by cognitive fusion
Our analyses revealed that CF scores in OCD patients significantly moderated the strength of structural covariance between specific brain regions. Higher CF levels were associated with stronger anatomical coupling between the left angular gyrus and the right middle temporal gyrus, right cerebellar lobule VIII, and right medial superior frontal gyrus. Enhanced covariance was also observed between the right anterior cingulate/paracingulate gyri and both the left supplementary motor area and the left SFGdl. This pattern suggests that under conditions of heightened CF, the anatomical integration between key nodes of the DMN (e.g. the angular gyrus) and regions central to the executive control network (e.g. SFGdl and supplementary motor area) is strengthened. This structural finding aligns with and extends our prior functional MRI results from an overlapping sample (Suo et al., Reference Suo, Zhang, Li, Xu, Zeng, Lei, Zhang, Luo, Xia, Zeng and Hu2026). Together, these observations suggest that CF may be linked to a state of functional compensation within prefrontal circuits – perhaps reflecting persistent efforts to counteract intrusive thoughts – and that sustained functional demand may be associated with neuroplastic changes reflected in the enhanced structural covariance observed here. This interpretation is consistent with recent task-based fMRI studies investigating cognitive inflexibility in OCD, which have reported abnormal hyperconnectivity between frontoparietal and DMN regions during task-switching, indicating impaired coordination between these networks (Liu et al., Reference Liu, Gao, Wang, Xia, Yuan, Zheng, Zhong and Zhu2023). Furthermore, intervention studies such as that by Lee et al. (Reference Lee, Kim, Lee, Seo, Cha, Chang and Lee2024) demonstrated that successful ACT, which targets CF, leads to functional connectivity reorganization between the insula and inferior frontal gyrus. Our findings provide a complementary neuroanatomical perspective, positing that CF, as a core psychopathological mechanism, may be associated with stronger anatomical ties between specific brain regions, thereby reducing necessary network differentiation and contributing to the difficulty in disengaging from intrusive cognitions.
From a transdiagnostic viewpoint, the structural network alterations observed here show intriguing convergence with mechanisms underlying cognitive rigidity in autism spectrum disorder (ASD), hinting at shared neurobiological substrates across neuropsychiatric conditions. For instance, Watanabe, Lawson, Walldén, & Rees (Reference Watanabe, Lawson, Walldén and Rees2019) identified posterior parietal cortex structure as a key anatomical substrate linking perceptual overstability to cognitive rigidity in autism. Similarly, Seng et al. (Reference Seng, Lai, Goh, Tseng and Gau2022) reported that gray matter alterations in parietal and cerebellar regions in ASD youth were associated with insistence on sameness, a higher-order repetitive behavior. Although OCD and ASD are distinct clinical entities, they exhibit phenotypic overlap in cognitive inflexibility and perseverative thinking. The enhanced structural coupling between the angular gyrus and frontal/cerebellar regions observed in our OCD sample may represent a disorder-specific manifestation of a transdiagnostic mechanism, whereby excessive integration of structural brain networks constrains the flexible switching of mental content.
Association of left SFGdl with treatment response
A pivotal longitudinal finding was that baseline GMV in the left SFGdl significantly predicted the degree of CF improvement following 8 weeks of pharmacotherapy. The reduction in CF scores was positively correlated with pretreatment GMV in this region. Crucially, hierarchical regression confirmed that the left SFGdl GMV remained an independent positive predictor of CF improvement rate even after controlling for demographic variables and the degree of overall symptom reduction (β = 0.683, p = 0.001). This indicates that the structural integrity of this region may serve as a specific biomarker for CF change, rather than merely reflecting global clinical improvement.
This finding carries potential clinical significance. The left SFGdl is a core hub for executive function and cognitive control. Patients with greater structural integrity in this region may possess a superior neurocognitive reserve, enabling them to more effectively recruit prefrontal control resources during treatment to challenge obsessive thoughts, thereby facilitating cognitive defusion. This parallels the classic finding by Hoexter et al. (Reference Hoexter, Dougherty, Shavitt, D’Alcante, Duran, Lopes, Diniz, Batistuzzo, Evans, Bressan, Busatto and Miguel2013), where larger medial prefrontal volume predicted better response to cognitive-behavioral therapy in OCD, interpreted as reflecting a greater capacity for extinction learning. Conversely, patients with more pronounced atrophy in this region may face neuroanatomical constraints that limit the efficacy of pharmacotherapy in reshaping maladaptive cognitive patterns. Furthermore, the additional finding that longer illness duration negatively predicted CF improvement (β = −0.434, p = 0.024) suggests that chronicity may lead to a crystallization of these cognitive patterns, attenuating subsequent therapeutic effects on CF.
Transcriptomic associations of the left SFGdl
Leveraging the AHBA, we linked our macroscopic neuroimaging findings to microscale transcriptomic features to explore the normative molecular context associated with regional susceptibility to structural alterations in OCD. Spatial correlation analysis revealed that the GMV pattern of the left SFGdl was significantly associated with the spatial expression distribution of specific gene sets. Functional enrichment analysis indicated these genes were primarily involved in biological processes such as ‘glutamatergic synapse’, ‘calcium signaling pathway’, and ‘oxytocin signaling pathway’.
The enrichment for glutamatergic synaptic genes is a salient finding that aligns strongly with the glutamate hypothesis of OCD. Glutamate, the primary excitatory neurotransmitter, is critical for synaptic plasticity, neuronal growth, and pruning. Large-scale genetic studies have identified glutamatergic signaling as a key functional module harboring OCD risk genes (International Obsessive Compulsive Disorder Foundation Genetics Collaborative [IOCDF-GC] and OCD Collaborative Genetics Association Studies [OCGAS], 2018). Our finding that the spatial expression of glutamatergic genes overlap with the GMV signature of the left SFGdl suggests that brain regions normally enriched for glutamatergic functioning may be particularly vulnerable to pathophysiological processes such as excitotoxicity or aberrant synaptic pruning, thereby contributing to prefrontal GMV abnormalities.
The significant enrichment of calcium signaling pathway genes is also noteworthy. Calcium ions act as pivotal second messengers in neurotransmitter release, synaptic plasticity, and neuronal survival. Genetic variations in voltage-gated calcium channel genes are shared risk factors across multiple psychiatric disorders, including OCD (Cross-Disorder Group of the Psychiatric Genomics Consortium, 2013; Kapur, Phillips, & Insel, Reference Kapur, Phillips and Insel2012). Dysregulation of calcium signaling could disrupt neuronal calcium homeostasis, thereby impairing neuroplasticity mechanisms such as long-term potentiation. In the context of OCD, such impairment in plasticity might underlie the pathological reinforcement of neural circuits or the difficulty in extinguishing maladaptive thought patterns, as suggested by our correlation between left SFGdl structure and CF.
Finally, the enrichment of the oxytocin signaling pathway offers a novel perspective on the social-cognitive dimensions often affected in OCD. Oxytocin modulates social behavior and attachment and has documented anxiolytic and stress-buffering effects. Research has shown altered oxytocin levels in OCD patients (Humble, Uvnäs-Moberg, Engström, & Bejerot, Reference Humble, Uvnäs-Moberg, Engström and Bejerot2013), and animal models confirm that oxytocin receptor activation in the medial prefrontal cortex reduces anxiety-like behaviors (Sabihi, Durosko, Dong, & Leuner, Reference Sabihi, Durosko, Dong and Leuner2014). Our discovery implies that structural alterations in the prefrontal cortex may be linked to dysregulation within the oxytocin system, potentially explaining anomalous responses to socio-emotional information in OCD.
In summary, our transcriptomic analysis indicates that the GMV alterations in the left SFGdl in OCD are spatially coupled with the expression of genes involved in specific molecular pathways governing excitatory neurotransmission, synaptic plasticity, and neuropeptide modulation. This convergence provides crucial biological context and may inform future therapeutic strategies targeting glutamate or calcium channels.
Limitations
Several limitations of this study warrant consideration. First, the substantial attrition rate during the 8-week follow-up necessitates a cautious interpretation of the treatment response prediction model. Although baseline demographic and clinical features did not differ significantly between completers and noncompleters, this high dropout likely reflects the specific clinical reality of our cohort. Given that all enrolled patients were first-episode and drug-naïve, they are generally more susceptible to the initial, transient adverse effects of SSRIs, which often precipitate premature discontinuation. Coupled with this, the core psychopathology of OCD – characterized by pathological doubt, overestimation of threat, and intolerance of uncertainty – frequently translates into poor medication adherence. Such patients may experience obsessive fears regarding pharmacological interventions or early skepticism toward the treatment, leading to study withdrawal before symptomatic relief is achieved. Consequently, the reduced sample size may limit the statistical power of the predictive model. Second, the absence of post-treatment neuroimaging data precludes establishing a causal direction between CF and structural remodeling, necessitating larger longitudinal cohorts with repeated imaging in future research. Third, the gene association analysis relied on the AHBA derived from healthy donors, with a predominant focus on the left hemisphere, which limits spatial resolution and generalizability. Future replication and extension using patient-derived tissue, single-cell data, or complementary transcriptomic resources are needed. Finally, the naturalistic, open-label treatment design, without a placebo control and with pharmacological heterogeneity, means that while we statistically controlled for dosage, we cannot fully exclude potential confounding effects of specific drug actions or the natural course of illness.
Conclusions
Through structural neuroimaging analysis, this study delineates the neuroanatomical correlates of CF in OCD. We demonstrate that high CF levels are associated with pathologically enhanced structural coupling between the DMN, executive control networks, and the cerebellum, which may constitute a neural substrate for cognitive rigidity and thought fixation. Furthermore, we identify baseline GMV in the left SFGdl as an independent biomarker predicting improvement in CF following pharmacotherapy. Transcriptomic insights suggest that regions susceptible to structural remodeling in OCD are normatively enriched for genes associated with glutamatergic signaling and neuropeptide pathways. These findings deepen the understanding of OCD psychopathology and provide a theoretical framework for developing imaging-based biomarkers to guide precision diagnosis and treatment.
Supplementary material
The supplementary material for this article can be found at http://doi.org/10.1017/S0033291726105583.
Data availability statement
The raw data supporting the conclusions of this article will be made available by the corresponding authors, without undue reservation.
Acknowledgments
The authors would like to express our thanks to all the subjects who participated in the study.
Author contribution
Y.M., X.Z., and M.H. designed this study. X.S., Y.Z., and X.L. performed data analysis and wrote and revised this manuscript. Other authors conducted data collection and curation. The final manuscript had been verified and approved by all authors.
Funding statement
This study was supported by National Natural Science Foundation of China (81960261).
Competing interests
The authors declare none.
Ethical standard
The research protocol received approval from the Ethics Review Committee of the First Affiliated Hospital of Nanchang University (No. IIT-2020-31). All participants provided written informed consent after receiving detailed study explanations.




 Open access

