Introduction
Previous studies have shown that the decreased hemoglobin levels play a role in increasing the risk of developing dementia among the elderly (Qiu et al., Reference Qiu, von Strauss, Fastbom, Winblad and Fratiglioni2003; Chaves et al., Reference Chaves, Carlson, Ferrucci, Guralnik, Semba and Fried2006; Shah et al., Reference Shah, Wilson, Tang, Dong, Murray and Bennett2009). Specifically, these studies suggested that low hemoglobin levels increased the risk of developing dementia by 40%–100% (Atti et al., Reference Atti, Palmer, Volpato, Zuliani, Winblad and Fratiglioni2006; Shah et al., Reference Shah, Buchman, Wilson, Leurgans and Bennett2011; Son et al., Reference Son2012; Hong et al., Reference Hong2013). Only few studies have investigated upon the relationship between low hemoglobin levels and neuroimaging markers and thus, the underlying mechanisms linking low hemoglobin levels to incident dementia still remain to be elucidated (Vichinsky et al., Reference Vichinsky2010). Furthermore, to the best of our knowledge, there were no studies that have evaluated the relationships between low hemoglobin levels and brain atrophy.
Vascular risk factors often produce CSVD and are manifested as WMH, lacunes, and microbleeds on MR images (O’Brien et al., Reference O’Brien2003). Previous studies also suggested that hypertension or diabetes mellitus were associated with cortical atrophy (Biessels et al., Reference Biessels, De Leeuw, Lindeboom, Barkhof and Scheltens2006). Cortical atrophy is an important biomarker to predict cognitive impairment in cognitively normal participants because cortical atrophy precedes the onset of cognitive decline (Kramer et al., Reference Kramer2007; Hampel et al., Reference Hampel, Burger, Teipel, Bokde, Zetterberg and Blennow2008; Jack et al., Reference Jack2009; Reference Jack2010; Seo et al., Reference Seo2011). In this context, we hypothesized that chronic brain hypoxia induced by low hemoglobin levels may cause ischemia or infarction in both the subcortex causing WMH, and the cortex leading to cortical atrophy simultaneously. We therefore investigated the relationships between hemoglobin levels and CSVD through the measurement of WMH, lacunes, and microbleeds and cortical atrophy as measured by cortical thickness in cognitively healthy women and men who participated in a comprehensive health exam program.
Methods
Participants
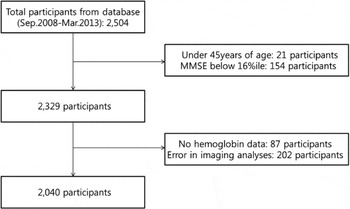
We enrolled 2,504 participants who visited the Health Promotion Center at the Samsung Medical Center in Seoul, South Korea, from September 2008 to March 2013 for comprehensive medical check-ups. As part of the comprehensive exam, participants could opt for a comprehensive neurological and neurocognitive screening package that includes undergoing brain MRI. Among 2,504 participants who signed up for neurological testing, we excluded 21 participants under 45 years of age and 154 participants with cognitive impairment assessed by combining the findings of an interview with a qualified neurologist and a Mini-Mental Status Exam (MMSE) score below the 16th percentile for age-, gender-, and education-matched norms. We also excluded participants with incomplete data on hemoglobin levels (N = 87). From the remaining 2,242 participants, we further excluded 202 participants who showed errors from the cortical thickness analysis including head motion, blurring of MRI, inadequate registration to a standardized stereotaxic space, misclassification of tissue type, and inexact surface extraction. Radiologists inspected all MR images, including images with brain tumors of any kind, major infarctions (except lacunar infarction), and hemorrhages (observed as low intensity areas in T2-weighted images). The final sample size included 2,040 participants: 1,022 women and 1,018 men) (see Figure 1).
Flow diagram of study population.

This study was approved by the Institutional Review Board of Samsung Medical Center, and the requirement for patient consent was waived given the retrospective nature of the study.
Data collection
The examinations were conducted by trained personnel following a standard protocol. The health screening program included a questionnaire data, physical exam, laboratory tests, and a number of functional and imaging tests as described previously (Park et al., Reference Park2010). The questionnaire included questions on physician-diagnosed disease, medication history. Blood pressure was measured with an electronic sphygmomanometer after participants had rested for more than five minutes. Hypertension was defined through a self-reported doctor diagnosis, a history of use of antihypertensive medication, a systolic blood pressure (SBP) ≥ 140 mmHg, or a diastolic blood pressure (DBP) ≥ 90 mmHg. Diabetes was defined through a self-reported doctor diagnosis, a history of use of diabetes medication or a fasting blood glucose ≥ 126 mg/dL. Hypercholesterolemia was defined as self-reported doctor diagnosis, a history of use of hypercholesterolemia medication or a hypercholesterol ≥ 240 mg/dL. Glomerular filtration rate (GFR) was estimated using the Modification of Diet in Renal Disease (MDRD) equation. Body mass index (kg/m2) was calculated from direct height and weight measurement. Quality control procedures for laboratory parameters in fasting samples were followed in accordance to the Korean Association of Laboratory Quality Control.
Hemoglobin measurement
Blood samples were drawn from consenting participants following an 8 h morning fast. A standard procedure was used to collect blood samples. Hemoglobin concentration was analyzed according to a standard protocol by using the Sysmex XE-2100 Automated Hematology System (TOA Medical Electronics, Kobe, Japan).
MRI data
T2, T1, FLAIR, T2 FFE-MR, and three-dimensional T1 Turbo Field Echo (TFE) images were acquired from all participants at Samsung Medical Center using the same 3.0T MRI scanner (Philips, Best, the Netherlands). In all participants, these images were obtained in one session and all MR images were obtained in the same orientation and slice positions. T2 FFE-MR were obtained using the following parameters: axial slice thickness, 5.0 mm; inter-slice thickness, 2 mm; TR, 669 ms; TE 16 ms; flip angle, 18°, and a matrix size of 560×560 pixels. TFE MRI data were obtained using a sagittal slice thickness of 1.0 mm, overcontiguous slices with 50% overlap and no gap, a repetition time of 9.9 ms, an echo time of 4.6 ms, a flip angle of 8°, and a matrix size of 240×240 pixels reconstructed to 480×480 over a field of view of 240 mm. Radiologists inspected all MRI data for signs of brain tumors of any kind, major infarctions (except lacunar infarctions), and hemorrhages (observed as low intensity areas in T2-weighted images). Ten participants with major infarctions and two participants with hemorrhages were excluded in these analyses.
WMH visual rating scale
WMH visual rating scale was modified using the Fazekas scale (Fazekas et al., Reference Fazekas, Chawluk, Alavi, Hurtig and Zimmerman1987). On this scale, periventricular WMH (PWMH) were classified as P1 (cap and band<5 mm), P2 (5 mm≤cap or band<10 mm), or P3 (10 mm≤cap or band); deep WMH (DWMH) were classified as D1 (maximum diameter of deep white matter lesion <10 mm), D2 (10 mm≤lesion<25 mm), or D3 (≥25 mm). The inter-rater reliabilities of the WMH including PWMH and DWMH (κ = 0.595–0.787) and the intra-rater reliabilities of them (κ = 0.874–0.979) were good.
The results were combined to give a final ischemia classification of mild, moderate, or severe. The combinations of D1 with P1 (D1P1) and D1 with P2 (D1P2) were classified as “minimal.” The combinations D2P1, D3P1, D2P2, D3P2, D1P3, and D2P3 were classified as “moderate,” while D3P3 was classified as “severe.” A previous study showed that this ischemia classification system distinguished the presence of vascular risk factors and assessed the severity of cerebrovascular disease markers (Noh et al., Reference Noh2014).
Number of lacunes
The lacune was defined as a small lesion (≤15 mm in diameter) with a low signal on T1-, a high signal onT2-weighted images, and perilesional halo on FLAIR images. Two experienced neurologists who were blinded to the patients’ data, reviewed the number and location of the lacunes on 20 axial slices of FLAIR. The rate of agreement between the two neurologists was 83.0% and consensus was reached in any case of discrepancy.
Number of microbleeds
Cerebral microbleeds were defined as < 10 mm in diameter and using the criteria proposed by Greenberg et al. (Reference Greenberg2009) was used. Two experienced neurologists, who were blinded to patients’ data, reviewed the number and location of cerebral microbleeds on 20 axial slices of T2 FFE-MRI. The rate of agreement between the two neurologists was 92.3% and consensus was reached in cases of discrepancy.
Cortical thickness measurements
Images were processed for cortical thickness measurement by the standard Montreal Neurological Institute (MNI) anatomic pipeline. The native MR images were registered into a standardized stereotaxic space using linear transformation (Collins et al., Reference Collins, Neelin, Peters and Evans1994). Non-uniformity artifacts were corrected, and the images were classified as white matter, gray matter, cerebrospinal fluid, or background using an artificial neural net classifier (Zijdenbos et al., Reference Zijdenbos, Evans, Riahi, Sled, Chui, Kollokian, Höhne and Kikinis1996; Sled et al., Reference Sled, Zijdenbos and Evans1998). The surfaces of the inner and outer cortex were automatically extracted using the Constrained Laplacian-Based Automated Segmentation with Proximities (CLASP) algorithm (Kim et al., Reference Kim2005).
Cortical thickness was calculated as the Euclidean distance between the linked vertices of the inner and outer surfaces after applying an inverse transformation matrix to cortical surfaces and reconstructing them in the native space (Kim et al., Reference Kim2005; Im et al., Reference Im2006). To compare the thicknesses of corresponding regions across participants, we used an improved surface registration algorithm and an unbiased iterative group template which illustrated enhanced anatomic details (Lyttelton et al., Reference Lyttelton, Boucher, Robbins and Evans2007). Using the transformation, thickness information on the vertices was transformed into an unbiased iterative group template.
Statistical analysis
All analyses were performed separately according to the gender because there were differences in the normal range of hemoglobin concentration between women and men.
CSVD markers including WMH, lacunes, and microbleeds did not show normal distribution. Therefore, we performed simple (model 1) and multiple (model 2) logistic regression after reclassifying our CSVD markers as dichotomized variables: WMH; none to minimal versus moderate to severe, lacunes, and microbleeds; none versus presence. In model 2, we entered age, education, hemoglobin level, history of diabetes mellitus, hypertension, hyperlipidemia, stroke and cardiac disease, body mass index, estimated GFR, and intra-cranial volume (ICV) as independent variables. Hemoglobin level was analyzed per point decrease.
To evaluate the association between hemoglobin levels and mean cortical thickness, simple (model 1) and multiple (model 2) linear regression analyses were performed. Hemoglobin level was analyzed per point decrease. In model 2, we entered age, education, hemoglobin level, history of diabetes mellitus, hypertension, hyperlipidemia, stroke, and cardiac disease, body mass index, estimated GFR, and ICV as covariates. During the analysis, we tested for assumption of multiple linear regression such as normality and homoscedasticity, which revealed to be non-violated. The SPSS software, version 18.0 (SPSS Inc, Chicago, Illinois) was used for all analysis.
In order to analyze the localized statistical map of cortical thickness as it is associated with hemoglobin levels on the surface model, we entered hemoglobin levels as a predictor, and cortical thickness on a vertex-by-vertex, as an outcome. A multiple linear regression analysis was then performed after controlling for age, education, hemoglobin level, history of diabetes mellitus, hypertension, hyperlipidemia, stroke, and cardiac disease, body mass index, estimated GFR, and ICV. The cortical surface model contained 81,924 vertices, thus correction for multiple comparisons was performed by a random field theory, correction at a probability value of 0.05.
Results
Demographic factors
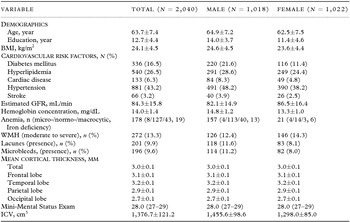
The characteristics of the study population are summarized in Table 1. The proportion of women was 50.1%. Mean age (±standard deviation) was 62.5 ± 7.5 years in women and 64.9 ± 7.2 years in men. Mean hemoglobin concentration (±standard deviation) was 13.3 ± 1.0 (mg/dL) in women and 14.8 ± 1.2 (mg/dL) in men.
Characteristics of participants

*Continuous variables are presented as mean ± SD, or median (interquartile range, 25th–75th percentile).
BMI = body mass index; GFR = glomerular filtration rate; WMH = white matter hyperintensities; ICV = intracranial volume.
Hemoglobin and CSVD
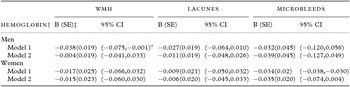
Table 2 shows the results of the simple (model 1) and multiple (model 2) logistic regression analyses. In model 1, there was a negative correlation between hemoglobin levels and the presence of WMH. However, there were no significant associations between hemoglobin levels and the presence of CSVD markers including WMH, lacunes, or microbleeds among women and men in model 2.
Relationships between cerebral small-vessel disease markers and hemoglobin levels

Model 1: simple logistic regression.
Model 2: multiple logistic regression after controlling for age, years of education, hypertension, diabetes, hyperlipidemia, cardiac disease, stroke, estimated glomerular filtration rate, body mass index, and intracranial volume.
†hemoglobin level was analyzed per point decrease.
‡SE = standard error, CI = confidence interval, WMH = white matter hyperintensities.
Hemoglobin and cortical thickness
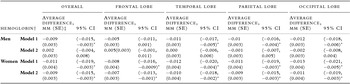
Results of the simple (model 1) and multiple (model 2) linear regression analyses are shown on Table 3. Among women, in both models 1 and 2 (95% confidence interval (CI), model1/model 2), decreased hemoglobin levels were associated with decreased mean cortical thickness in the frontal ((−0.016,−0.0009)/(−0.013,−0.001)), temporal ((−0.020,−0.004)/(−0.018,−0.002)), parietal ((−0.019,−0.003)/(−0.015,−0.003)), and occipital regions ((−0.021,−0.005)/(−0.019,−0.003)). However, among men, there was no significant association between hemoglobin levels and cortical thickness (Table 3).
Relationships between cortical thickness and hemoglobin levels

Model 1: simple linear regression.
Model 2: multiple linear regression after controlling for age, years of education, hypertension, diabetes, hyperlipidemia, cardiac disease, stroke, estimated glomerular filtration rate, body mass index, and intracranial volume.
†hemoglobin level was analyzed per point decrease.
‡SE = standard error, CI = confidence interval.
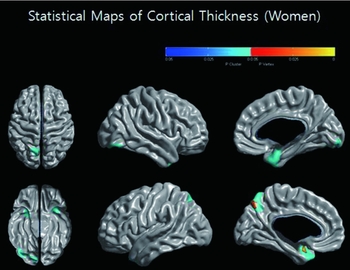
Among women, the topography of cortical thinning showed that decreased hemoglobin levels were associated with decreased cortical thickness in the bilateral orbitofrontal, anterior temporal, lateral temporal, posterior cingulate gyrus, precuneus, and fusiform gyrus (Figure 2).
Statistical maps of cortical thickness (Women). The topography of cortical thinning showed that hemoglobin levels were associated with cortical thinning in the anterior temporal, lateral temporal, posterior cingulate gyrus, precuneus, and fusiform gyrus (β = 0.044, SE = 0.007, p < 0.001).

In the sensitivity analyses, one standard deviation decline in hemoglobin level was put in independent variable instead of a one-point decline in the model 2. The results were generally similar with those with per point decrease in hemoglobin (Table S1, available as supplementary material attached to the electronic version of this paper at www.journals.cambridge.org/jid_IPG). After adding smoking (yes or no) and alcohol (yes or no) use to model 2, the results were generally similar to the results prior to addition of these factors (Table S2, available as supplementary material attached to the electronic version of this paper at www.journals.cambridge.org/jid_IPG).
Discussion
This study reports novel findings on the relationship between hemoglobin levels, WMH, and cortical thickness in 2,040 cognitively normal individuals. Previous studies have reported the impact of decreased hemoglobin levels on cognitive impairments. However, a limited number of studies focused on hemoglobin levels related neuroimaging markers. Our major finding was that among women, decreased hemoglobin levels were associated with cortical thinning, although the association is modest. Given the paucity of modifiable risk factors for age-related cognitive decline, our results have important public health implications.
Previous studies suggested that decreased hemoglobin levels might contribute to chronic brain hypo-oxygenation in subcortical regions (Son et al., Reference Son2012). However, we did not find a significant correlation between decreased hemoglobin and WMH that refer to the outcome of chronic brain hypoperfusion in the subcortical regions. Our finding is consistent with a previous study showing that anemia did not predict WMH progression in the general population, although anemia correlated with WMH progression in elderly hypertensives (Inzitari et al., Reference Inzitari2008). Furthermore, our study suggested that decreased hemoglobin levels were not associated with lacunes or microbleeds.
Our major finding was that among women, decreased hemoglobin levels were associated with cortical thinning. Considering that cortical thinning is an early marker of dementia in the elderly, our finding is consistent with previous studies showing that low hemoglobin levels increased risk of developing dementia (Qiu et al., Reference Qiu, von Strauss, Fastbom, Winblad and Fratiglioni2003; Atti et al., Reference Atti, Palmer, Volpato, Zuliani, Winblad and Fratiglioni2006; Shah et al., Reference Shah, Buchman, Wilson, Leurgans and Bennett2011; Hong et al., Reference Hong2013). Previous studies had also shown that low hemoglobin levels were associated with cognitive impairments in general population (Atti et al., Reference Atti, Palmer, Volpato, Zuliani, Winblad and Fratiglioni2006). They suggested that anemia was correlated with poorer performances of executive dysfunctions or selective performances rather than other cognitive dysfunctions (Chaves et al., Reference Chaves, Carlson, Ferrucci, Guralnik, Semba and Fried2006). However, our finding in regards to the topography of cortical thinning is partially inconsistent with previous studies (Mackin et al., Reference Mackin2014). Based on our findings, decreased hemoglobin levels were associated with cortical thinning not only in frontal regions, but also in the lateral temporal and medial parietal regions, which are responsible for language and memory functions, respectively. In fact, a recent study revealed that baseline low hemoglobin levels were associated with memory and perceptual speed (Shah et al., Reference Shah, Wilson, Tang, Dong, Murray and Bennett2009). Further study is necessary in order to validate our findings for only few studies have been reported to have evaluated the effects of anemia on all specific cognitive domains.
The reason why decreased hemoglobin levels affected cortical thinning is important, but still remains unclear. Given that decreased hemoglobin levels induce chronic brain hypoxia, possible explanations have included cortical ischemia, neuro-degeneration, or a marker of poor health. Chronic brain hypoxia might especially cause ischemia or microinfarcts in the cortex, eventually resulting in cortical thinning. Previous studies suggested that cortical ischemia or microinfarcts are associated with brain atrophy and cognitive deficits (Stuss et al., Reference Stuss, Peterkin, Guzman, Guzman and Troyer1997; Scholey et al., Reference Scholey, Moss, Neave and Wesnes1999; Shah et al., Reference Shah, Schneider, Leurgans and Bennett2012). Alternatively, chronic brain hypoxia might induce amyloidogenic processing, which in turn leads to brain atrophy (Manley et al., Reference Manley, Knudson, Morabito, Damron, Erickson and Pitts2001; Bazan et al., Reference Bazan, Palacios-Pelaez and Lukiw2002; Li et al., Reference Li, Zhang, Yang, Luo, Chen and Le2009; de Souza et al., Reference de Souza2011; Wang et al., Reference Wang2011; Zlokovic, Reference Zlokovic2011; Chetelat et al., Reference Chetelat2012). Finally, decreased hemoglobin levels may be a marker of poor health. Thus, this association may be driven by poor health status, although possible confounders including cardiovascular disease, renal disease, and underweight were controlled in this study.
In the present study, differences in the relationships between decreased hemoglobin levels and cortical thinning were observed between women and men. Like our findings, previous studies showed that in women, but not in men, there were association between low hemoglobin levels and dementia although their results were inconsistent (Beard et al., Reference Beard, Kokmen, O’Brien, Ania and Melton1997; Shah et al., Reference Shah, Wilson, Tang, Dong, Murray and Bennett2009). However, we were not able to find the specific biological evidence to explain the different gender specific effects. More extensive research is required in order to validate our findings.
There were several limitations to this study. First, the cross-sectional aspect of the study hindered the examination of the direction of a potential causal relationship between hemoglobin level and cortical thickness. Second, measuring hemoglobin levels at a single time point might lead clinicians to underestimate or overestimate the risk of cortical thinning related to decreased hemoglobin levels. Third, we did not measure micronutrients such as iron or vitamin B12, where the deficiencies of either may potentially lead to the onset of dementia. Fourth, WMH visual rating scale was assessed in this study, which might lead to a loss of precision of estimated means, although the WMH visual rating scale correlated with the automated measured volume of WMH (Noh et al., Reference Noh2014). Fifth, the association between decreased hemoglobin levels and cortical thinning is modest, but the association remained even when other risk factors known to affect the brain structures were included in models. Finally, we did not perform genotyping of apolipoprotein E (APOE), which might be related to amyloid clearance (Verghese et al., Reference Verghese2013). Thus, we need to perform further studies in order to evaluate whether APOE4 might influence the relationship between anemia and cortical thinning. However, this study is noteworthy for to the best of our knowledge, this is the first clinical study that showed that decreased hemoglobin levels might have an association with cortical thinning.
Conflict of interest
None.
Description of authors’ roles
S. E. Park conducted the initial analyses and wrote the initial draft. J.-J. Yang and J.-M. Lee conducted the critical analysis. S. W. Seo strengthened the organization of the papers and the interpretation of findings. D. L. Na, H. J. Kim, H. Cho, B. S. Ye, Y. J. Kim, N.-T. Jung, T. O. Son, E. B. Cho, H. Jang and C. H. Hong gave critical revision of the manuscript for important intellectual content. M. Kang, H.-Y. Shin, H. Kim, J. Lee and N. K. Lee, J. W. Hwang and E. Y. Jang helped to collect data. All authors approved the final version of the paper to be published.
Acknowledgments
This study was supported by Basic Research Program through the National Research Foundation of South Korea (NRF) funded by the Ministry of Education (NRF-2013R1A1A2065365), the Korean Healthcare Technology, R&D Project through the Korea Health Industry Development Institute (KHIDI), funded by the Ministry of Health & Welfare, Ministry for Health and Welfare Affairs (HIC120713 & HI14C2768), a Korean Science and Engineering Foundation (KOSEF) NRL program grant funded by the Korean government (MEST; 20110028333), a Samsung Medical Center Clinical Research Development Program grant (CRL108011 & CRS 110-14-1), the Korea Ministry of Environment (MOE) as the Environmental Health Action Program (2014001360002).
Supplementary material
To view supplementary material for this article, please visit http://dx.doi.org/10.1017/S1041610215000733