





Introduction
Weed control is the foremost production challenge for organic farmers (Snyder et al. Reference Snyder, Schonbeck and Vélez2022) and for those who grow vegetable crops for which few herbicide options are available (Pannacci et al. Reference Pannacci, Lattanzi and Tei2017). These farmers usually depend on cultivation, harrowing, hoeing, or a combination of these, also referred to as mechanical or physical weed control (PWC) (Gallandt Reference Gallandt, Chauhan and Mahajan2014; Gallandt et al. Reference Gallandt, Birthisel, Brown, McCollough, Pickoff, Korres, Burgos and Duke2018a). PWC efficacy can be effective in a large crop with small weeds, especially where soils are hot and dry (Mohler Reference Mohler, Liebman, Mohler and Staver2001). Unfortunately, suboptimal conditions often result poor PWC efficacy with high levels of crop injury (Gallandt et al. Reference Gallandt, Brainard, Brown and Zimdahl2018b). This is especially a problem for small-scale vegetable farmers such as those who farm 2 hectares or fewer, who rely on manual labor, using hand tools and hand weeding after some form of tractor-based cultivation (Bond and Grundy Reference Bond and Grundy2001).
Common hand tools used on small-scale farms include wheel hoes, long-handled hoes, and short-handled tools. Weeding labor can make up a large percentage of a small farm’s operational costs (Brown et al. Reference Brown, Hoshide and Gallandt2018). Working rates for using hand tools and to pull weeds by hand are density-dependent, increasing proportionally with weed density, a problem given the high weed seedbank densities that exist on organic farms (Jabbour et al. Reference Jabbour, Gallandt, Zwickle, Wilson and Doohan2014). Labor costs can reach US$6,000 ha−1 for some crops, with at least 600 h ha−1 spent weeding (Sørensen et al. Reference Sørensen, Madsen and Jacobsen2005). Reducing labor costs associated with hand-weeding has the potential to improve the profitability of small-scale vegetable farms.
Weeding costs could be reduced if PWC efficacy were improved. Brown and Gallandt (Reference Brown and Gallandt2018) found that PWC tool “stacking”; that is, using more than one cultivation tool at a time, generally resulted in an additive increase in efficacy. In one notable tool sequence there was evidence of synergy. Stacking torsion, finger, and tine weeders resulted in 75% efficacy, exceeding the expected value of 57%. The varying performance of individual tools and particular sequences was believed to reflect varying PWC mechanisms, including severing, uprooting and desiccation, and burial (Mohler Reference Mohler, Liebman, Mohler and Staver2001).
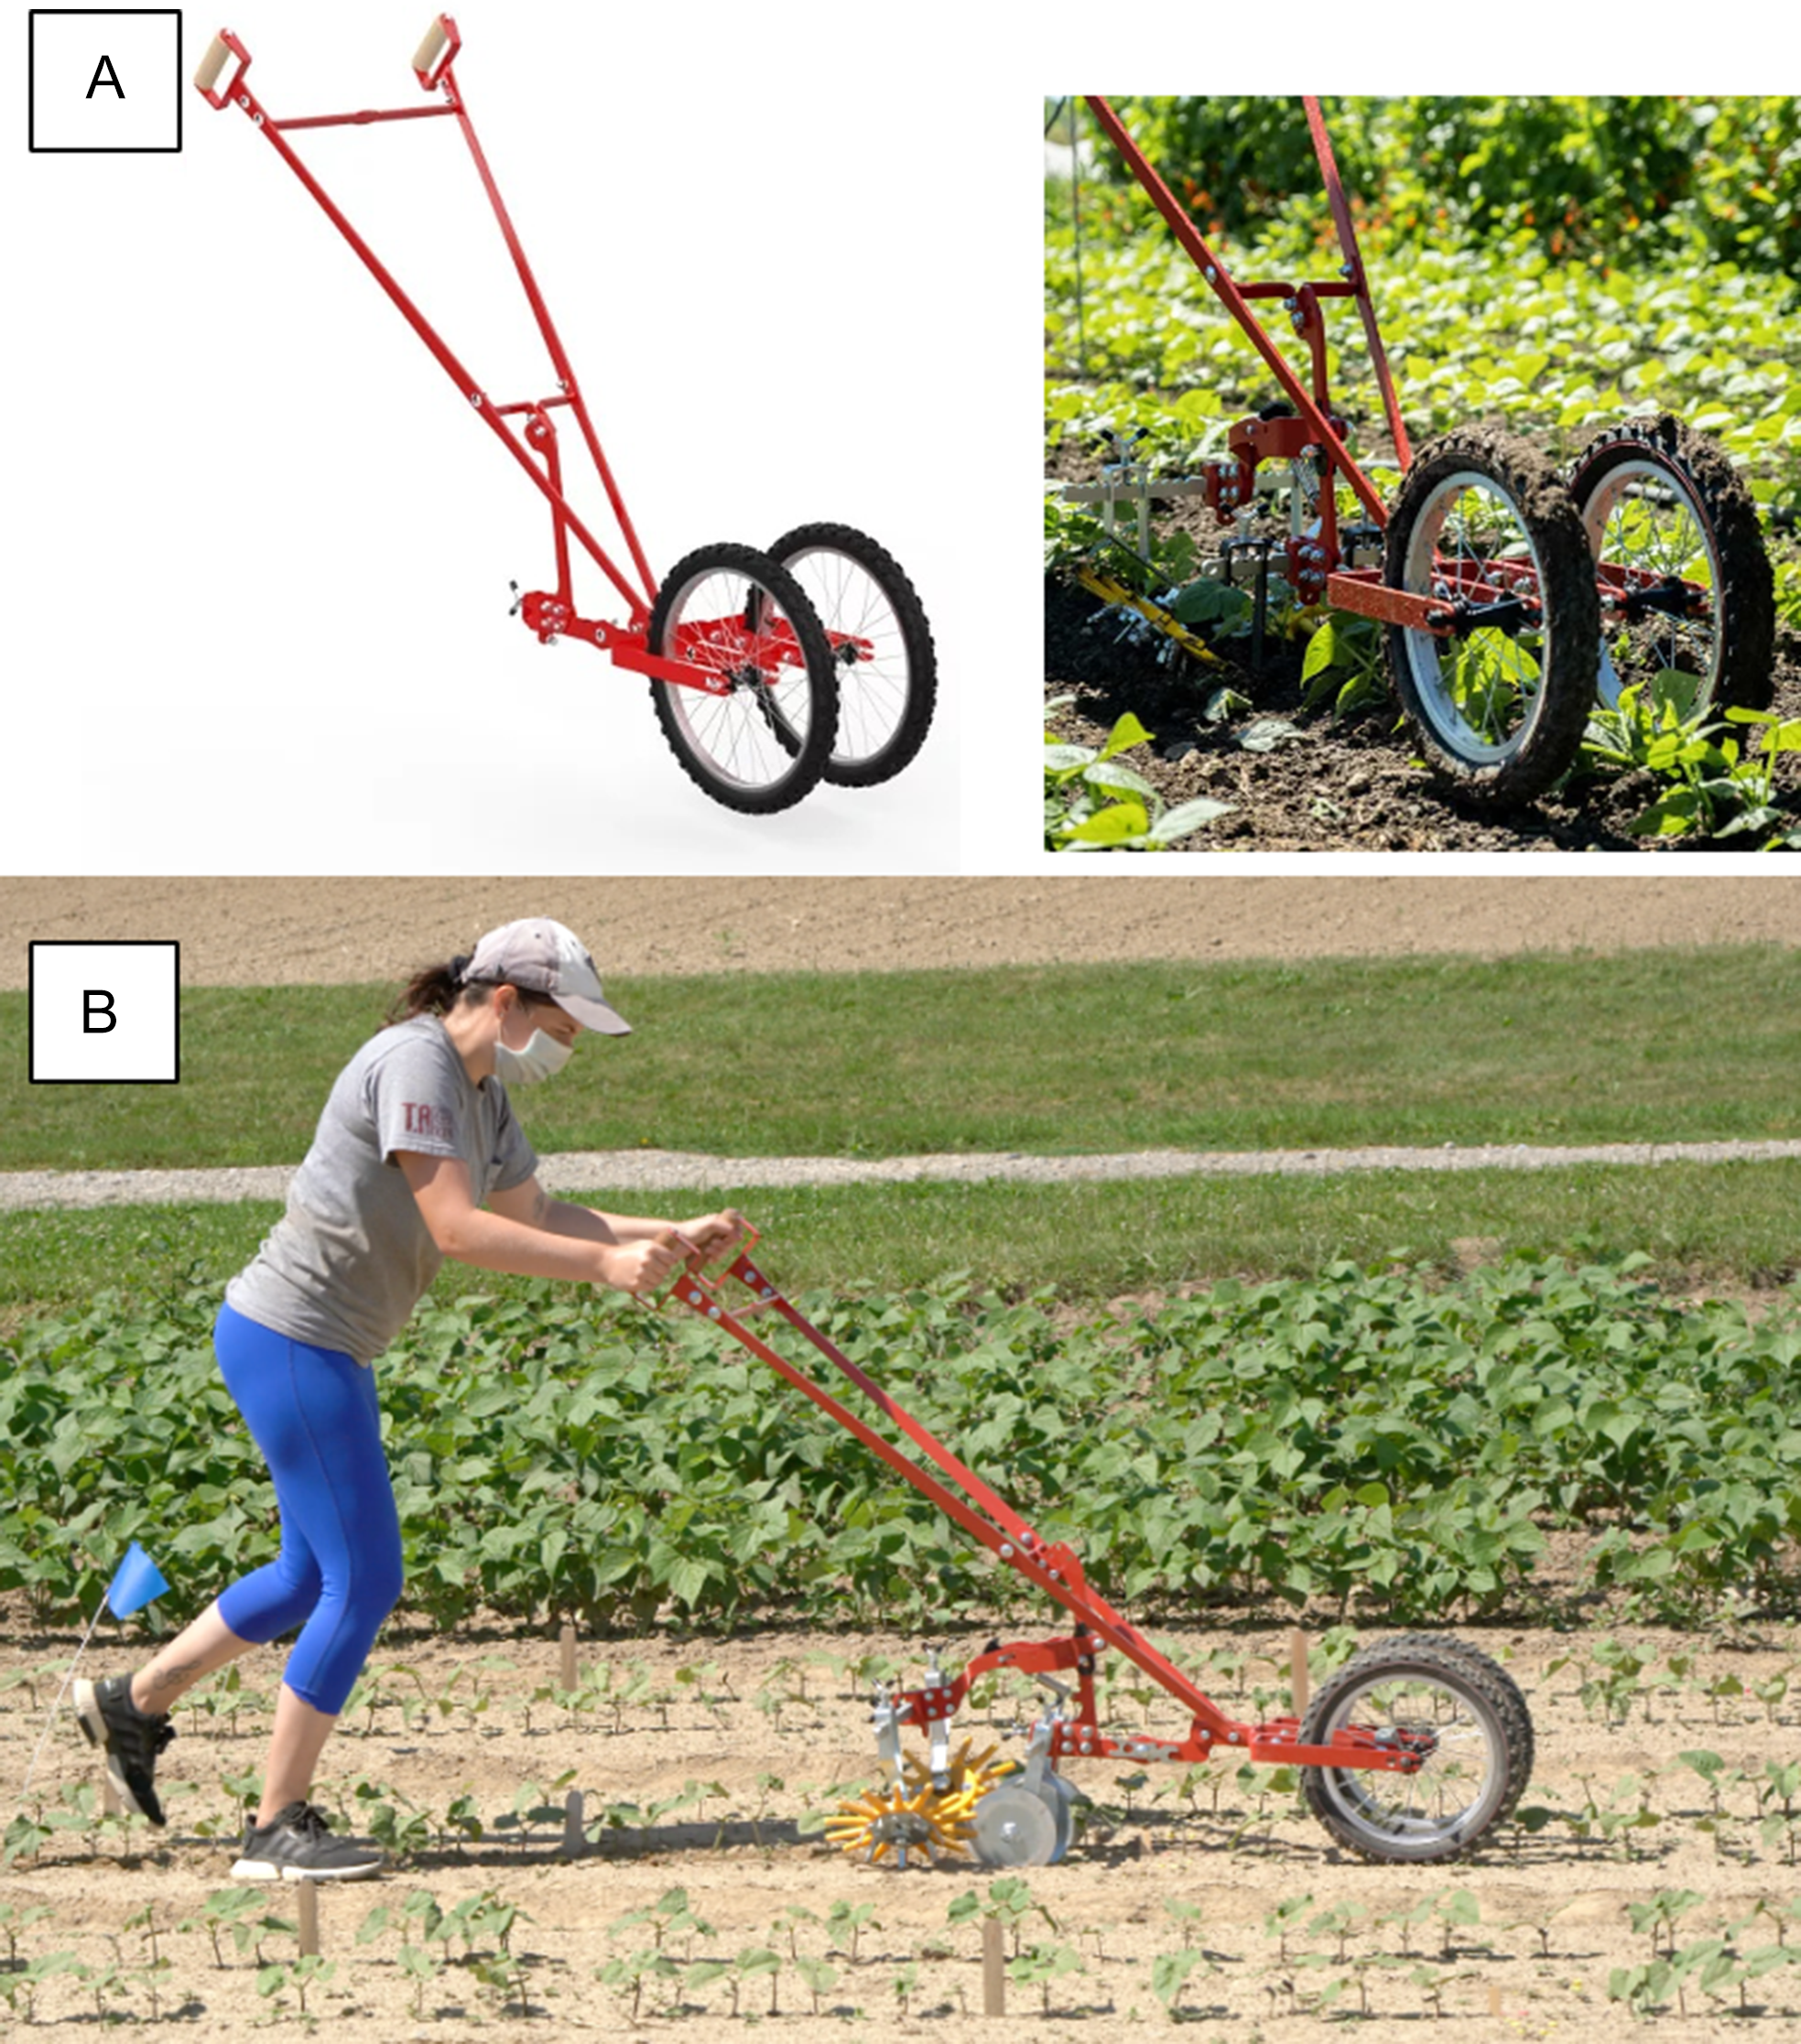
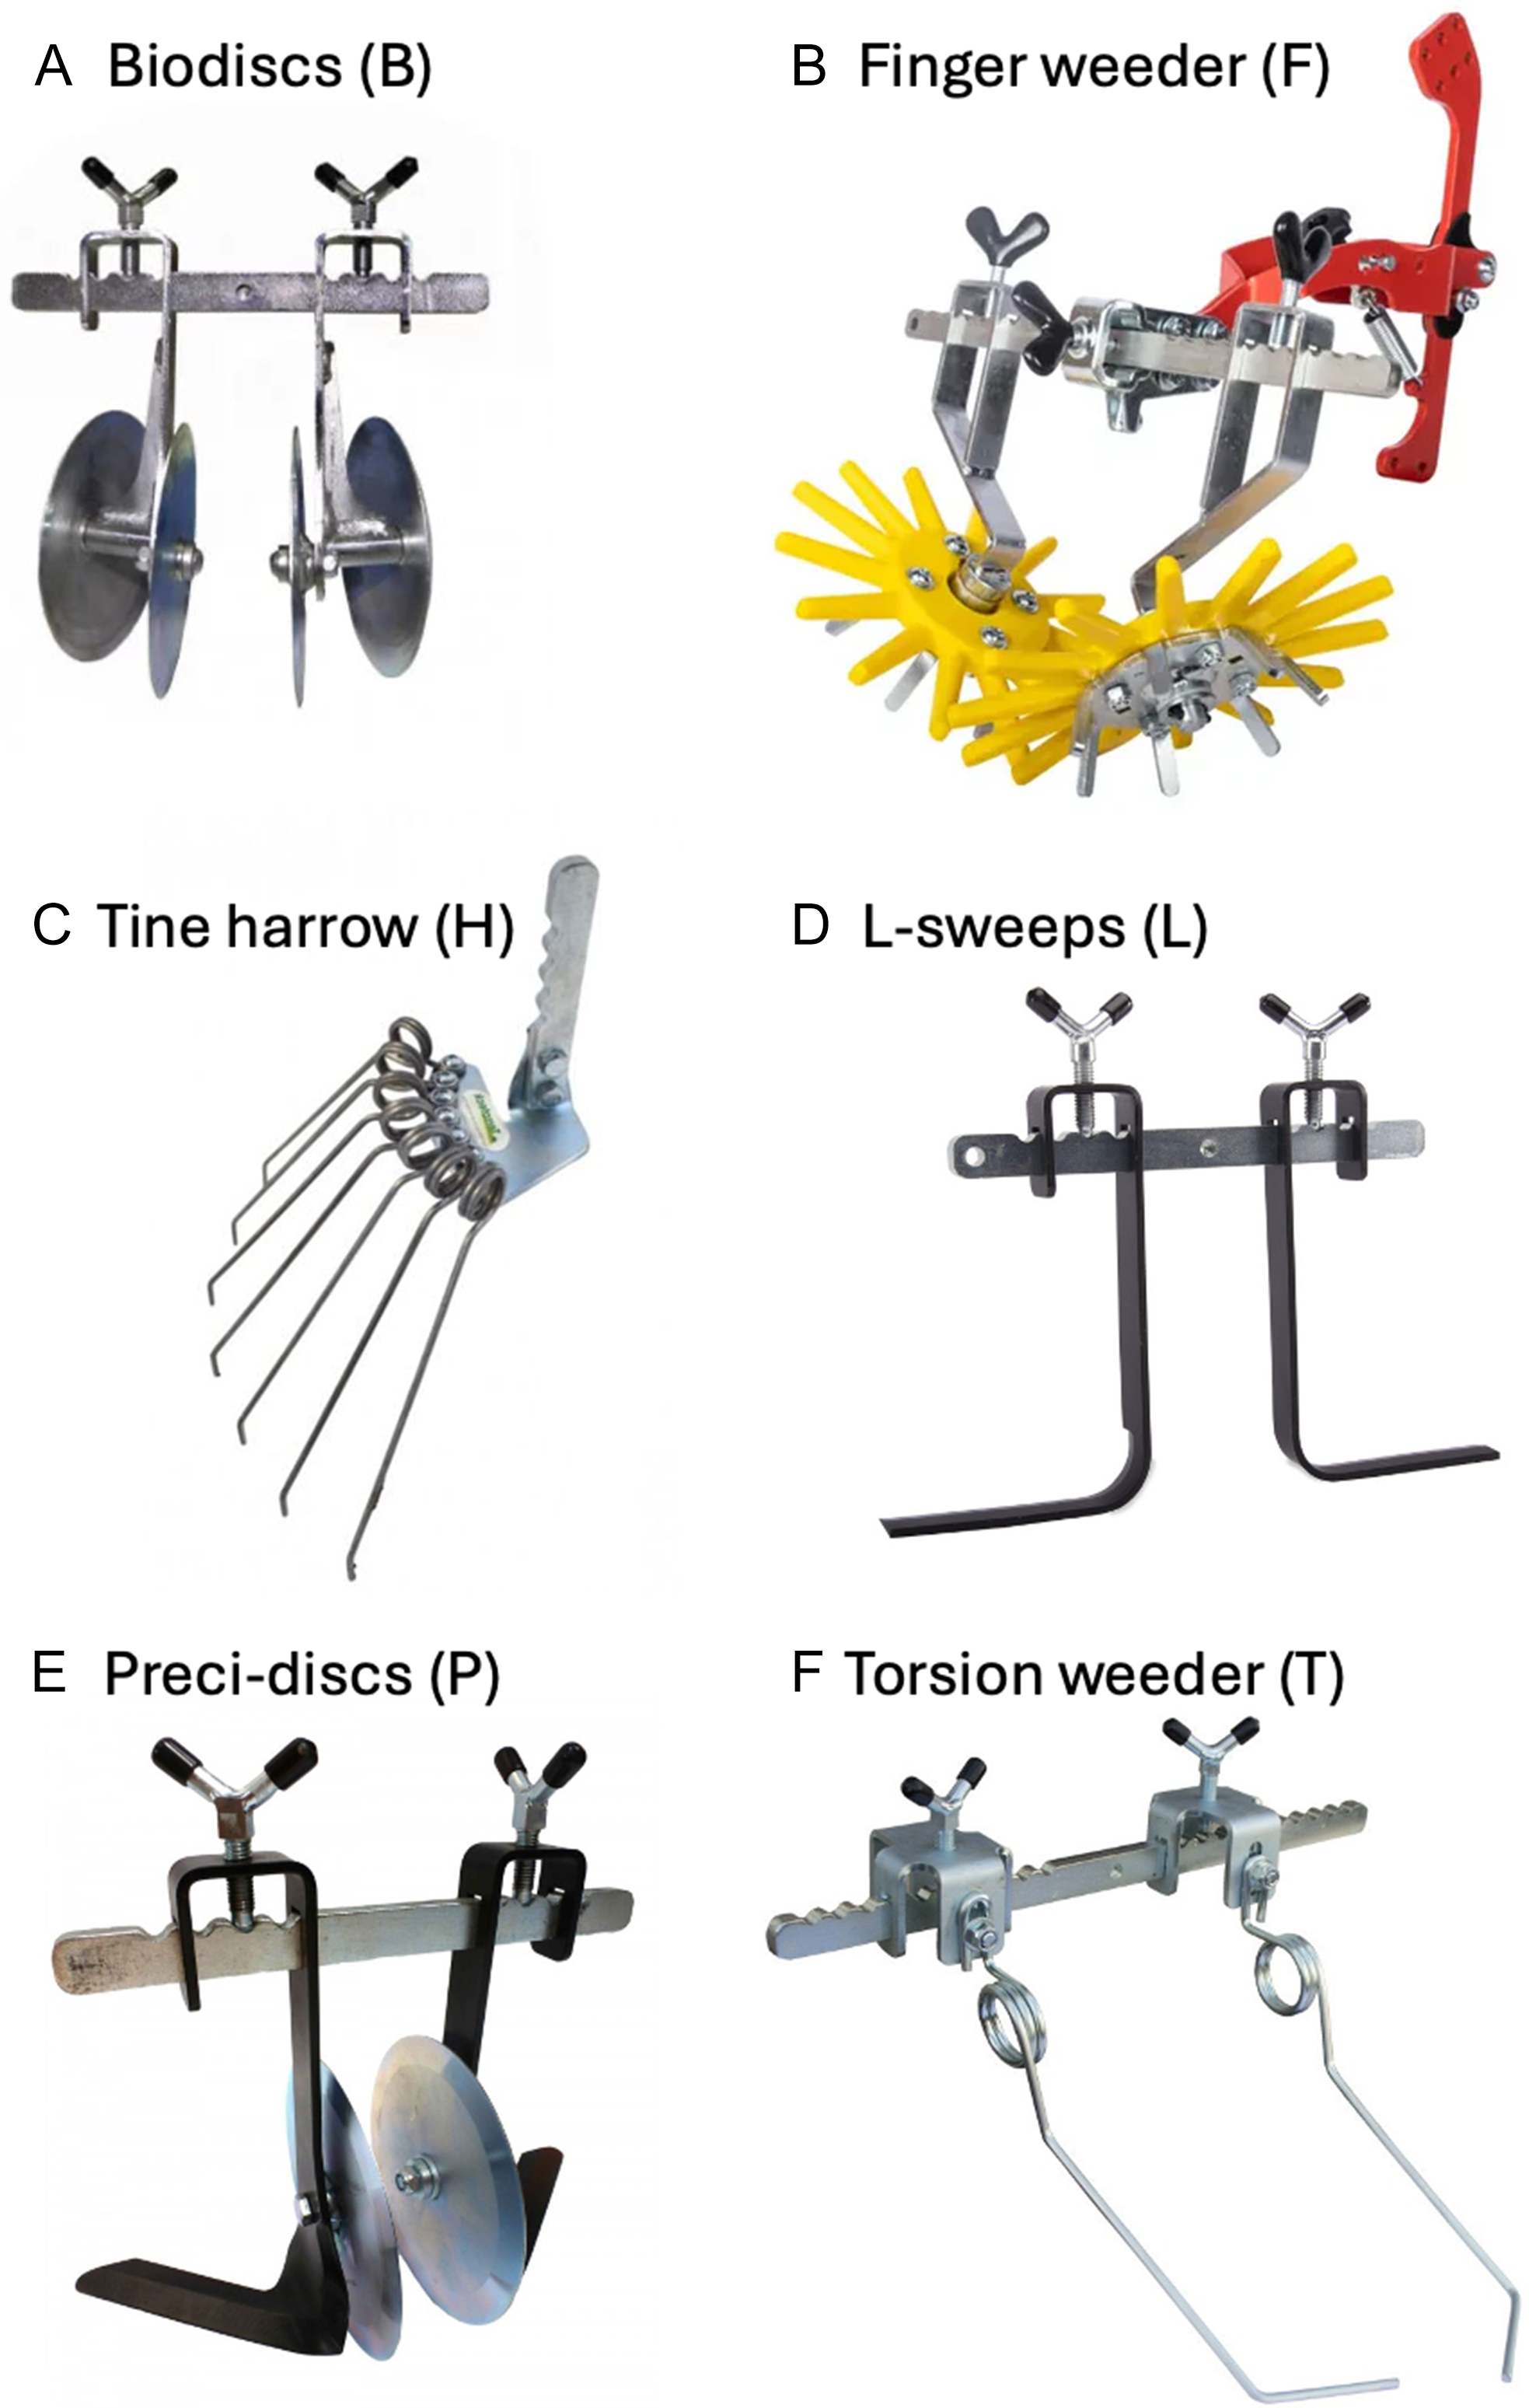
The double-wheel hoe manufactured by Terrateck (Lestrem, France) is a unique hand tool that can accommodate tool stacking, making this strategy available to small-scale farms (Figure 1). Wheels straddle the crop row so both sides of the crop row are cultivated, and a variety of tools, including cut-away and hilling discs, finger weeders, tine harrows, sweeps, and torsion weeders, are then used for weeding purposes (Figure 2). Tools are attached and adjusted along two notched tool bars. The objective of this research was to test PWC tool stacking using hand tools to confirm whether performance would be improved over the use of tractor-mounted tools (Brown and Gallandt Reference Brown and Gallandt2018).
Terrateck double-wheel hoe used for experiments with individual and stacked tools showing how wheels straddle the crop row to permit cultivating on both sides of the crop row (A). Tools are attached to either of two notched tool bars. The stacked tool example shown (B) includes precidiscs on the front toolbar, with finger weeders and tine harrows on the rear toolbar. Photos: (A) Terrateck, Lestrem, France, used with permission; and (B) E. Gallandt.

Terrateck weeding tools available for the double-wheel hoe: biodiscs (A), finger weeders (B), tine harrow (C), L-sweeps (D), precidiscs (E), and torsion weeder (F). Photos: Terrateck, Lestrem, France. Used with permission.

In this study, we tested single tools and tool stacking using the Terrateck double-wheel hoe, examining weed control efficacy and crop mortality. Field experiments were conducted over 2 yr with bush bean and table beet crops, which were chosen to represent large- and small-seeded crops, respectively. We hypothesized that 1) stacking the use of two or three tools would increase weed control efficacy compared with using single tools; and 2) tool stacking would result in greater crop mortality.
Materials and Methods
Site Description
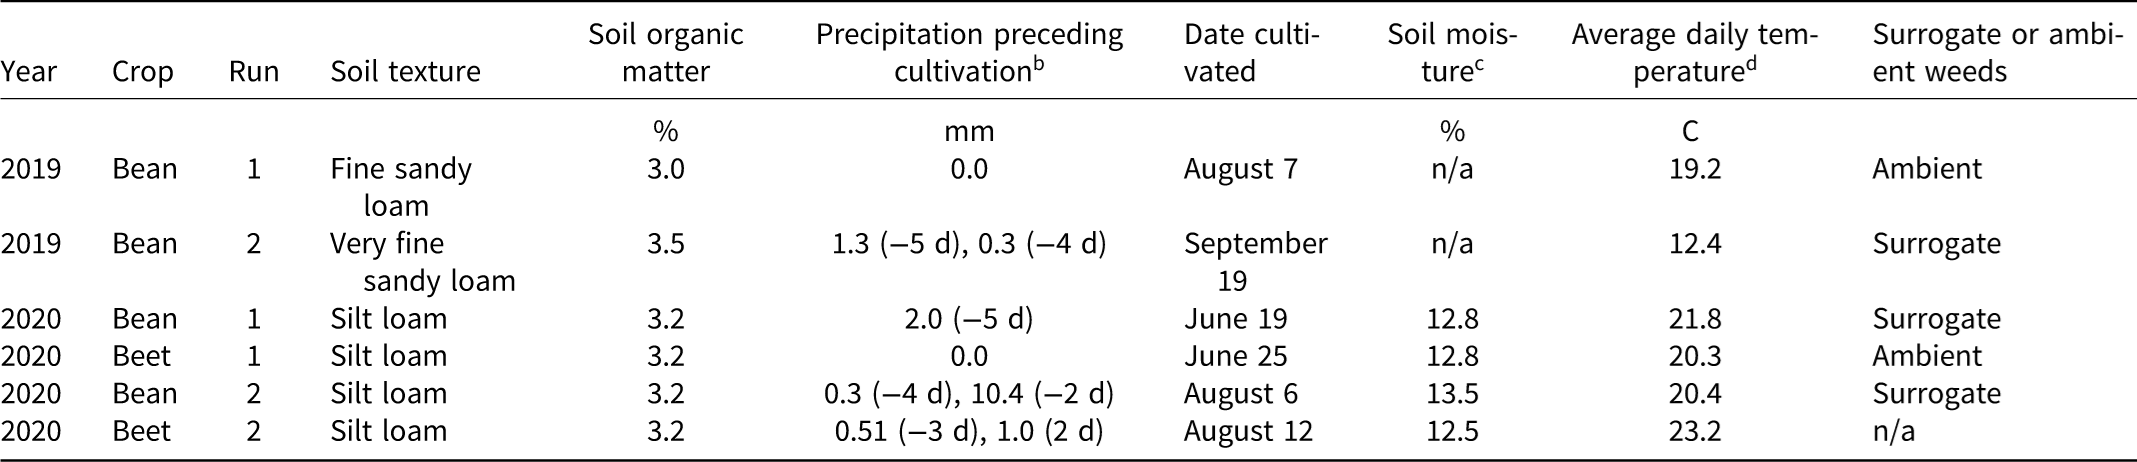
Six field experiments (Table 1) were conducted at the University of Maine Rogers Farm in Old Town (44.926°N, 68.696°W). The site is in Plant Hardiness Zone 4b, with an average annual high/low temperature of 20/−7 C, and average annual precipitation of 1,023 mm. In 2019, experiments with bush bean were performed in two fields: Run 1 occurred on a fine sandy loam with 3.0% soil organic matter; Run 2 on a very fine sandy loam with 3.5% organic matter (Table 1). In 2020, experiments included bush bean and table beet with two runs for each experiment on a silt loam soil with 3.2% organic matter (Table 1).
Metadata for Terrateck tool stacking field experiments conducted in 2019 and 2020. a

Table 1. Long description
A table with 7 rows and 8 columns detailing field experiment metadata. Columns include Year, Crop, Run, Soil texture, Soil organic matter (percent), Precipitation preceding cultivation (millimeters), Date cultivated, Soil moisture (percent), Average daily temperature (degrees Celsius), and Surrogate or ambient weeds. Row 1: 2019, Bean, 1, Fine sandy loam, 3.0, 0.0, August 7, n/a, 19.2, Ambient. Row 2: 2019, Bean, 2, Very fine sandy loam, 3.5, 1.3 (-5 d), 0.3 (-4 d), September 19, n/a, 12.4, Surrogate. Row 3: 2020, Bean, 1, Silt loam, 3.2, 2.0 (-5 d), June 19, 12.8, 21.8, Surrogate. Row 4: 2020, Beet, 1, Silt loam, 3.2, 0.0, June 25, 12.8, 20.3, Ambient. Row 5: 2020, Bean, 2, Silt loam, 3.2, 0.3 (-4 d), 10.4 (-2 d), August 6, 13.5, 20.4, Surrogate. Row 6: 2020, Beet, 2, Silt loam, 3.2, 0.51 (-3 d), 1.0 (2 d), August 12, 12.5, 23.2, n/a.
a n/a indicates data were not available.
b Precipitation during the 5 d preceding cultivation events (0 d). For example, −4 d indicates precipitation 4 d prior to cultivation.
c Volumetric soil moisture was measured to a depth of 8 cm. Values are averages for all plots within an experiment due to lack of significant block or treatment effects.
d Average daily air temperature for the 5 d centered on the date of cultivation (e.g., 2 d prior to cultivation, the day of cultivation, and 2 d after).
Fields were disked and preplant nitrogen was applied as Nutri-wave 4-3-2 (Northeast Agricultural Sales Inc., Detroit, ME) at 60 kg ha−1 plant-available nitrogen and incorporated with a Perfecta field cultivator (Unverferth Manufacturing Company Inc., Kalida, OH). Plots were firmed using a Brillion cultipacker (Landoll Corporation, Marysville, KS); bush bean variety Provider and table beet variety Chioggia Guardsmark were planted using a Wizard vacuum seeder (Sutton Agricultural Enterprises, Inc., Salinas, CA) on 50-cm rows with two rows per bed. In each experiment, condiment mustard (Brassica juncea ‘Pacific Gold’) was sown as a surrogate weed (Kolb et al. Reference Kolb, Gallandt and Mallory2012; Melander and McCollough Reference Melander and McCollough2020). Mustard was broadcast with a Brillion seeder (Landoll) at 8 kg ha−1 10 d prior to cultivation in each crop. Efficacy data include either ambient or surrogate weeds (Table 1) depending on their abundance and satisfactory precultivation densities as discussed below.
Experimental Design and Treatments
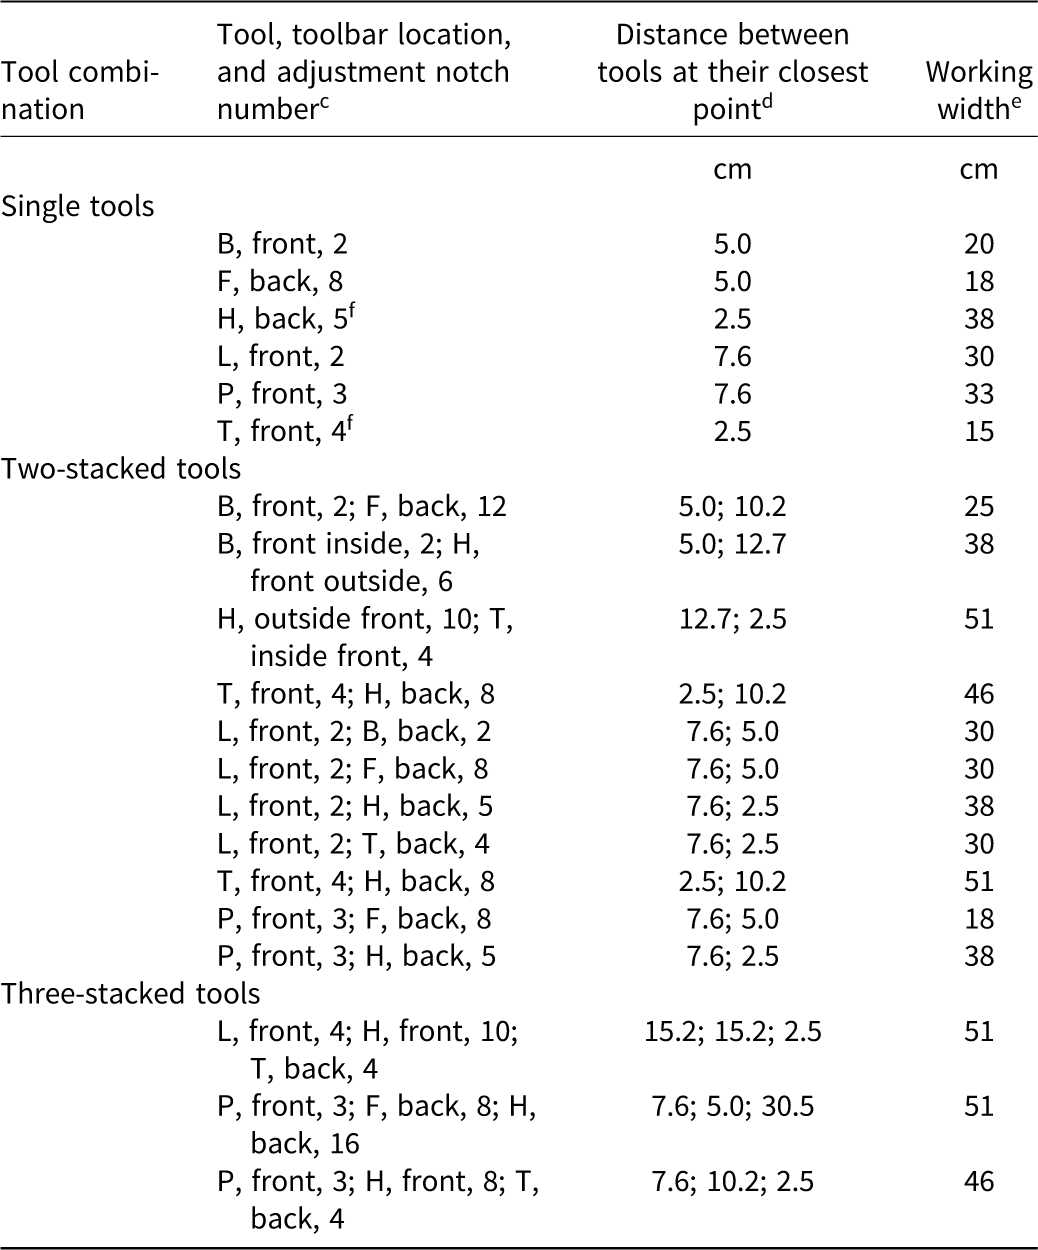
Six tools (Figure 2), used alone and in combination, were chosen for field testing. Tool combinations were chosen by setting up all possibilities and eliminating those with obvious tool interference. Tools were initially set up and tested on at least 50 m of crop row in practice areas prior to use in experimental plots. Each tool was first tested at a setting that did not cause any visible crop injury and then moved closer to the crop row for a more aggressive setting that caused an unacceptable level of crop injury (e.g., >10% loss of stand). Once these extremes were established, a mid-point setting was chosen as being optimal for each treatment. Settings were the same for most tools (B for biodisc, F for finger weeder, L for L-sweep, and P for precidisc) when used on both bush bean and table beet crops, but two tools, tine harrows (H) and torsion weeders (T), were moved one notch away from the crop row center when table beets were being weeded (Table 2). In total, there were 20 treatments: 6 single tools, 11 two-stacked tool combinations, and 3 three-stacked tool combinations (Table 2). The distance between tools ranged from 2.5 cm for tine harrows and torsion weeders used singly, to 30.5 cm for tine harrows in the three-stacked precidisc, finger weeder, tine harrow (PFH) treatment. Working widths, based on the widest point of each tool treatment, ranged from 15 cm for torsion weeders, to 51 cm for several stacked combinations that included tine harrows (Table 2). Tools caused only very shallow soil disturbance (5 to 20 mm).

Table 2. Long description
The table presents data on various tool combinations used in field experiments, detailing their settings and working widths. It includes columns for tool combination, tool location and adjustment notch number, distance between tools at their closest point, and working width. The table is divided into sections for single tools, two-stacked tools, and three-stacked tools. Each row lists specific tools, their positions, and corresponding measurements in centimeters. Notable trends include varying distances between tools and working widths, with the smallest distance being 2.5 cm and the largest working width being 51 cm. The table provides a comprehensive overview of the configurations and settings used in the experiments.
a Abbreviations: B, biodisc; F, finger weeder; H, tine harrow; L, L-sweep; P, precidisc; T, torsion weeder.
b Toolbars are available in four widths, 25, 40, 60, and 80 cm. These experiments were conducted using both 40- and 60-cm width bars. Notched spacings for adjusting tools are standard on all bars.
c Adjustment notch numbers are counted from the toolbar center.
d Measured at parts of tools closest to the crop row, the narrowest point of each single tool or stacked tool combinations at their optimal setting.
e Working width was determined by measuring across the widest point of each single tool or stacked tool combination at their optimal setting.
f Tool settings were the same for most tools when used with both bush bean and table beets, except for torsion weeders and harrows, which were moved away from the crop row center by one notch on the toolbar.
Given the uniformity of the field sites and lack of observed or anticipated gradients, experiments were established as a completely random design with three replications. Plots were 9.1 m long by 0.5 m wide with a single crop row. Tool treatments were randomly assigned to plots.
Bush bean was cultivated when the crop reached the 1-leaf stage, and table beet at the 1- to 2-leaf stage. At the time of cultivation, surrogate mustard was at the cotyledon to 1-leaf stage. One tool operator performed all treatments in all experimental runs to minimize operator error. Cultivating speed averaged 54 m s−1.
Data Collection
Three permanent 0.25-m2 sampling locations were randomly established in each plot and marked on each end by a wooden stake that was centered in the crop row. Quadrats, constructed 50 cm wide to match crop row spacing, were centered at the wooden stake over the crop row and precultivation crop density was recorded just prior to cultivation. Volumetric soil moisture was measured at three randomly selected intrarow locations in each plot using a Delta-T HH2 Moisture Meter with a Theta Probe (Delta-T Devices, Burwell, UK). Ambient and surrogate weed densities were also recorded for the 10-cm intrarow zone, marked with strings, and the outer interrow zones. Postcultivation crop, ambient, and surrogate weed densities were recorded approximately 24 h after cultivation to allow adequate time for weeds to desiccate.
Data Analysis
Efficacy was calculated using the following equation:
 $Efficacy = \left( {\left[ {Pre - Post} \right]/Pre} \right){\rm{x}} 100$
where Pre equaled the precultivation number of ambient or surrogate weeds, and Post equaled the postcultivation density of ambient or surrogate weeds. Efficacy was calculated at the sample level and then averaged (n = 3) prior to analyses. Because precultivation density of the 10-cm intrarow was very low, averaging 3.8 plants 500 cm−2 sampled area, intrarow, and interrow data were combined at the sample level to calculate efficacy.
Data were analyzed for analysis of variance using JMP software (v.14.0; SAS Institute Inc., Cary, NC). Model residuals were analyzed for normality using Shapiro-Wilk tests. Year and run were included as a random effect; tool was included as a fixed effect. Preplanned contrasts of tool number were conducted to test tool stacking effects. A regression tree analysis (Klimberg Reference Klimberg2023) was constructed with JMP software using efficacy as the response variable. Data are presented using box plots to accurately show the variability within and among treatments.
Results and Discussion
Weed Control Efficacy
Data Sets Included in Analyses
Quadrat samples with a precultivation density of ≤10 ambient or surrogate weeds were excluded from analyses to avoid misleading estimates of efficacy based on low precultivation densities (Vanhala et al. Reference Vanhala, Kurstjens, Ascard, Bertram, Cloutier, Mead, Raffaelli and Rasmussen2004). Based on this criteria, four bush bean data set and one table beet data set were sufficient for subsequent analysis (Table 1), with ambient or surrogate precultivation weed densities at the sample level ranging from 10 to 74 plants 0.25 m−2 (average was 30 plants 0.25 m−2).
Bush Bean
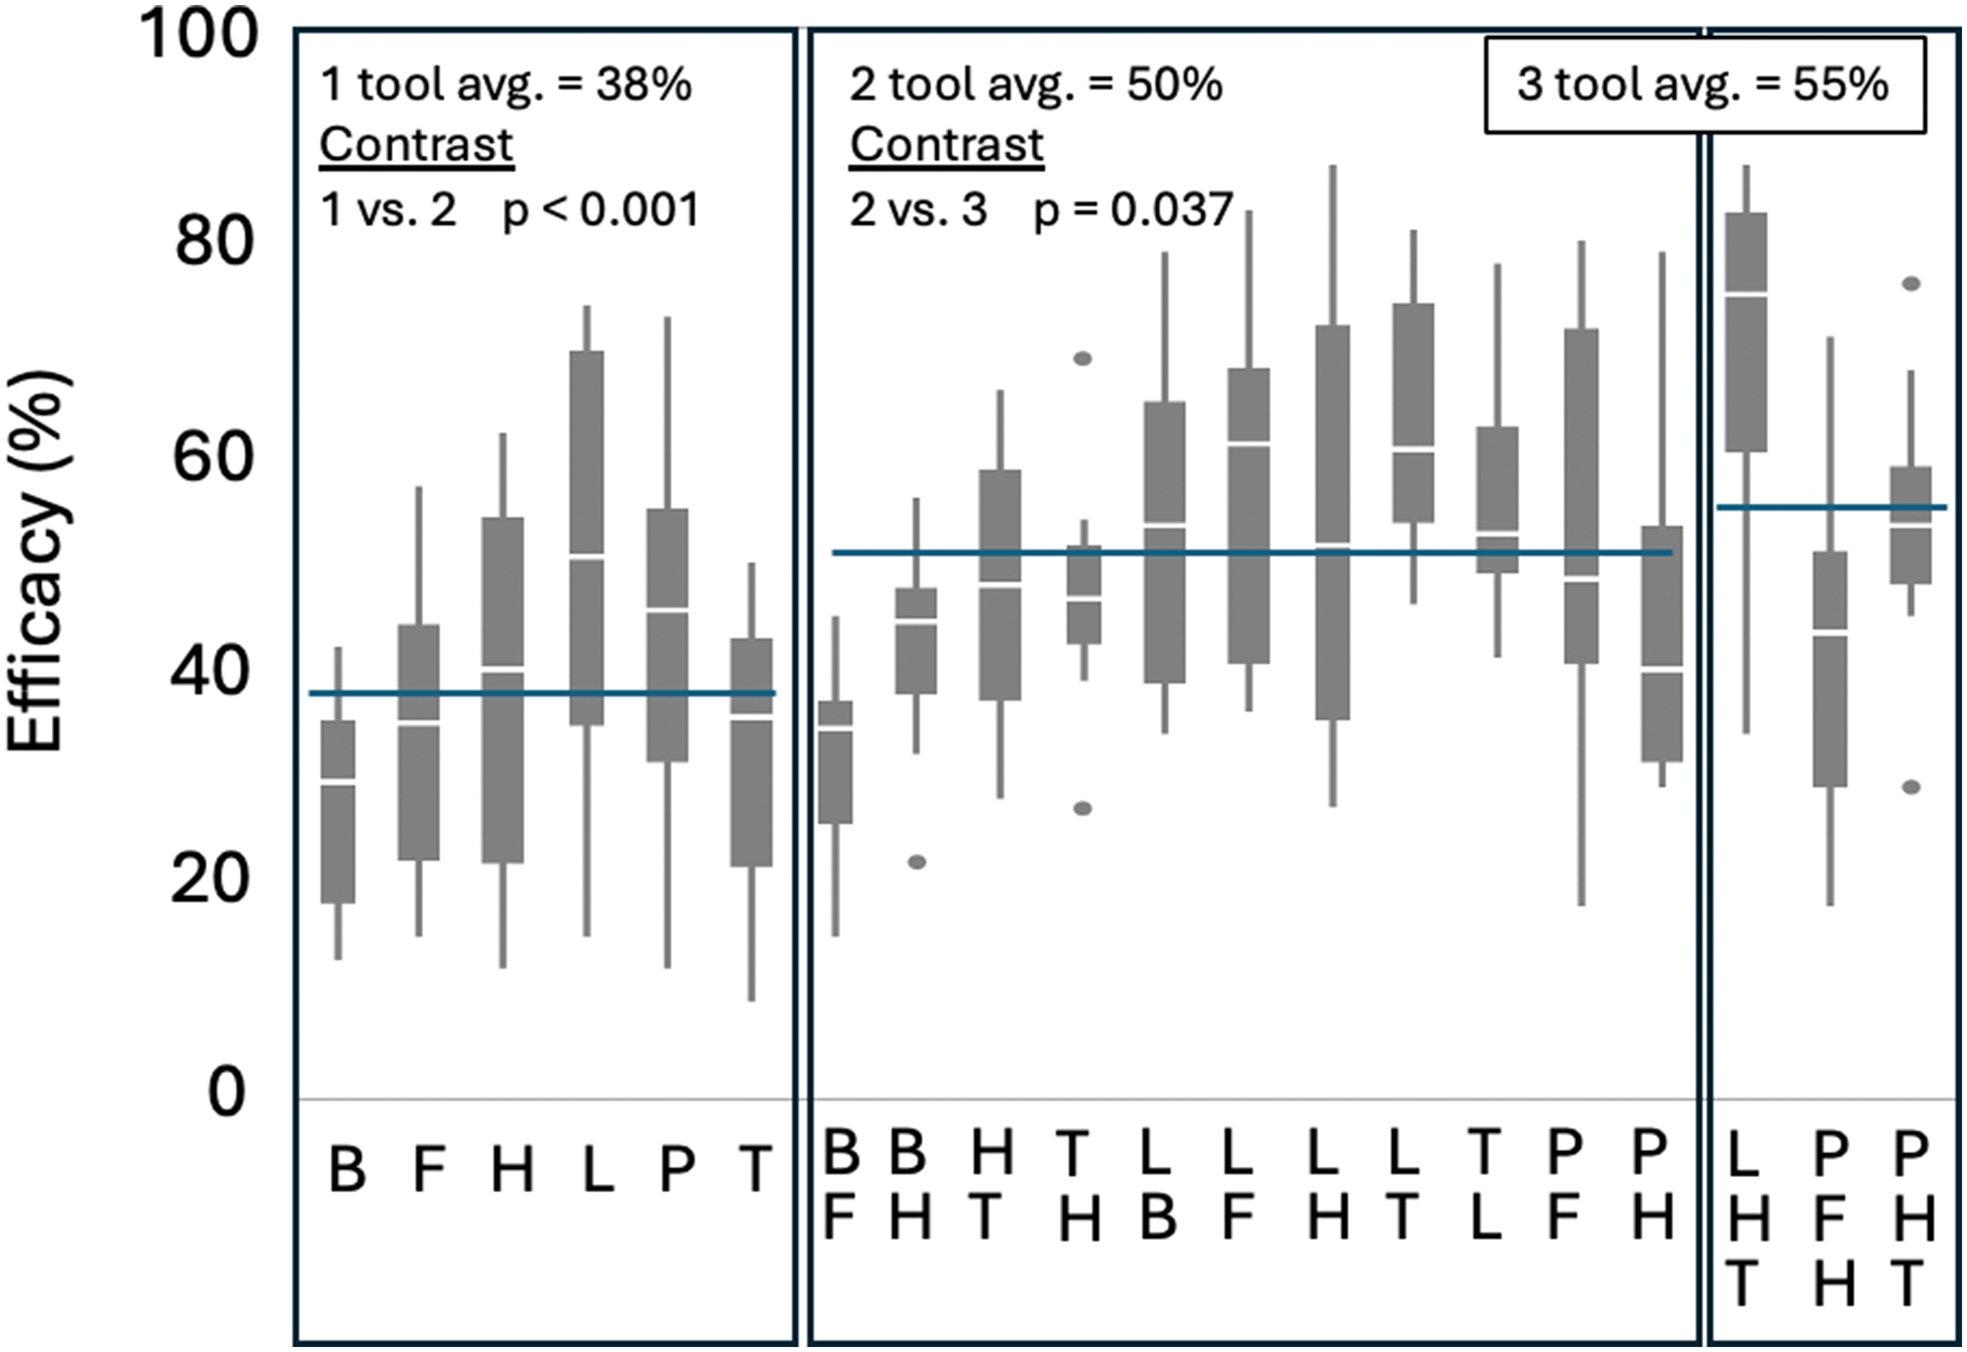
Tool treatment effects on efficacy in bush bean were consistent over both years (Year × Tool, P = 0.180) and runs (Run × Tool, P = 0.198). Analyses indicated no interaction between tool treatment and weed type (e.g., ambient vs. surrogate weeds; data not shown), so efficacy data were analyzed over year, run, and weed type (Figure 3). Consistent with the hypothesis that motivated this work, tool stacking increased efficacy from 38% for single tools to 50% with two-tool stacked combinations (1 vs. 2 tools, P < 0.001) (Figure 3). Adding a third tool improved efficacy by 5% (2 vs. 3 tools, P = 0.037), an effect driven by a single treatment, LHT (see Figure 3). Soil moisture, measured only in 2020, was poorly correlated with efficacy in both Run 1 (P = 0.406) and Run 2 (P = 0.680).
Weed control efficacy measured in four experiments conducted in bush bean in 2019 and 2020. Tool abbreviations include bio-discs (B), finger weeder (F), tine harrow (H), L-sweeps (L), precidiscs (P), and torsion weeders (T). Box plots show median center lines, upper and lower quartiles, with whiskers at 1.5× the interquartile; outliers are also shown. Horizontal blue lines in the three panels show mean values for single, two-stacked, and three-stacked tools.

Figure 3. Long description
Panel A: A box-and-whisker plot showing the efficacy of single tools. The horizontal axis represents different tools: bio-discs (B), finger weeder (F), tine harrow (H), L-sweeps (L), precidiscs (P), and torsion weeders (T). The vertical axis represents efficacy in percent, ranging from 0 to 100 percent. The median efficacy for single tools is approximately 38 percent. Panel B: A box-and-whisker plot showing the efficacy of two-stacked tools. The horizontal axis represents different combinations of two tools. The vertical axis represents efficacy in percent, ranging from 0 to 100 percent. The median efficacy for two-stacked tools is approximately 50 percent. Panel C: A box-and-whisker plot showing the efficacy of three-stacked tools. The horizontal axis represents different combinations of three tools. The vertical axis represents efficacy in percent, ranging from 0 to 100 percent. The median efficacy for three-stacked tools is approximately 55 percent. Each box plot shows the median, upper and lower quartiles, and whiskers extending to 1.5 times the interquartile range. Outliers are also shown. Horizontal blue lines indicate the mean efficacy for single, two-stacked, and three-stacked tools respectively.
Table Beet
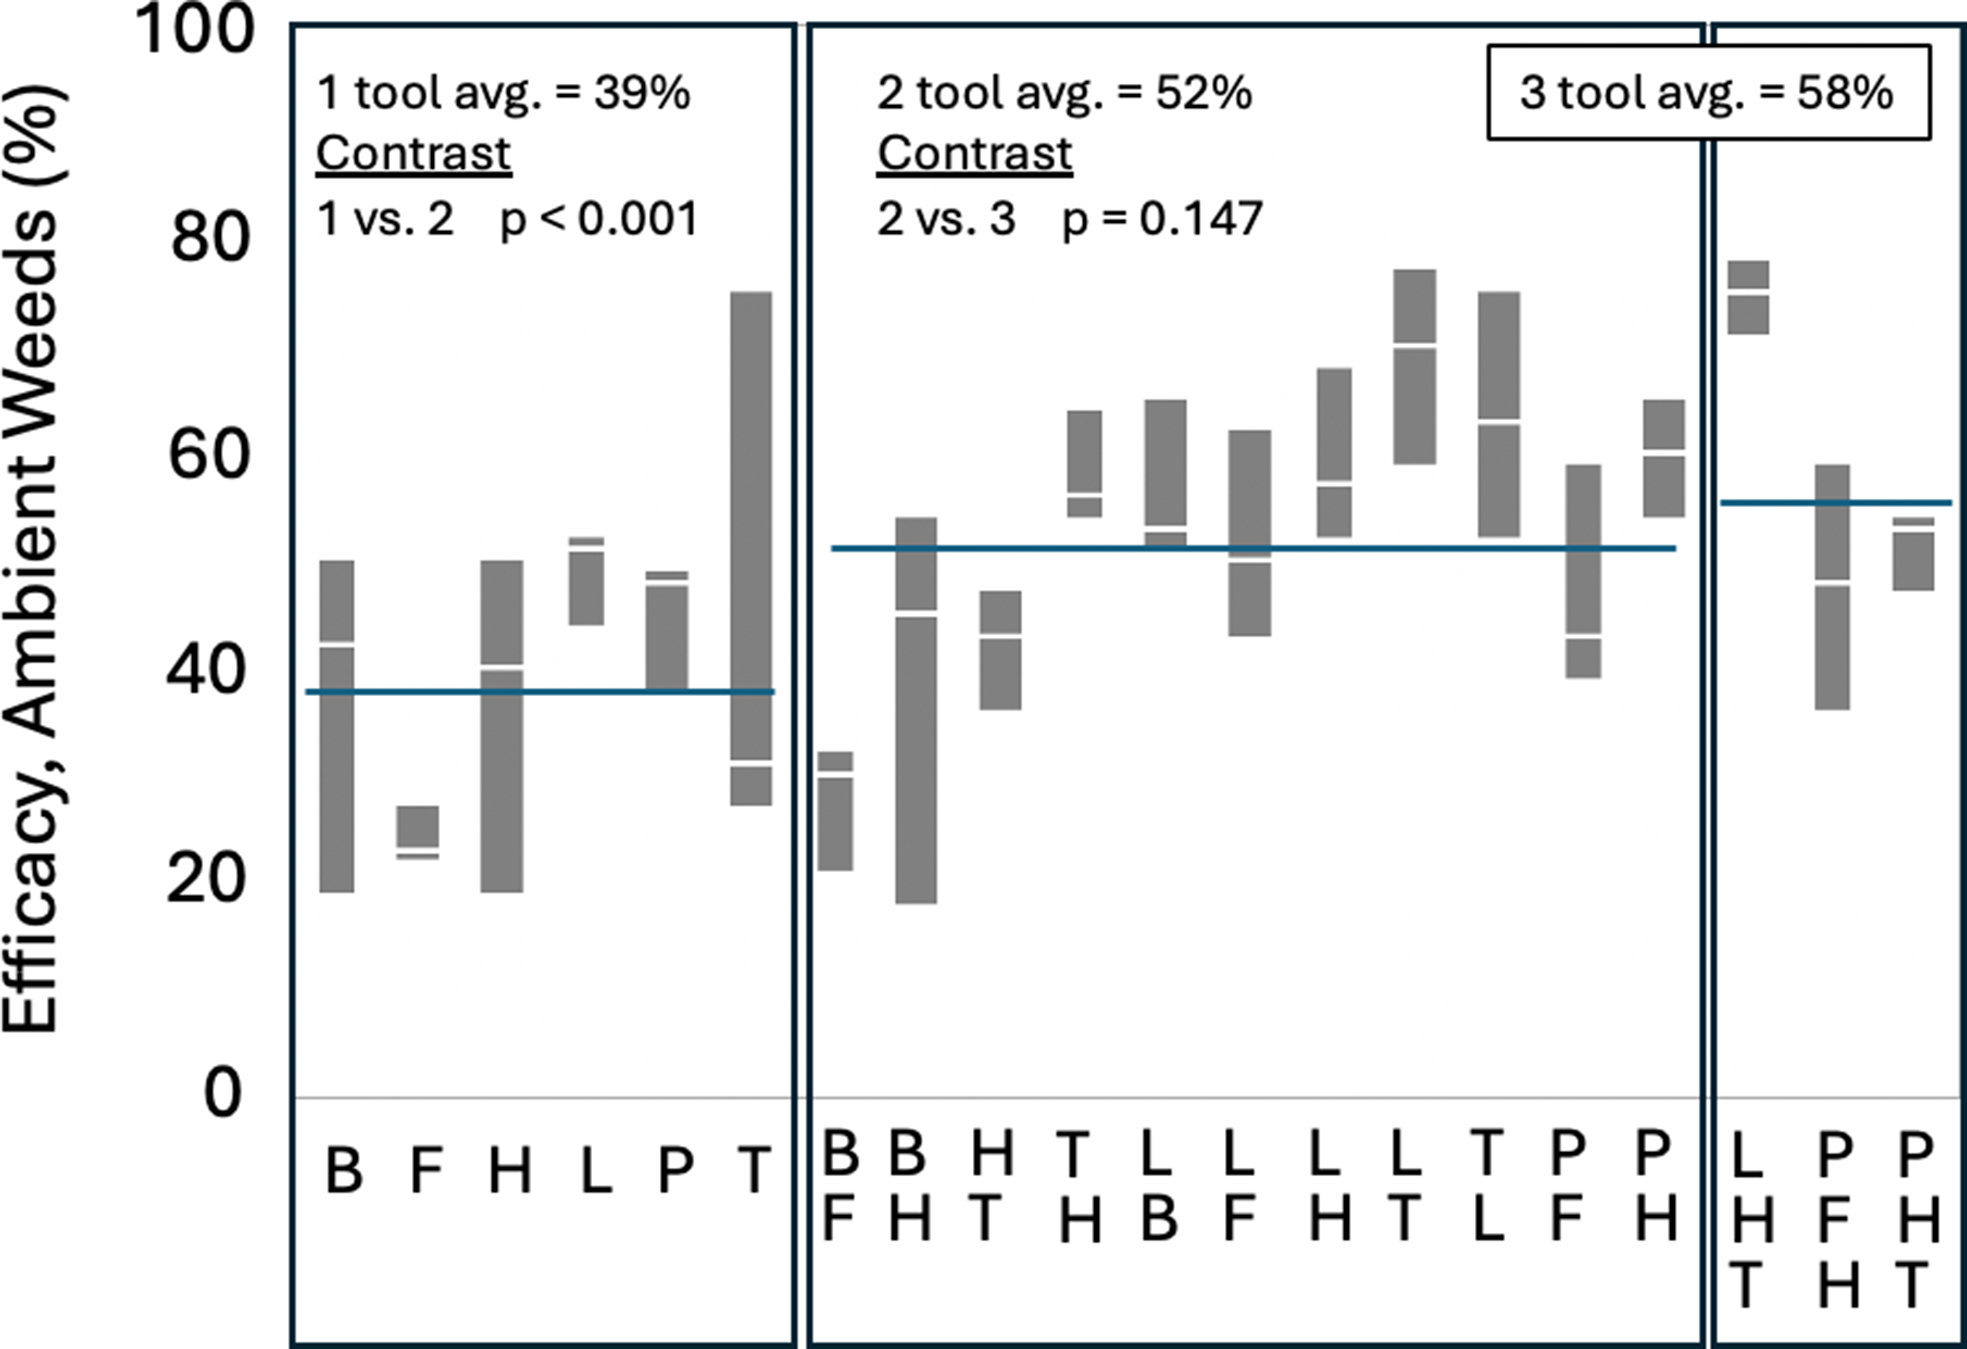
Heavy rain caused two table beet crop failures in 2019. Table beet crop stands were very good in 2020, but in Run 2, poor surrogate weed establishment and low ambient weed densities excluded this data set from our analyses (Table 1). Based on ambient weeds in Run 1, tool stacking benefits were evident in table beet crops (1 vs. 2 tools, P < 0.001; Figure 4), but without an advantage of adding a third tool (2 vs. 3 tools, P = 0.147). LHT, the top-performing stacked combination in bush bean (see Figure 3), was likewise a standout treatment in table beet (Figure 4). We were surprised to find that soil moisture was poorly correlated with efficacy in this experiment (P = 0.731). In other research, soil moisture was negatively correlated with efficacy (Brown and Gallandt Reference Brown and Gallandt2018; Mohler et al. Reference Mohler, Marschner, Caldwell and DiTommaso2016), as higher soil moisture likely slows desiccation of uprooted weeds.
Weed control efficacy measured in table beet in 2020. Tools include bio-discs (B), finger weeders (F), tine harrows (H), L-sweeps (L), precidiscs (P), and torsion weeders (T). Box plots show median center lines, upper and lower quartiles, with whiskers at 1.5× the interquartile; outliers are also shown. Horizonal blue lines in the three panels show mean values for single, two-stacked, and three-stacked tools.

The LHT combination had the greatest weed control efficacy in both bush bean (Figure 3) and table beet (Figure 4). L-sweeps in particular, and not stacking per se, was driving this effect. Regression tree analysis (data not shown) in bush bean resulted in a first split containing four treatments with L-sweeps (LF, LH, LT, and LHT) with an average efficacy of 69% ± 15% compared with 37% ± 11% for other tool treatments. Results in table beet were similar, with a first split including LH, LT, and LHT, with efficacy averaging 68% ± 9% compared with 41% ± 12% for other tool treatments. We speculate that the L-sweeps may have helped loosen soil and increased the effectiveness of the tool on the second toolbar. The stacking benefit of LHT could simply reflect a greater area of soil disturbance, 51 cm for this combination (Table 2). However, HT and TH treatments also had 51-cm working widths (Table 2), but offered poor efficacy compared with LHT. Thus, the L-sweep was pivotal to the success of the stacked treatments.
Crop Mortality
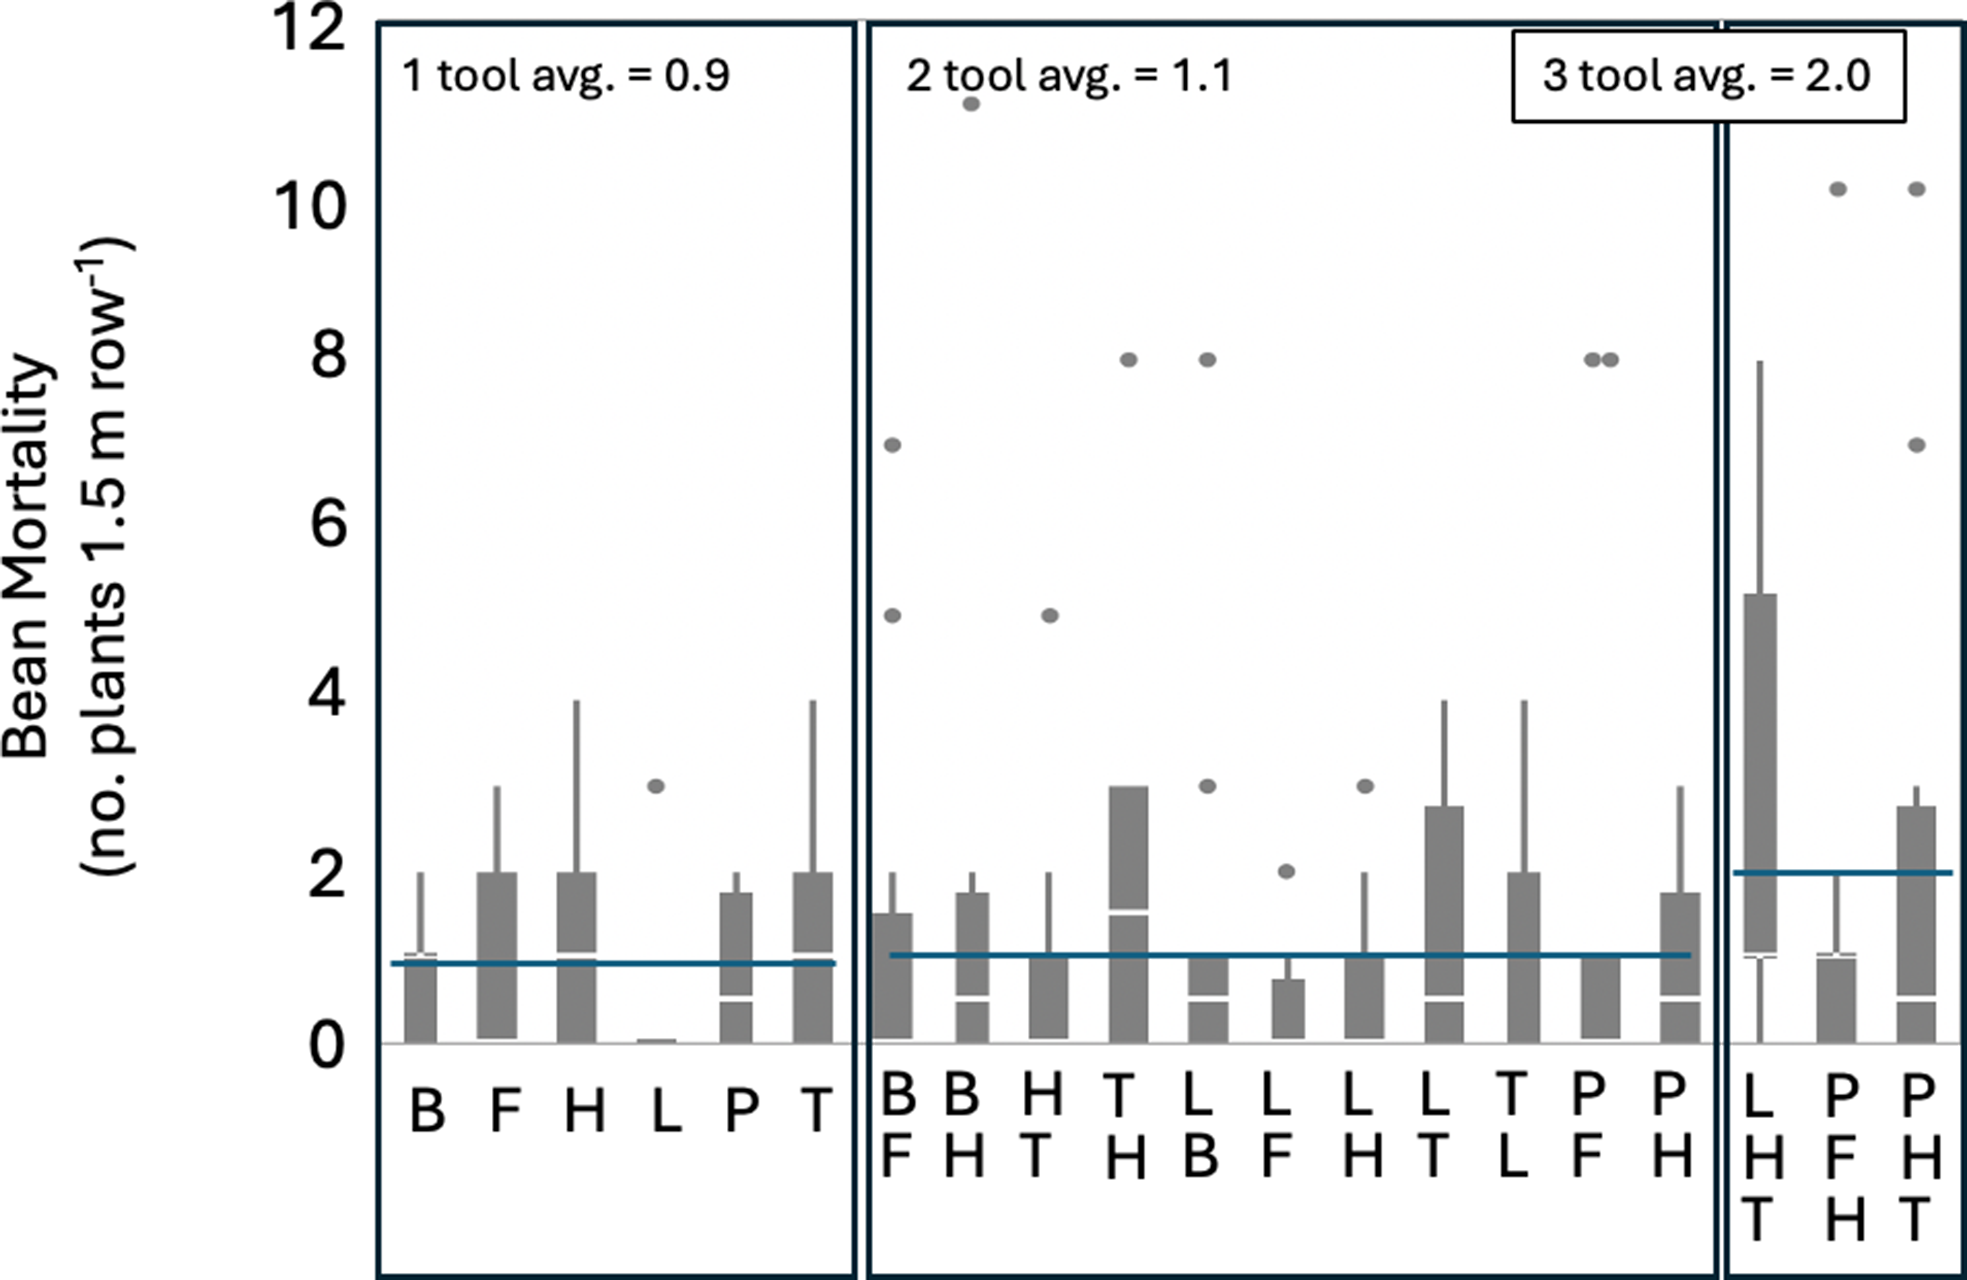
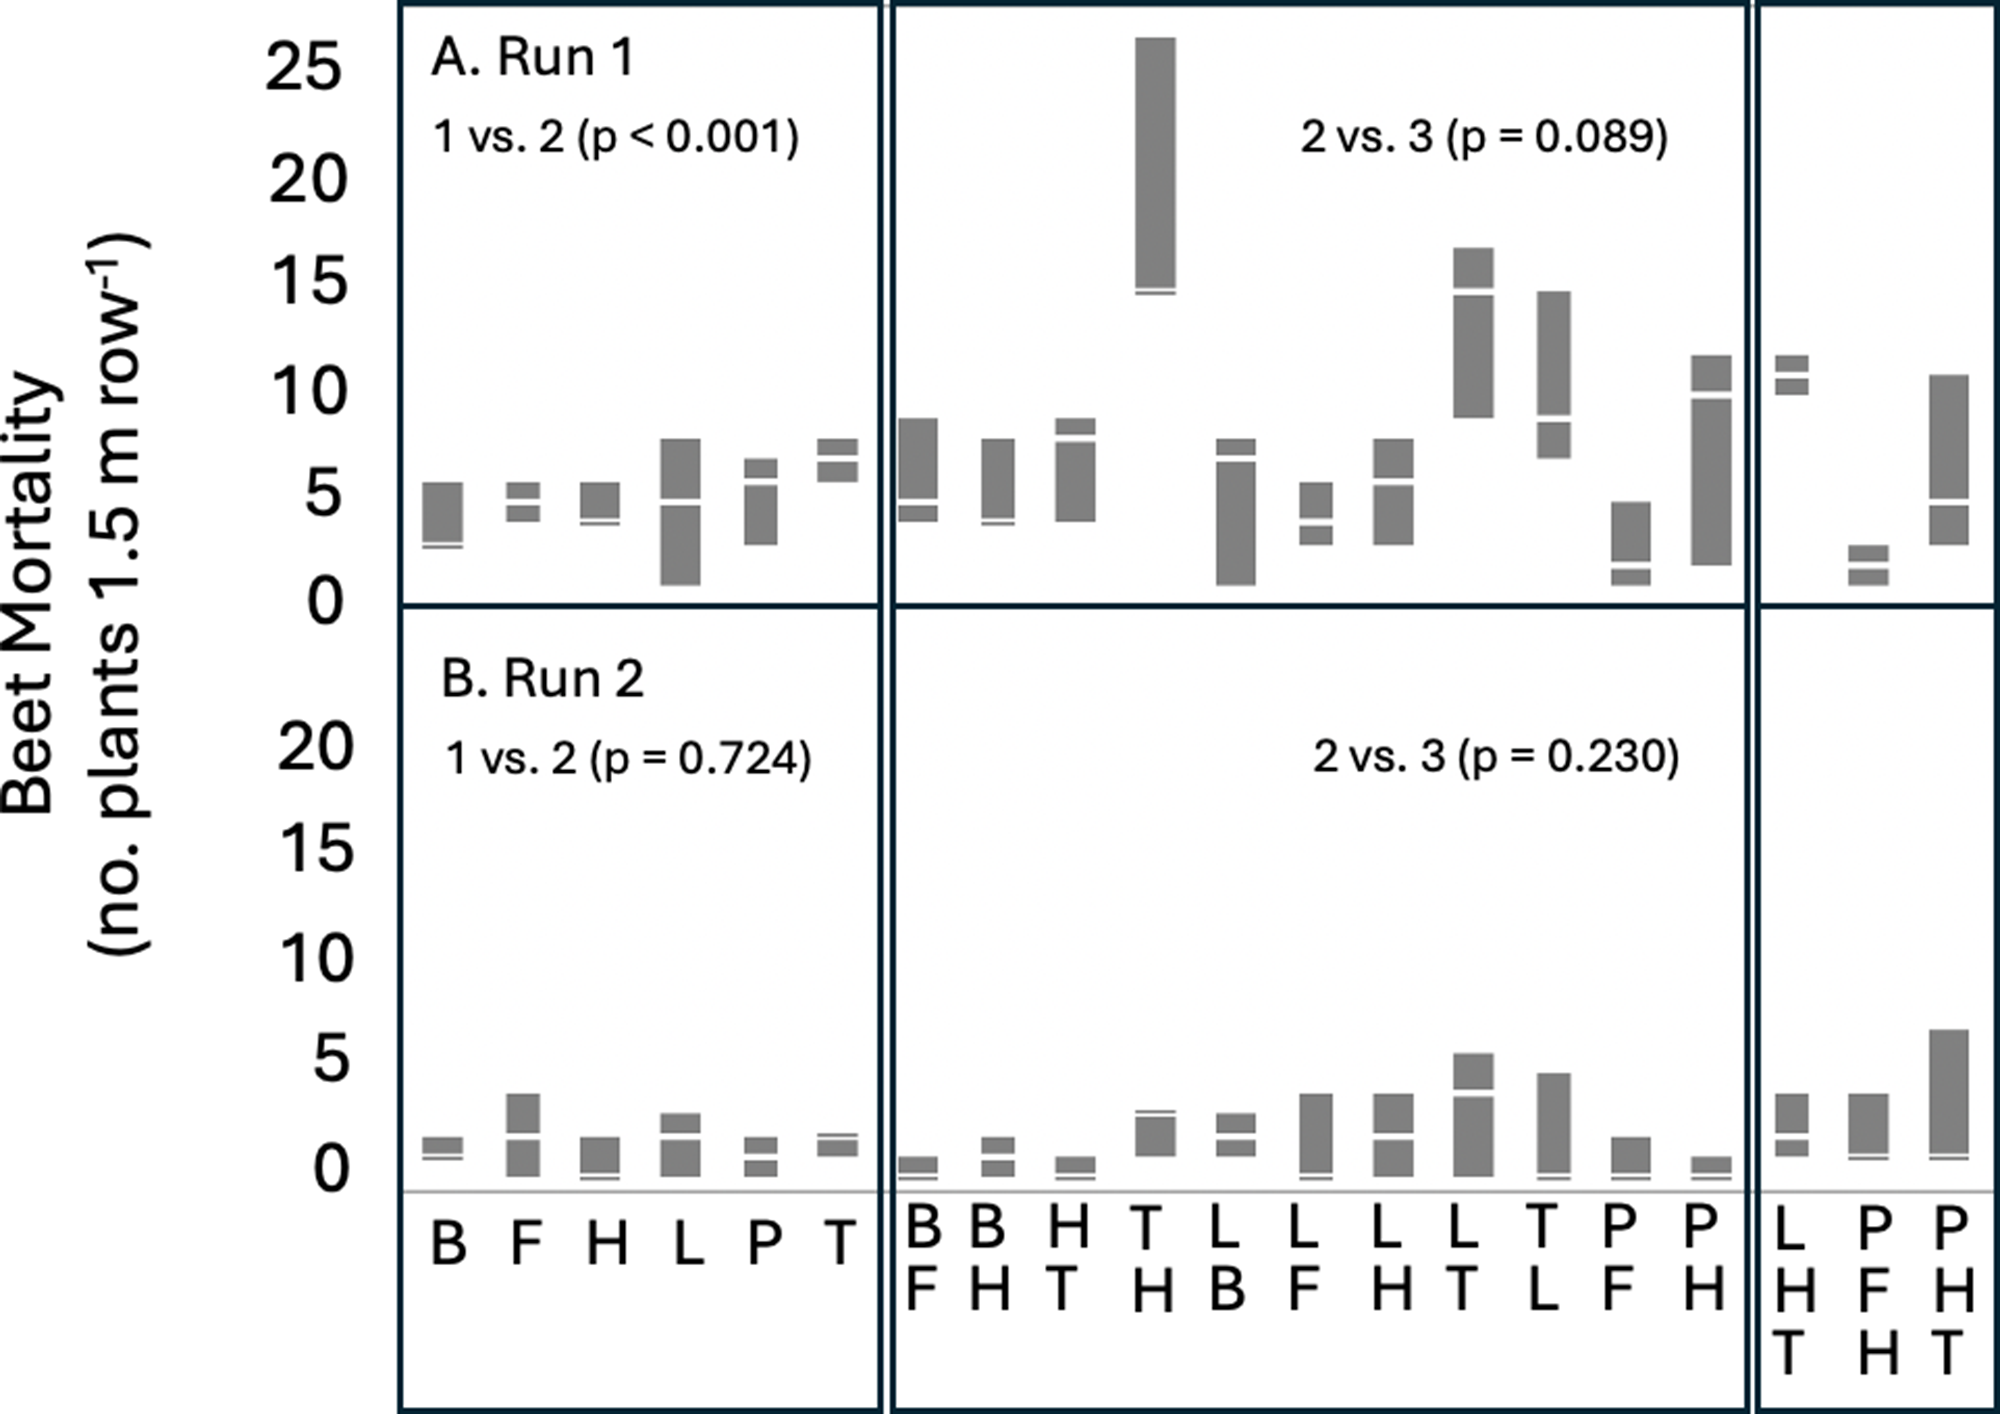
Bush bean mortality at the 1-leaf stage was not affected by tool treatment (P = 0.231); mortality averaged 0.9 to 2.0 plants killed per 1.5 m of crop row cultivated (Figure 5). Although we expected higher mortality from tool stacking, bush bean seedlings were relatively large and well-anchored at the time of cultivation. Table beet mortality, on the other hand, was approximately 4-fold greater than bush bean, and increased with tool stacking in Run 1, averaging a loss of 4.1 and 6.9 plants per 1.5 m of row cultivated with single and two-tool treatments, respectively (Figure 6A). Table beet mortality was lower in Run 2 and not affected by tool treatment, averaging a loss of 1.6 plants per 1.5 m of row cultivated (Figure 6B). The LHT combination, which provided the greatest level of weed control in both bush bean (Figure 3) and table beet (Figure 4), also caused the greatest table beet mortality (Figure 6A), highlighting the challenge of selectivity in sensitive crops. In table beet, cultivation was performed at the 1 true-leaf stage due to high weed densities. While the timing was appropriate given the weeds present, the crop was too small, leading to high mortality. Van der Weide et al. (Reference Van der Weide, Bleeker, Achten, Lotz, Fogelberg and Melander2008) recommended that directly cultivating the intrarow zone with tractor-mounted implements occur at the 3- to 4 true-leaf stage or greater to prevent high rates of injury.
Bush bean mortality measured in four experiments conducted in bush bean in 2019 and 2020. Mortality includes the sum of all plants killed over three 0.5-m-long samples totaling 1.5 m of crop row. Tools include bio-discs (B), finger weeders (F), tine harrow (H), L-sweeps (L), precidiscs (P), and torsion weeders (T). Box plots show median center lines, upper and lower quartiles, with whiskers at 1.5× the interquartile; outliers are also shown. Horizonal blue lines in the three panels show mean values for single, two-stacked, and three-stacked tools.

Table beet mortality measured in two experiments conducted in 2020. Mortality includes the sum of all plants killed over three 0.5-m-long samples totaling 1.5 m of crop row. Tools include bio-discs (B), finger weeders (F), tine harrows (H), L-sweeps (L), precidiscs (P), and torsion weeders (T). Box plots show median center lines, upper and lower quartiles, with whiskers at 1.5× the interquartile; outliers are also shown. Horizontal blue lines in the three panels show mean values for single, two-stacked, and three-stacked tools.

The wide range of attachments for the Terrateck double-wheel hoe were assumed to include a diversity of physical modes of action that would cause weed mortality by uprooting, cutting, or covering (i.e., burying) (Terpstra and Kouwenhoven Reference Terpstra and Kouwenhoven1981). Based on observation of the tools used in our experiments (Figure 2), we expect that tools would vary in these effects; for example, uprooting would predominate over tine harrows, torsion, and finger weeders, although L-sweeps would still be important for cutting purposes. In a thorough review of physical weed control, Chicouene (Reference Chicouene2007) concluded that weeds were ultimately killed by one of three mechanisms: direct lethal injury, exhaustion of reserves, or withering. It is possible that the combination of L-sweeps, tine harrows, and torsion weeders resulted in the highest levels of weed control (Figures 3 and 4) by combining optimal weed-uprooting and burial effects. As a mechanism, uprooting has received considerable attention, with empirical studies related to crops and weeds (Fogelberg and Dock Gustavsson Reference Fogelberg and Dock Gustavsson1999; Fogelberg and Gustavsson Reference Fogelberg and Gustavsson1998; Kurstjens et al. Reference Kurstjens, Perdok and Goense2000), and modeling efforts to predict efficacy and selectivity (Kurstjens Reference Kurstjens2004; Kurstjens et al. Reference Kurstjens, Kropff and Perdok2004). Connors and Brainard (Reference Connors and Brainard2025) recently adapted the anchorage force model presented by Kurstjens et al. (Reference Kurstjens, Kropff and Perdok2004) to include burial as an additional mechanism. Their model predicted uprooting as being most important for removing broadleaf weeds, but greater predicted efficacy would occur with grass weeds using burial tools. In contrast to our previous empirical evidence supporting tool stacking (Brown and Gallandt Reference Brown and Gallandt2018), the predicted efficacy of stacking had only a minimal effect on individual weed species, perhaps reflecting the complexities of tool, weed, crop, and soil interactions occurring in the field (Gallandt et al. Reference Gallandt, Brainard, Brown and Zimdahl2018b).
In summary, weed control efficacy increased with tool stacking in fields of both bush bean and table beet, which supports our tool stacking hypothesis and is also supported by previous tool stacking results (Brown and Gallandt Reference Brown and Gallandt2018; Hitchcock Tilton Reference Hitchcock Tilton2018). The LHT stacking resulted in greater efficacy and no difference in bush bean mortality, but this aggressive tool stacking treatment resulted in table beet mortality. Table beets need to be larger, likely the 2- to 3-leaf stage, when stacking tools are used to avoid a high level of crop mortality. Tool stacking can be applicable to hand tools such as the Terrateck and may help increase weed control efficacy, but crop growth stage and tool choice must be considered to prevent high crop mortality in small-seeded crops. Lastly, when stacking, the selection of tools and their sequence should be carefully considered and observed. Here we found L-sweeps to play a pivotal role in improving the performance of supporting tools.
Practical Implications
The Terrateck double-wheel hoe offers small-scale farmers access to individual and stacked tool combinations previously available only for larger, tractor-mounted applications. Stacking improved weed control efficacy in both a large-seeded, robust bush bean crop, and in a small-seeded, more tender crop of table beet. The average benefits of stacking were relatively modest, and perhaps not worth the trouble for many farmers. However, selected stacked combinations including L-sweeps consistently outperformed other tools, with an impressive 30% improvement in efficacy that could prove to be a significant improvement in weed control for many small-scale farmers.
Acknowledgments
We thank Rogers Farm Manager Joe Cannon and Sustainable Agriculture Research Associate Tom Molloy for their assistance, and University of Maine Weed Ecology Lab members Peyton Ginakes, Jordan Parks, Ruthie Clements, and Johnny Sanchez for their assistance and hard work during this project.
Funding
This work was supported in part by the U.S. Department of Agriculture–National Institute of Food and Agriculture (USDA-NIFA) via Hatch Project accession number 1006745, project number ME021606. This work was also supported by the USDA-NIFA Organic Agriculture Research and Extension Initiative grant program number 2018- 51300-28426.
Competing Interests
The authors declare they have no competing interests.

 Open access

