Introduction
The spectrum of solar UV emission is generally divided into the UVA (315–400 nm), the UVB (280–315 nm), the UVC (200–280 nm) and the VUV (<200 nm). Biological energy on today's Earth is mostly derived from photosynthesis. Currently, ozone blocks UV light below 300 nm but, in the distant past, primitive photosynthetic organisms probably had to cope with more energetic wavelengths in order to benefit from the light required to fix atmospheric carbon compounds. Since contemporary bacterial spores are killed after a short exposure to unfiltered solar UV in space (Horneck et al. Reference Horneck, Rettberg, Reitz, Wehner, Eschweiler, Strauch, Panitz, Starke and Baumstark-Khan2001), we need to explain how organisms adapted to UV liability on primitive Earth, in the absence of atmospheric oxygen and ozone.
Possibilities include a protective organic haze (Westall et al. Reference Westall, de Ronde, Southam, Grassineau, Colas, Cockell and Lammer2006), displacement within microbial mats (Bebout & Garcia-Pichel Reference Bebout and Garcia-Pichel1995) and accumulation of UV screens, e.g. scytonemin in cyanobacteria (Garcia-Pichel et al. Reference Garcia-Pichel, Sherry and Castenholz1992), that protect throughout the UV, but do not interfere with photosynthesis. Biological molecules of all sorts absorb UV light. They are thus potential UV screens, as well as targets for photodestruction. In the accompanying paper (Zalar et al. Reference Zalar, Tepfer, Hoffmann, Kenney and Leach2007), we used synchrotron light to examine UV absorption between 125 and 340 nm for a few of the potential UV screens that are ubiquitous in the cells of all organisms. DNA was considered to be the principal target. In this paper we apply the same approach to known UV screens from a variety of organisms.
DNA absorbs in three regions: I (with a peak at 260–264 nm), II (with a peak at 192 nm) and III (below 125 nm). Dehydration shifts the peak in region I to longer wavelengths (from 260 to 264 nm), and this peak could also shift to longer wavelengths with increased frequency of the guanine–cytosine (GC) base pair, which is also considered to be more stable than the adenine–thymine (AT) base pair (see the accompanying paper). Solar emission declines to essentially zero at 125 nm; thus absorption peaks corresponding to regions I and II would be the major source of UV liability.
We present here thin-film VUV-UV absorption spectra for known UV screens: scytonemin, mycosporin-like amino acids, dipicolinic acid, β-carotene, melanin and flavonoids (quercitrin, isoquercitrin, robinin and catechin). They are evaluated according to the degree of spectral similarity between the screen and the target DNA. The results are discussed with reference to the origin and evolution of life and the possibility of dispersal of life via directed exospermia.
Methods
The flavonoids analysed in this study were: quercitrin (quercitin-3-O-rhamnoside), isoquercitrin (quercetin-3-β-D-glucoside), robinin (kaempferol-3-O-robinoside-7-O-rhamnoside) and (+)-catechin (+)-3,3′,4′,5,7-pentahydroxyflavan). Standard solutions (3 mg ml−1) of quercitrin (Sigma-Aldrich, France), isoquercitrin (Fluka, France) and catechin (Extrasynthese, France) were prepared in 100% (v/v) methanol, while robinin (Extrasynthese, France) was prepared as an aqueous solution (1 mg ml−1). Dipicolinic acid (DPA, 2,6-pyridinedicarboxylic acid) was purchased from Sigma-Aldrich, France. A standard solution (4 mg ml−1) of DPA was prepared in 100% (v/v) methanol. The calcium chelate of DPA (Ca-DPA) was made by mixing (1:1) equimolar volumes of the DPA standard solution and aqueous solution of CaCl2 (2.4×10⁻² M). Melanin (Sigma-Aldrich, France) was purchased as synthetic melanin, made by the oxidation of tyrosine with hydrogen peroxide. A standard solution (1 mg ml−1) of melanin was prepared in 1 N NH4OH. A standard solution (1 mg ml−1) of β-carotene (Extrasynthese, France) was prepared in 100% ethyl acetate and stored at −20°C, protected from light. Chlorophyll a and b (from spinach) were purchased from Fluca (France). Stock solutions (0.5 mg ml−1) were prepared in absolute ethanol.
Scytonemin was extracted from UVA induced cells of the cyanobacterium, Chroococcidiopsis CCMEE 5056, kindly provided by R. Castenholtz. The UV induced and control (non-induced) cells of Chroococcidiopsis were collected by centrifugation and pellets were kept frozen in the dark. Thawed cells were oven dried at 50°C for 1 h, then homogenized in 3 ml acetone (100% v/v) by sonication (VibraCell, Sonics & Materials, Danbury CT), while cooling on ice and protected from light. The resulting suspension was kept at 4°C for 20 h in the dark. The extracts were centrifuged and about 3 ml of yellow supernatant, containing scytonemin, were collected and stored at −20°C. The scytonemin was further purified by high-performance liquid chromatography (HPLC). The acetone from the crude extracts was removed by evaporation under a stream of nitrogen and dry residues were dissolved in 100% (v/v) acetonitrile. The separation of the compounds by HPLC was performed on a Waters 600 multisolvent delivery system, using a Kromasil C18 column (250×4.6 mm2 i.d., 5 μm particle size, Alltech, France). The mobile phase comprised the mixture of solvent A (pure water) and solvent B (acetonitrile: methanol: tetrahydrofuran, 75:15:10, v/v/v) at a flow rate of 1 ml ml−1 and a linear gradient of solvents A:B (70:30, v/v) from 0 to 10 min, changing to 0:100 (v/v) after 20 min and ending with the initial conditions A:B (70:30 v/v) for 10 min. The chromatographic and spectral data were acquired with a Waters 990 photodiode array detector set at 388 nm and HPLC fractions were collected.
The scytonemin fraction was identified by its characteristic UV absorption spectrum (Proteau et al. Reference Proteau, Gerwick, Garcia-Pichel and Castenholz1993; Sinha & Hader Reference Sinha and Hader2002). Purified scytonemin was dried under a stream of nitrogen, quantified and dissolved in 100% (v/v) ethyl acetate, yielding 0.5 mg ml−1. The presence of scytonemin in the prepared sample and its purity were further confirmed by mass spectrometry (see below).
Liquid chromatography–mass spectroscopy (LC-MS) was performed using an Alliance 2695 (Waters, USA) reverse phase HPLC system coupled to a Quattro LC mass spectrometer (MicroMassCo, Manchester, UK) with an electrospray ionization interface. Data acquisition and analyses were performed by MassLynx software. Chromatography was carried out on a C18 Uptisphere column (150×2 mm2, i.d., 5 μm particle size; Interchrom, France), connected to a Waters 2487 UV detector set at 252 nm and 386 nm. The mobile phase, at a flow rate of 0.15 ml min−1, contained the mixture of two solvents, acetonitrile and water, both acidified with 0.5% (v/v) acetic acid. The gradient profile comprised initial conditions (acetonitrile:water, 2:98 v/v) for 5 min, linear gradient up to 100:0 v/v acetonitrile:water for 25 min and a rinsing step (acetonitrile:water, 100:0 v/v) for 10 min. Prior the LC-MS analysis, the solvent ethyl acetate was removed from the scytonemin sample by evaporation under a stream of nitrogen and replaced by acetonitrile, as a more suitable solvent for liquid chromatography. The 5 μl aliquot of the 10 times diluted scytonemin fraction was injected and data were acquired for both positive and negative ionization modes.
LC-MS results showed that the HPLC fraction of the cyanobacteria extract, further used for absorption analysis, contained high amounts of well-purified scytonemin. Strong signals of [M+H]+ ion at mass-to-change ratio (m/z) 545 in positive mode and [M+H]− ion at m/z 543 in negative mode were observed, confirming the presence of scytonemin (molecular weight 544). Moreover, the ion at m/z 273 was observed in the positive mode, resulting from the fragmentation of the scytonemin molecule into two symmetric halves. Beside the common form of scytonemin, which was dominant (93%) in the sample, small amounts (7%) of the reduced form were also observed, confirming a previous report (Squier et al. Reference Squier, Hodgson and Keely2004). A reduced form of scytonemin was commonly found in the anoxic layers of microbial mats (Garcia-Pichel & Castenholz Reference Garcia-Pichel and Castenholz1991; Proteau et al. Reference Proteau, Gerwick, Garcia-Pichel and Castenholz1993).
Two mycosporine-like amino acid samples, MAA-6 and MAA-9, isolated from the marine red algae, Corallina officinalis, and prepared in 0.2% (v/v) acetic acid, were kindly provided by the group of D.-P. Häder. Conventional (LC-MS) and tandem mass spectrometry (LC-MS-MS) were performed in order to determine the type of mycosporine-like acid present in the MAA-6 and MAA-9 samples (Whitehead & Hedges Reference Whitehead and Hedges2003). The LC-MS system is described above.
10 μl aliquots of 10 times diluted MAA-6 and MAA-9 samples were eluted on an Uptisphere C18 column (150×2 mm2, i.d., 5 μm particle size; Interchrom, France) with a mobile phase that was composed of solvent A (acetonitrile:water, 95:5, v/v, 0.2% acetic acid) and solvent B (water:acetonitrile, 95:5, v/v, 0.2% acetic acid) at a flow rate of 0.15 ml min−1. The gradient profile comprised initial conditions (A:B, 0:100 v/v) for 5 min, linear gradient up to 100:0 v/v, A:B for 50 min and a rinsing step (A:B, 100:0 v/v) for 5 min. Absorption was measured continuously at 290 nm and 259 nm.
Mass spectra showed that the MAA-9 sample contained porphyra-334 (molecular weight 346), forming a [M+H]+ ion at m/z 347 and a [M+H]− ion at m/z 345 in positive and in negative modes, respectively. Besides porphyra-334, as a major component, small amounts of shinorine (molecular weight 332) and palythinol (molecular weight 302) were detected. Shinorine and palythinol gave the signal only in positive mode, forming [M+H]+ ions at m/z 333 and 303, respectively. Traces of unidentified molecules that gave the [M+H]+ ions at m/z 163, 205, 223, 255 and 279 were also detected, and they were thought to be impurities.
Fraction MAA-6 contained the same impurities found in fraction MAA-9. The MAA palythine (molecular weight 244) that formed a [M+H]+ ion at m/z 245 in positive mode was also detected, but in small amounts in the MAA-6 sample. The presence of porphyra-334 in MAA-9, and palythine in MAA-6 was further confirmed by tandem LC-MS-MS, comparing the characteristic fragmentation patterns with those previously reported (Whitehead & Hedges Reference Whitehead and Hedges2003). Although MAA-6 and MAA-9 contained trace amounts of impurities, their absorption spectra, which were obtained by conventional spectrophotometry in solution (the results are not presented), showed λmax=320 nm for MAA-6 and λmax=334 nm for MAA-9, which are characteristic absorption maxima for porphyra-334 and palythine, respectively (Takano et al. Reference Takano, Uemura and Hirata1978, Reference Takano, Uemura and Hirata1979; Sinha et al. Reference Sinha, Klisch, Gröniger and Häder1998).
The VUV-UV absorption spectra, in the 125–340 nm region, were obtained using the UV1 beamline (Eden et al. Reference Eden, Limão-Vieira, Hoffmann and Mason2006) at the Synchrotron Radiation source ASTRID, Institute for Storage Ring Facilities, University of Aarhus, Denmark. The resulting spectra were based on the measurements of UV light transmitted through the sample, which was dried onto a MgF2 window (diameter 23 mm). The installation and the measurement technique are described in detail in the accompanying paper (Zalar et al. Reference Zalar, Tepfer, Hoffmann, Kenney and Leach2007). Recorded spectra were the result of absorption and scattering. For the sake of simplicity and the small contribution of scattering to the optical density, the obtained spectra in this study are called absorption spectra. The scattering problems of dry films are discussed in the accompanying paper. Since most of the samples were prepared in organic solvents that absorb UV light below 200 nm, the absorption spectra were measured in a vacuum, with the samples prepared as thin, solid films.
Dry films of the melanin and flavonoid samples (quercitrin, isoquercitrin, robinin and catechin) were produced by air-drying 500 μl of each diluted standard solution (0.1 mg ml−1) on the surface of a MgF2 window. Two dilutions of the β-carotene standard solution, 0.5 mg ml−1 (high concentration) and 0.125 mg ml−1, were prepared in ethyl acetate, with 300 μl and 250 μl dried on a MgF2 window, respectively. The solution of Ca-DPA chelate was diluted in 50% (v/v) methanol and 500 μl of a 0.4 mg ml−1 solution was air-dried on a MgF2 window. The MAA-6 and MAA-9 samples, containing mycosporine-like amino acids (MAAs), were prepared in 0.2% acetic acid. 500 μl of each (MAA-6 and MAA-9) were dried on MgF2 windows. The solid film of scytonemin was prepared by drying 900 μl of the sample solution, which contained purified scytonemin (0.5 mg ml−1), in ethyl acetate, onto MgF2 windows.
In order to exclude the background absorption by the remaining traces of solvents in the dry samples, 500 μl of water (pH 7), 0.2% (v/v) acetic acid, 1 N NH4OH, 100% (v/v) methanol, 100% (v/v) ethyl acetate and a solution of CaCl2 (1.2×10⁻² M) in 50% methanol were dried onto MgF2 windows and the absorption was measured. No absorption or a weak absorption signal was detected for all tested solvents.
Results
UV absorption by scytonemin and mycosporine-like amino acids
Following exposure to UVA, scytonemin accumulates as a yellow pigment in sheathed cyanobacteria (Garcia-Pichel et al. Reference Garcia-Pichel, Sherry and Castenholz1992). Scytonemin (see Fig. 1) consists of four benzene rings and four five-member rings (Proteau et al. Reference Proteau, Gerwick, Garcia-Pichel and Castenholz1993). The published UV absorption spectrum for scytonemin in solution (Proteau et al. Reference Proteau, Gerwick, Garcia-Pichel and Castenholz1993; Sinha et al. Reference Sinha, Klisch, Gröniger and Häder1998) shows peaks at 212, 252, 278, 300 and 386 nm, with the major peaks at 252 and 386 nm. We used HPLC to purify scytonemin from UVA-induced cyanobacteria, kindly provided by R. Castenholtz. Conventional solution UV spectroscopy (not shown) confirmed peaks at 211, 253, 298 and 388 nm, with major peaks at 253 and 388 nm. Our far-UV spectrum of thin films showed peaks at 195 and 253 nm, and below 195 nm, absorbance climbed strongly to 125 nm, the end of the spectrum (Fig. 2).
Chemical structures of the UV screens, used in VUV-UV absorption spectroscopy: (a) scytonemin and MAAs – porphyra-334 and palythine; (b) DPA; (c) β-carotene; (d) subunits of melanin (eumelanin) – 5,6-dihydroxyindole 2-carboxylic acid (DHICA), 5,6-dihydroxyindole (DHI), pyrrole-2,3-dicarboxylic acid and pyrrole-2,3,5-tricarboxylic acid; (e) flavonoids – quercitrin, isoquercitrin, robinin and (+)-catechin.

VUV-UV absorbance spectrum of (a) scytonemin (0.45 mg per sample) and (b) two mycosporine-like amino acids, MAA-6 (containing palythine and impurities – see the Methods section) and MAA-9 (essentially containing porphyra-334). The DNA spectrum is included for reference.

The MAAs (Fig. 1) are diverse structures that include a six-carbon ring (cyclohexenone or cyclohexenimine), conjugated with the nitrogen of an amino acid or its imino alcohol (Nakamura et al. Reference Nakamura, Kobayashi and Hirata1982; Sinha et al. Reference Sinha, Klisch and Hader1999; Shick & Dunlap Reference Shick and Dunlap2002). Their absorption maxima range from 310 to 360 nm (Nakamura et al. Reference Nakamura, Kobayashi and Hirata1982). MAAs accumulate in response to UV exposure in certain cyanobacteria and algae (Garcia-Pichel et al. Reference Garcia-Pichel, Wingard and Castenholz1993; Sinha & Hader Reference Sinha and Hader2002). MAAs have also been found in heterotrophic bacteria, fungi, lichens and in a variety of marine invertebrates and vertebrates (Shick & Dunlap Reference Shick and Dunlap2002). VUV-UV absorption spectra (Fig. 2) were qualitatively similar for two mycosporine-like amino acids, palithyne (MAA-6) and porphyra-334 (MAA-9), generously provided by the group of D.-P. Häder. MAA-6 showed absorbance at 164 and 195 nm (with a weak peak at 300 nm), while MAA-9 absorbed at 164, 192 and 340 nm. Published solution spectra show strong absorbance in the UVB (Sinha et al. Reference Sinha, Klisch, Gröniger and Häder1998).
UV absorption by dipicolinic acid
DPA (2,6-pyridinedicarboxylic acid) is located in the Bacillus subtilis spore core as a 1:1 chelate with divalent cations, predominantly Ca2+ (Murrell Reference Murrell1967; Setlow et al. Reference Setlow, Atluri, Kitchel, Koziol-Dube and Setlow2006). It comprises about 10% of the dry weight of the spores (Murrell Reference Murrell1967; Setlow Reference Setlow1994; Paidhungat et al. Reference Paidhungat, Ragkousi and Setlow2001; Slieman & Nicholson Reference Slieman and Nicholson2001). DPA is a substituted six member ring, carrying a single nitrogen in the ring (Setlow et al. Reference Setlow, Atluri, Kitchel, Koziol-Dube and Setlow2006) (Fig. 1). The calcium chelate (Ca-DPA) was used for spectroscopy. DPA protects spores from wet heat, probably by reducing water content (Setlow et al. Reference Setlow, Atluri, Kitchel, Koziol-Dube and Setlow2006). DPA can act either as a UV protector (Berg & Grecz Reference Berg and Grecz1970; Grecz et al. Reference Grecz, Tang and Frank1973; Slieman & Nicholson Reference Slieman and Nicholson2001) or as a UV photosensitizer (Germaine & Murrell Reference Germaine and Murrell1973; Lindsay & Murrell Reference Lindsay and Murrell1983; Setlow & Setlow Reference Setlow and Setlow1993), promoting formation of spore photo product in damaged DNA (Douki et al. Reference Douki, Setlow and Setlow2005; Setlow et al. Reference Setlow, Atluri, Kitchel, Koziol-Dube and Setlow2006). We chose DPA (Ca-DPA) for VUV-UV spectroscopic studies, because of the high amounts of Ca-DPA present in the spores, the low content of water in the spore core (25–55%) and the complex role of DPA in the photochemistry of spore DNA (Douki et al. Reference Douki, Setlow and Setlow2005).
The UV absorbance spectrum of DPA thin films showed peaks at 151, 195, 231, 273 and 281 nm (Fig. 3). It should thus protect DNA in region II, but not in region I, unless region I absorption were shifted to longer wavelengths, e.g. due to a high content of GC, see the accompanying paper (Zalar et al. Reference Zalar, Tepfer, Hoffmann, Kenney and Leach2007). Additional absorption in the UVB and UVA was not seen, and this was confirmed using conventional solution spectrophotometry (unpublished results).
VUV-UV absorption spectrum of DPA, analysed as a chelate with calcium (Ca-DPA) (0.2 mg per sample). The DNA spectrum is included for reference.

UV absorption by β-carotene and melanin
Carotenoids are isoprenoid compounds, found in many photosynthetic organisms and in some non-photosynthetic bacteria (Armstrong Reference Armstrong1994; Duc le et al. Reference Duc le, Fraser, Tam and Cutting2006). They accumulate following UV stress, and are generally considered to protect against UV by acting as antioxidants. β-carotene consists of two six-carbon rings at opposite ends of a polyene chain (Fig. 1). This structure suggested an appropriate UV screen for DNA in the UVC region. The absorption spectrum showed peaks at 195 and 277 nm (Fig. 4). β-carotene should thus protect DNA region II, but would afford less protection for DNA region I, unless absorption by region I is shifted to higher wavelengths owing to high GC content, see the accompanying paper (Zalar et al. Reference Zalar, Tepfer, Hoffmann, Kenney and Leach2007).
VUV-UV absorption spectra of β-carotene (0.03 mg per sample) and melanin (0.05 mg per sample). The primary axis gives absorbance for β-carotene and the secondary for melanin and DNA. A spectrum with β-carotene at higher concentration (0.15 mg per sample) is included to show the peak at 277 nm. The DNA spectrum is included for reference.

Melanin pigments are widely distributed in the animal and plant kingdoms, and they are found in some bacteria (Hinojosa-Rebollar et al. Reference Hinojosa-Rebollar, Rangel-Mandujano, Ortigoza-Ferado, Mesta-Howard and Hernandez-Rodriguez1993). Besides photoprotection as their primary biological function, melanins have chemoprotective roles as free radical scavengers and antioxidants (Riley Reference Riley1997). There are two types of animal melanins, eumelanin (black-brown) and pheomelanin (yellow-reddish). The precise structure of natural melanin is not known, because of its poor solubility and its association with proteins and lipids. Melanin is thus considered to be a highly irregular heteropolymer, containing indoles and other intermediate products derived from the oxidation of tyrosine (Pezzella et al. Reference Pezzella, Napolitano, d'Ischia, Prota, Seraglia and Traldi1997; Riley Reference Riley1997). It has been suggested that eumelanins form nano-aggregates that contain a mixture of smaller oligomers (Clancy et al. Reference Clancy, Nofsinger, Hanks and Simon2000), composed of 5,6-dihydroxyindole 2-carboxylic acid (DHICA) and 5,6-dihydroxyindole (DHI) derivatives linked with pyrrole units (Wakamatsu & Ito Reference Wakamatsu and Ito2002). The chemical structures of the main building units of melanin are presented in Fig. 1.
Our absorption spectrum (Fig. 4) of a dry film of melanin showed uniform absorption in the studied spectral region, with an exponential increase of absorbance towards lower wavelengths and two small peaks at 161 and 186 nm. Melanin should thus provide non-specific UV protection over a wide range of wavelengths. A characteristic broad band absorption of melanins in the UV and visible part of the spectrum with an exponential increase of absorbance in the UV was previously reported (Meredith & Riesz Reference Meredith and Riesz2004). The monotonic absorption profile with no specific features can be explained by the complexity of the melanin structure. Rather than a single chromophore, melanins appear to be composed of groups of similar species, giving a smooth, featureless exponential curve (Meredith et al. Reference Meredith, Powell, Riesz, Nighswander-Rempel, Pederson and Moore2006).
UV absorption by flavonoids
Flavonoids are produced from phenylalanine through the phenylpropanoid pathway (Dixon et al. Reference Dixon, Howles, Lamb, He and Reddy1998; Winkel-Shirley Reference Winkel-Shirley2001). They are representative of the approximately 8000 polyphenols identified in plants. In seeds, flavonoids are concentrated in the seed coat, where they are thought to provide a UV shield. The basic flavonoid structure is two aromatic rings linked through an oxygenated heterocycle (Fig. 1). We determined UV absorption spectra for the major seed flavonoids, including quercitrin, isoquercitrin, robinin and catechin. The first three are conjugated with sugars, and the last is the catechin monomer that is condensed to form tannins. The spectra of catechin, quercitrin and isoquercitrin showed a broad peak at 204 nm, and the corresponding peak in robinin was at 199 nm (Fig. 5). The region I peak was at 258 nm for quercitrin and isoquercitrin, with a shoulder at 270 nm. The robinin region I peak was at 269 nm. Catechin showed a peak at 280 nm, and then absorbance was flat to 340 nm. In contrast, absorbance increased to 340 nm for quercitrin, isoquercitrin and robinin. The presence of a peak at 355 nm was confirmed by conventional solution UV spectroscopy (not shown). The absorption spectrum for condensed tannins, i.e. polymerized catechin (not shown), was similar to that of catechin. Quercitrin (quercetin-3-O-rhamnoside) is the dominant flavonoid found in Arabidopsis seeds, at a concentration of 3.6 mg g−1 of seeds (Routaboul et al. Reference Routaboul, Kerhoas, Debeaujon, Pourcel, Caboche, Einhorn and Lepiniec2006). Its UV absorption curve matched that of DNA, and it also absorbed strongly in the UVA and UVB. The combination of these four flavonoids from Arabidopsis seeds should provide protection over the entire UV spectrum.
VUV-UV absorption spectra of the major flavonoids found in the seeds of Arabidopsis thaliana: quercitrin, isoquercitrin, robinin and catechin. (All samples were at 0.05 mg per sample.) The DNA spectrum is included for reference.

Absorption in the visible region
Absorption in the visible region was measured in solution (data not shown) for all the UV screens studied, and it was compared with chlorophyll a and b (measured in ethanol), which absorbed strongly at 410 nm and 660 nm (chlorophyll a) and 450 nm and 635 nm (chlorophyll b). Scytonemin (in ethyl acetate) absorbed at 388 nm, possibly causing interference with the chlorophyll a peak at 410 nm. β-carotene in (ethyl acetate) absorbed between 430 and 480 nm, which could partially mask absorption by chlorophyll a and strongly mask absorption by chlorophyll b. Neither scytonemin nor β-carotene showed possible masking of chlorophyll in the region between 635 nm and 660 nm. The other compounds studied did not absorb in the visible region, and thus should not interfere with photosynthesis.
Discussion
Biological protection by UV screens
We used spectroscopy to evaluate known UV screens, in the hope of learning their possible role in the origin and development of life and finding ways of protecting life during space travel, i.e. during exospermia, the dissemination of life away from Earth. UV screens accumulate in an organism after exposure to UV (Garcia-Pichel et al. Reference Garcia-Pichel, Sherry and Castenholz1992; Garcia-Pichel & Castenholz Reference Garcia-Pichel and Castenholz1993; Garcia-Pichel et al. Reference Garcia-Pichel, Wingard and Castenholz1993; Cockell & Knowland Reference Cockell and Knowland1999; Castenholz & Garcia-Pichel Reference Castenholz, Garcia-Pichel, Potts and Whittton2000). They absorb UV energy and dissipate it towards relatively insensitive targets. DNA is the prime example of a sensitive target, but other substances vital to life (or that become deleterious after absorbing UV) could also be targets, e.g. proteins and lipids. Free radicals, produced by UV at wavelengths where DNA does not absorb, can later attack DNA. An ideal UV screen would therefore not just protect DNA, but also a variety of substances that absorb at other wavelengths.
Not surprisingly, UV screens (such as carotenoids and flavonoids) are often also free radical scavengers (Everett et al. Reference Everett, Kundu, Maddix and Willson1995). A given molecule can thus be recruited by evolution for more than one function, and it can be difficult to evaluate the importance of such functions – in this case, the relative contribution of free radical scavenging and physical screening of UV.
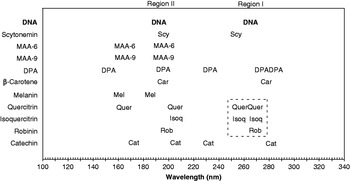
UV absorbance by organic molecules is largely due to conjugated double bonds, either in chains or in rings. All of the UV screens examined absorbed in the vicinity of DNA absorption regions I and II (Fig. 6), mostly due to aromatic rings of various sorts. For example, the flavonoids, e.g. quercitrin and robinin, have absorption peaks at 204 and 199 nm, respectively, and the quercitrin peak is broad, giving good coverage to DNA region II at 192 nm (Figs 5 and 6). The melanin peak at 186 nm is part of a generally increasing absorbance, and should thus also protect DNA region II (Figs 4 and 6). β-carotene, DPA, MAA-9 (porphyra-334), MAA-6 (palythine) and scytonemin showed peaks at 195 nm, protecting DNA region II (Figs 2–4 and 6), although the MAA-9 peak was weak (Fig. 2).

In contrast to this generalized absorbance corresponding to region II, clear protection for DNA region I (264 nm) was less common (Figs 6 and 7). Scytonemin absorbed at 253 nm, DPA absorbed at 273–281 nm and β-carotene at 277 nm (Figs 2–4, 6 and 7). While scytonemin and DPA could clearly protect DNA in this region, their peaks were displaced by 10 nm below and above that of DNA.
Alignment of the region I peaks for DPA, quercitrin and DNA. (Absorbance values are adjusted to show positions of the peaks.)

On the other hand, absorption close to DNA region I was clearer in quercitrin, isoquercitrin and robinin, which also absorbed in the UVB (Figs 5 and 6). The fourth flavonoid, catechin, showed a peak at 280 nm, and no absorption in the UVB (Fig. 5). Thus, the first three flavonoids had absorption spectra remarkably similar to that of DNA, with additional absorption in the UVB, while catechin absorbed more like a protein.
We conclude that flavonoids would protect DNA from incident UV throughout the DNA absorption spectrum, and that they would protect other molecules by absorbing in the UVB. They are known free radical scavengers and metal chelators. Their accumulation in plants is stimulated in response to UV, and mutants of Arabidopsis lacking flavonoids show increased sensitivity to UV (Li et al. Reference Li, Ou-Lee, Raba, Amundson and Last1993). In seeds, flavonoids are concentrated in the seed coat, which serves to protect the embryo and nutrient reserves until germination is induced. The concentration of a flavonoid UV shield in the seed coat would distance the screen from the target DNA carried in the embryo, facilitating transfer of the energy absorbed without harm to the chromosomal DNA.
A comparison of absorption spectra for flavonoids and scytonemin revealed an interesting paradox (Figs 2, 5 and 6). Quercitrin, isoquercitrin and robinin are better mimics of the DNA spectrum than is scytonemin, which protects DNA region II and affords protection in the UVB, but the nearest scytonemin peak to DNA region I (264 nm) was at 253 nm. In contrast, quercitrin, isoquercitrin and robinin showed absorption at 258–270 nm, which should better protect DNA region I. Paradoxically, scytonemin should represent more ancient pigments (Garcia-Pichel & Castenholz Reference Garcia-Pichel and Castenholz1991; Garcia-Pichel et al. Reference Garcia-Pichel and Castenholz1991), yet it seems better adapted to protecting DNA from the UVA and UVB present in today's environment, than from the UVA, UVB and UVC thought to have been a liability on early Earth.
There are several possible explanations for this discrepancy. One concerns the validity of the criterion used for predicting protection (the degree of similarity between the target and the screen absorption spectra), but some of these predictions based on this criterion can be tested experimentally. Another explanation is that plants have retained the ancestral genes encoding primitive UV screens. Plant chloroplasts are considered to be ancient cyanobacteria, acquired through endosymbiosis. The bulk of the chloroplast genome has found its way into the host cell's nucleus, through horizontal gene transfer facilitated by endosymbiosis (Martin et al. Reference Martin, Rujan, Richly, Hansen, Cornelsen, Lins, Leister, Stoebe, Hasegawa and Penny2002). It is thus conceivable that genes encoding flavonoids (or their ancestral forms) were transferred to the host plant genome following endosymbiosis and retained even after oxygen build-up in the atmosphere made their UVC filtering no longer vital. They remain important for plants, where they have acquired new functions, e.g. mediating plant–microorganism interactions (Firmin et al. Reference Firmin, Wilson, Rossen and Johnston1986), and they continue to screen against UVA and UVB. Over time, these genes could have been lost in modern, free-living cyanobacteria.
A third explanation is that the ancestral vehicle that may have brought life to Earth was something like a plant seed, carrying multiple life forms, which started the three domains of life. In this scenario, the ability to make UV screens, such as flavonoids, would have been advantageous before life's arrival on Earth and during the build-up of an oxygen atmosphere. The accumulation of UV screens, such as flavonoids, might be an essential characteristic of DNA-based life. We discuss this reversal of the usual scenario for the origin of life in more detail elsewhere (Tepfer & Leach Reference Tepfer and Leach2006), and restrict ourselves here to the transfer of life through space.
The transfer of life through space
Introspermia, the introduction of life onto Earth, is an attractive way to account for the origin of the life forms we know, but it is difficult to prove after the fact. In contrast, exospermia, the exportation of life from Earth, is proven by Man's recent space explorations. Exospermia is reminiscent of the ‘directed panspermia’, proposed by Orgel and Crick as a refinement of the panspermia hypothesis. They proposed that ‘ … organisms were deliberately transmitted to the Earth by intelligent beings on another planet’ (Crick & Orgel Reference Crick and Orgel1973; Crick Reference Crick1981). According to their theory, life has had time to originate, to evolve, to be dispersed in a primitive state and to evolve again to its present forms. Unfortunately, directed panspermia, like all theories concerning the origin of life, is hard to test. (Intelligent beings have not been found elsewhere, and science has not spontaneously generated life.) Thus, to bring things down to Earth, we can consider Man as the ‘intelligent being’ envisioned in directed panspermia and that Man's explorations of the Solar System constitute directed exospermia.
Our proposal evades the issue of the origin of life, and implies that, instead of worrying about where we came from, we should think about where we are going. This could involve the preparation of life for deliberate dispersal through space. In the context of the present work, UV resistance might be improved by engineering the hyperaccumulation of one or more UV screens in a spore or in a seed that is already adapted to survive harsh conditions. An ideal UV screen would protect DNA and other targets, and it could also scavenge free radicals. Flavonoids, such as quercitrin, appear to be ideal UV screens throughout the UV spectrum. In addition, catechin mimics protein absorption at 280 nm. Flavonoids are also antioxidants and chelators. The genes and enzymes responsible for flavonoid biosynthesis are well characterized in Arabidopsis, so they are available for improving flavonoid accumulation in plants and other organisms using metabolic engineering.
Metabolic engineering is not the only way to accumulate UV screens. Organisms rely on diet as a source of bioactive molecules. For example, carotenoids and flavonoids are acquired in humans through ingestion. An organism could thus be preloaded with UV protecting substances prior to space travel. In the case of a dormant spore or seed, the loaded molecules could remain protective indefinitely, until germination.
For agricultural use, seeds are routinely coated with substances that protect them against pathogens and provide nutrients to germinating seedlings (Taylor & Harman Reference Taylor and Harman1990). Thus, through coating, seeds could not only benefit from improvement in their intrinsic resistance to space conditions, but beneficial substances, such as UV screens, could be added to their exterior. Plant cells carry endosymbionts, and seeds can include both obligate and free-living microorganisms. It should be possible to load seeds with free-living bacteria such as Deinococcus radiodurans, which can survive radiation and desiccation by rebuilding its genome from fragments. Beneficial organisms, e.g. the obligate mycorrhizal fungi, which are necessary for plant growth on Earth, might be incorporated inside plant seeds. These are just two examples of the endoorganisms that could be loaded into plant seeds to increase the chances of survival of a life form in an exoenvironment.
The most ‘intelligent’ Crick and Orgel exospermia experiment would consist of creating a life form from scratch, designed to resist space travel and colonize the universe. The technology for synthesizing long DNA sequences is improving and, with increased knowledge of genomes on Earth, it should be possible to synthesize an artificial organism starting with the DNA sequence. Base pair preferences could be adjusted to produce an optimal DNA absorption spectrum (see the accompanying paper), and UV screens could be made to accumulate (e.g., the flavonoids), which would protect DNA and detoxify free radicals. This artificial life form could be included within an existing one, e.g. a plant seed, as an endoorganism.
Life's place in the Universe is a fundamental question in human culture. Is life on Earth a unique or a trivial component of the Universe? Panspermia suggests that life is not unique to Earth, but rather that life is universal. Scientific discussion of these questions is impeded by a lack of information. (Life is difficult to define, and its origin can only be imagined.) Nevertheless, some things are fairly sure. All life on Earth probably came from the same source, since life is based on DNA and uses the same genetic code. While spontaneous generation, the alternative to panspermia, has not been shown, we know that humans are sending life into space. Thus, self-dispersal, which is an essential attribute of life, it is not limited to our biosphere. Directed exospermia is a logical step for Man to take, but sending humans great distances in space is not feasible. Instead, we propose to send plant seeds (and associated endoorganisms) or biological entities based on enhanced versions of their relevant properties.
Acknowledgments
Financial support was provided by the Centre National d'Etudes Spatiales and the University of Aarhus (EC Integrated Activity on Synchrotron and Free Electron Laser Science, contract number R113-CT-2004-50608). We are indebted to Dick Castenholz (University of Oregon) for providing the UVA induced Chroococcidiopsis cells and to the group of D.-P. Häder (Friedrich-Alexander-Universität) for the MAA extracts. Lucien Kerhoas generously performed the mass spectrometry.