Challenges with current weed management practices have prompted farmers, agronomists, and agroecologists to explore alternative approaches that reduce environmental degradation and nontarget effects. For example, soil tillage and interrow cultivation, which are common weed management practices in organic cropping systems, can increase soil erosion (Lal Reference Lal1991; Logan et al. Reference Logan, Lal and Dick1991; Pimentel et al. Reference Pimentel, Harvey, Resosudarmo, Sinclair, Kurz, McNair, Crist, Shpritz, Fitton, Saffouri and Blair1995) and greenhouse gas emissions (Lal Reference Lal2004; Paustian et al. Reference Paustian, Six, Elliott and Hunt2000; Reicosky Reference Reicosky1997). On the other hand, synthetic herbicides used in conventional management can alter plant communities in adjacent noncrop areas, reduce habitat quality, and depress biodiversity (Boutin et al. Reference Boutin, Strandberg, Carpenter, Mathiassen and Thomas2014; Pleasants and Oberhauser Reference Pleasants and Oberhauser2013; Relyea Reference Relyea2005). Increasing problems with herbicide-resistant weeds have also stimulated interest in practices that can be used to reduce selection pressure and the development of resistant populations (Beckie Reference Beckie2006; Mortensen et al. Reference Mortensen, Egan, Maxwell, Ryan and Smith2012; Norsworthy et al. Reference Norsworthy, Ward, Shaw, Llewellyn, Nichols, Webster, Bradley, Frisvold, Powles, Burgos, Witt and Barrett2012). In addition to these management considerations, concerns about food security have prompted agriculturists to identify and design cropping systems that provide supporting and regulating ecosystem services in addition to simply provisioning agricultural products (Foley et al. Reference Foley, DeFries, Asner, Barford, Bonan, Carpenter, Chapin, Coe, Daily, Gibbs, Helkowski, Holloway, Howard, Kucharik, Monfreda, Patz, Prentice, Ramankutty and Snyder2005). Cover crops are a viable solution to many of the problems with current weed management practices, and long-term cover crop–based systems can increase soil nitrogen and carbon (McDaniel et al. Reference McDaniel, Tiemann and Grandy2014; Poeplau and Don Reference Poeplau and Don2015) while providing many other important ecosystem services (Schipanski et al. Reference Schipanski, Barbercheck, Douglas, Finney, Haider, Kaye, Kemanian, Mortensen, Ryan, Tooker and White2014).
In conventional no-till cropping systems, nonselective, postemergence herbicides are commonly used to terminate cover crops prior to planting a cash crop (Ashford and Reeves Reference Ashford and Reeves2003; Weston Reference Weston1990). As synthetic herbicides are not permitted in organic production, growers must instead rely on physical methods for cover crop management. Mowing can be successfully used for cover crop termination (Creamer and Dabney Reference Creamer and Dabney2002; Wilkins and Bellinder Reference Wilkins and Bellinder1996), but only certain types of mowers are compatible with organic no-till systems. For instance, both rotary and flail mowers can unevenly distribute cover crop residue, resulting in poor weed suppression in areas where the mulch layer is thin or absent (Teasdale and Mohler Reference Teasdale and Mohler2000). Mowing prior to anthesis (Zadoks 60) can also stimulate some cover crops to regrow, which increases competition with the cash crop for available light, moisture, and nutrients (Raper et al. Reference Raper, Simionescu, Kornecki, Price and Reeves2004; Westgate et al. Reference Westgate, Singer and Kohler2005). Additionally, rotary and flail mowing increases the surface area of cover crop residue, thereby accelerating decomposition and diminishing the persistence of the mulch and its ability to physically suppress weeds later in the season (Creamer and Dabney Reference Creamer and Dabney2002).
As an alternative to mowing, terminating cover crops with a roller-crimper is gaining popularity among organic grain farmers in North America (Mirsky et al. Reference Mirsky, Ryan, Curran, Teasdale, Maul, Spargo, Moyer, Grantham, Weber, Way and Camargo2012; Raper et al. Reference Raper, Simionescu, Kornecki, Price and Reeves2004). The most commonly used roller-crimper model in the United States is a steel cylinder (41 to 51 cm diameter) with blunt metal blades arranged in a chevron pattern (Mirsky et al. Reference Mirsky, Ryan, Curran, Teasdale, Maul, Spargo, Moyer, Grantham, Weber, Way and Camargo2012; Raper and Simionescu Reference Raper and Simionescu2005). When used at growth stages immediately following anthesis, cover crop termination with a roller-crimper is as effective as herbicides (Ashford and Reeves Reference Ashford and Reeves2003; Davis Reference Davis2010; Mirsky et al. Reference Mirsky, Curran, Mortensen, Ryan and Shumway2009) and requires less energy to operate than mowing (Ashford and Reeves Reference Ashford and Reeves2003). In contrast to rotary and flail mowing, rolling-crimping creates a unidirectional cover crop mulch layer that is oriented in the direction of travel. When growers plant a cash crop parallel to the direction of rolling-crimping, the amount of residue lodged in the furrow (i.e., hair-pinning) is reduced, coulter function is improved, and seed-to-soil contact is enhanced compared with planting after rotary or flail mowing (Ashford and Reeves Reference Ashford and Reeves2003; Kornecki et al. Reference Kornecki, Price, Raper and Arriaga2009). A sickle-bar mower does not shred plant residue, and some research has indicated that it can be a viable substitute for a roller-crimper (Bernstein et al. Reference Bernstein, Posner, Stoltenberg and Hedtcke2011). However, cut residue can shift under windy conditions and can be dragged through the field with planting, high-residue cultivation, and harvesting equipment.
Previous research on cover crop–based organic no-till planted soybean systems has often focused on maximizing cereal rye biomass through cultivar selection (Wells et al. Reference Wells, Brinton and Reberg-Horton2015) or by manipulating seeding date (Nord et al. Reference Nord, Ryan, Curran, Mortensen and Mirsky2012; Ryan et al. Reference Ryan, Mirsky, Mortensen, Teasdale and Curran2011b), soil fertility (Ryan et al. Reference Ryan, Curran, Grantham, Hunsberger, Mirsky, Mortensen, Nord and Wilson2011a), and termination date (Mirsky et al. Reference Mirsky, Curran, Mortensen, Ryan and Shumway2011; Nord et al. Reference Nord, Ryan, Curran, Mortensen and Mirsky2012; Wayman et al. Reference Wayman, Cogger, Benedict, Burke, Collins and Bary2014). Based on work by Teasdale and Mohler (Reference Teasdale and Mohler2000), a minimum threshold for cereal rye biomass of 8.0 Mg ha−1 at cover crop termination has been recommended for optimal weed suppression in the subsequent cash crop (Mirsky et al. Reference Mirsky, Ryan, Curran, Teasdale, Maul, Spargo, Moyer, Grantham, Weber, Way and Camargo2012, Reference Mirsky, Ryan, Teasdale, Curran, Reberg-Horton, Spargo, Wells, Keene and Moyer2013). However, multiple challenges can arise from such high biomass production: (1) soybean seed placement through the thick mulch can be difficult (De Bruin et al. Reference De Bruin, Porter and Jordan2005; Liebl et al. Reference Liebl, Simmons, Wax and Stoller1992; Wagner-Riddle et al. Reference Wagner-Riddle, Gillespie and Swanton1994); (2) soil water content can be depleted, reducing soybean germination and decreasing yield (De Bruin et al. Reference De Bruin, Porter and Jordan2005; Liebl et al. Reference Liebl, Simmons, Wax and Stoller1992; Wells et al. Reference Wells, Brinton and Reberg-Horton2015); and (3) the amount of soybean lodging can increase (Smith et al. Reference Smith, Reberg-Horton, Place, Meijer, Arellano and Mueller2011).
Whereas excessive cover crop biomass can present many difficulties, insufficient biomass production can be equally challenging to manage. A variety of factors can result in poor cereal rye cover crop growth, including late establishment and low soil nitrogen. In these instances, a “rescue cultivation” can effectively control weeds, reducing the risk of soybean yield loss and contributions to the soil weed seedbank (Nord et al. Reference Nord, Curran, Mortensen, Mirsky and Jones2011). If soybeans are no-till planted in 76-cm rows, high-residue cultivators with low-angle wide sweeps can be used to slice through the soil just below the surface, severing weed shoots from roots. Under ideal operating conditions, the soil is not inverted, and the thin shanks limit the amount of cover crop residue that is disturbed.
In this research, we quantified the effects of intercropping barley and cereal rye on weed suppression and soybean performance. Importantly, relying more on shading prior to cover crop termination than total cover crop biomass production for weed control minimizes the challenges associated with thick cover crop mulches. Barley was selected to complement the well-documented productivity of cereal rye, because it is also a winter-hardy small grain, but it is shorter in stature and has broader leaves than cereal rye. These differences in plant height and leaf morphology might increase light interception through resource partitioning. To investigate the potential of barley and cereal rye mixtures to enhance light interception and weed suppression in cover crop–based organic no-till planted soybean, our research consisted of two primary objectives: (1) quantify the impact of cover crop mixtures of barley and cereal rye on shading, weed suppression, and soybean yield; and (2) compare the effect of high-residue cultivation (HRC) and standard no-till (SNT) on weed biomass and soybean yield. These research objectives were framed by the following hypotheses: (1) mixtures of barley and cereal rye will result in greater weed suppression than a monoculture of either cover crop, and (2) weed suppression and soybean yield will be greater in HRC than in SNT.
Materials and Methods
Site Description and Experimental Design
We conducted a field experiment from 2012 to 2014 at the Cornell University Musgrave Research Farm in Aurora, NY (42.73°N, 76.66°W). This time frame comprises data collection from two main growing seasons: year 1 (2012 to 2013) and year 2 (2013 to 2014). The dominant soil type is a moderately well-drained, calcareous Lima silt loam (fine-loamy, mixed, semiactive, mesic Oxyaquic Hapludalfs), with partial tile drainage in both field sites. Soft red winter wheat (Triticum aestivum L.) was conventionally managed prior to the initiation of the experiment for years 1 and 2. Across both years, the soil pH ranged from 7.7 to 7.8, and the organic matter content (determined by measuring the mass loss on ignition at 500 C) ranged from 3.4 to 3.6%. Due to the previous conventional management, this experiment represents crop production under the first year of organic transition.
A spatially balanced split-block design with four replications was used with management treatments (HRC and SNT) as main plots and cover crop seeding ratio treatments as subplots. In addition to HRC and SNT, a management treatment consisting of no cover crop, tilled soil, and interrow cultivation (IRC) was included in plots adjacent to the experiment to evaluate soybean performance under typical organic soybean management. Although this management treatment was not included in a formal statistical analysis, it served as an external control that was superior to the county average because it represented no-herbicide management conditions. In 2012 and 2013 barley and cereal rye were seeded in a replacement series with three seeding ratio treatments. Each cover crop was planted in monoculture (barley:cereal rye, 0:100 and 100:0) and in biculture (50:50). Cover crop seeding rates were based on the rate used for the cereal rye monoculture (547 seeds m−2, 136 kg ha−1), which is similar to the standard practice of seeding a fall-sown cereal rye cover crop at a rate of 126 kg ha−1. The seeding rates for the barley monoculture and mixture were determined volumetrically, such that the same volume was seeded in all plots. As barley seeds are larger than cereal rye seeds, the volumetrically equivalent seeding rate for the barley monoculture was 355 seeds m−2, and the biculture rate was 296 and 150 seeds m−2 for cereal rye and barley, respectively. When a replacement series is used to study metrics of plant competition, such as interference and niche differentiation, interpretations of the results can be limited (Connolly Reference Connolly1986; Connolly et al. Reference Connolly, Wayne and Bazzaz2001; Firbank and Watkinson Reference Firbank and Watkinson1985; Inouye and Schaffer Reference Inouye and Schaffer1981; Jolliffe Reference Jolliffe2000; Taylor and Aarssen Reference Taylor and Aarssen1989). However, many of these limitations might not apply if the research objective is to compare yields between monocultures and mixtures (Jolliffe Reference Jolliffe2000). As we were not assessing plant competition, and density dependence was not detrimental to testing our hypotheses, we implemented a practical approach to cover crop seeding that is common among farmers. Each subplot measured 6.1 by 9.1 m in size, which was large enough to facilitate farm-scale equipment and destructive sampling of the cover crops.
Field Operations
Prior to the cover crops being planted in fall 2012 and 2013, the field was moldboard plowed and prepared with a field cultivator (Perfecta II, Unverferth Manufacturing, Kalida, OH), and poultry litter (5–4–3, N–P2O5–K2O [Krehers Enterprises, Clarence, NY]) was broadcast applied with a box-spreader at 56 kg total N ha−1. After the poultry litter was incorporated with a cultimulcher (Model 950, Deere & Company, Moline, IL), barley ‘Valor’ and cereal rye ‘Aroostook’ were seeded with a drill (Model 450, Deere & Company, Moline, IL) on September 17, 2012, in year 1, and September 7, 2013, in year 2. The cover crops were seeded with 19 cm row spacing at a depth of 2.5 cm.
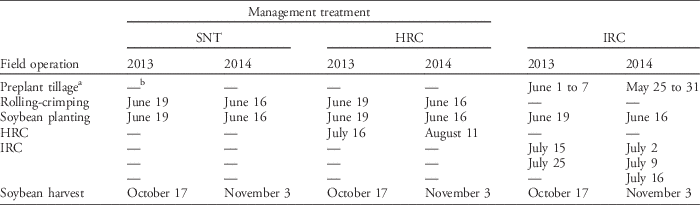
As barley matures earlier than cereal rye, cover crop termination was delayed until after cereal rye had reached anthesis, with rolling occurring on June 19, 2013, and June 16, 2014, for years 1 and 2, respectively (Table 1). Front mounted on a tractor and driven at approximately 7 km h−1, the 3-m-wide roller-crimper (I & J Manufacturing, Gordonville, PA) was filled with water for a total mass of 1,195 kg. The cover crops were rolled perpendicular to the direction of sowing to achieve more uniform ground cover and improve soybean seed placement (Kornecki et al. Reference Kornecki, Raper, Arriaga, Balkcom and Price2005). For IRC management, a field cultivator was used to bury any weeds that had emerged, and then a cultimulcher was used to prepare the seedbed for planting. On the same date as cover crop termination, rhizobium-inoculated soybean ‘HS13A11’ (maturity group I) was planted through the rolled cover crop mulch (HRC and SNT) or bare soil (IRC) at a depth of 3 cm using a four-row planter (MaxEmerge 7200, Deere & Company, Moline, IL). As the soil was particularly dry at planting in 2014, we added 318 kg of weight to the four-row planter to increase the down pressure and ensure seed placement was at the targeted depth. Soybean was no-till planted in 76-cm-wide rows parallel to the direction of cover crop rolling at a high seeding rate of 740,000 seeds ha−1. Although this is more than double the recommended seeding rate of 321,000 seeds ha−1 for conventional soybean production at 76 cm row spacing in New York (Cox and Cherney Reference Cox and Cherney2011; Orlowski et al. Reference Orlowski, Cox, DiTommaso and Knoblauch2012), the high rate was used as a cultural weed management tactic. Soybean canopy closure is attained earlier at higher seeding rates, which contributes to weed suppression through increased shading (Arce et al. Reference Arce, Pedersen and Hartzler2009; Bastiaans et al. Reference Bastiaans, Paolini and Baumann2008; Place et al. Reference Place, Reberg-Horton, Dunphy and Smith2009; Ryan et al. Reference Ryan, Mirsky, Mortensen, Teasdale and Curran2011b).
Dates of field operations in 2013 and 2014 for the standard no-till (SNT) and high-residue cultivation (HRC) management treatments and the tillage-based interrow cultivation (IRC) comparison in the experiment in Aurora, NY.

a Preplant operations included moldboard plowing, disking, and cultipacking.
b A dash (—) indicates that the operation was not conducted.
For HRC management, a four-row no-till high-residue cultivator (Model 886, Deere & Company, Moline, IL) was used on July 16, 2013, in year 1 and August 11, 2014, in year 2. The SNT treatment did not include any supplemental weed management. For weed control under IRC management in 2013, an interrow cultivator was used on July 15 and July 25. In 2014 interrow cultivation occurred on July 2, July 9, and July 16. A 7 to 10 d interval between cultivation events was used to provide enough time for recently germinated summer annual weeds to emerge, thereby enhancing the efficacy of the following cultivation.
Sampling and Data Collection
On the same day as cover crop termination and prior to rolling-crimping, photosynthetically active radiation (PAR) transmittance through the canopy was measured with a line quantum sensor (LI-191, LI-COR, Lincoln, NE) linked to a point quantum sensor (LI-190, LI-COR, Lincoln, NE) at solar noon. The line sensor was placed on the soil surface between two rows of cover crops, and the point sensor was mounted on a telescoping monopod extended above the canopy to obtain reference values for instantaneous calculation of PAR transmittance. Also before rolling-crimping, aboveground cover crop stem density and biomass were quantified within each plot. Before the biomass was removed, cover crop stem density was assessed by counting stems with seed heads by species within the quadrats. For determination of biomass, barley and cereal rye vegetation was clipped at the soil surface within a 0.5 m2 quadrat, and then samples were oven-dried at 50 C for approximately 1 wk and weighed.
Weed biomass samples were collected approximately 11 wk after planting, just prior to maturation of several dominant weeds in the experiment. Weeds were clipped at the soil surface within a 0.5 m2 quadrat and separated according to species as follows: (1) common ragweed, (2) giant foxtail and yellow foxtail, and (3) all other weed species. Common ragweed and the two foxtail species were separated from all other weeds, because they were identified as the most abundant (i.e., dominant) species in the experiment based on visual estimates of weed cover. Weed biomass samples were dried and weighed as described for the cover crop samples. Soybean population was assessed by counting individual plants within a 0.5 m2 quadrat at soybean harvest on October 17, 2013, for year 1 and November 3, 2014, for year 2. Soybean yield was determined by harvesting mature plants with a two-row plot combine (ALMACO SP20, Nevada, IA) and adjusting grain moisture to 13%.
Statistical Analyses
Data were analyzed using R v. 3.1.0 (R Core Team 2014). We used linear mixed-effects models (lmer function in the ‘lme4’ package in R; Bates et al. Reference Bates, Maechler, Bolker and Walker2015) with block as a random effect to test for relationships among seeding ratio, management treatment, PAR transmittance, cover crop biomass, weed biomass, common ragweed biomass, soybean population, and soybean yield. Interactions between these factors and year were also tested, and year was removed during model simplification if the interaction or main effect of year was not significant (P>0.05).
For linear mixed-effects models, calculating the coefficient of determination (R2) can lead to many issues, such as a decreasing or negative R2 when additional independent variables are introduced (Nakagawa and Schielzeth Reference Nakagawa and Schielzeth2013). To overcome these deficiencies, we used the r.squaredGLMM function (‘MuMIn’ package; Bartoń Reference Bartoń2015) to calculate two types of R2: the marginal coefficient of determination
 $\left( {{\rm R}_{{\rm m}}^{2} } \right)$
and conditional coefficient of determination
 $\left( {{\rm R}_{{\rm c}}^{{\rm 2}} } \right)$
. The
 ${\rm R}_{{\rm m}}^{2} $
represents the proportion of response variance that is associated with the fixed effects only, whereas the
 ${\rm R}_{{\rm c}}^{{\rm 2}} $
describes the variance explained by both fixed and random effects (Nakagawa and Schielzeth Reference Nakagawa and Schielzeth2013).
When two predictor variables in a model are linearly related, the presence of collinearity (or multicollinearity when there are more than two predictors) can result in unstable parameter estimates and inflated standard errors (Dormann et al. Reference Dormann, Elith, Bacher, Buchmann, Carl, Carré, Marquéz, Gruber, Lafourcade, Leitão, Münkemüller, McClean, Osborne, Reineking, Schröder, Skidmore, Zurell and Lautenbach2013). Particularly problematic is the inability to separate the unique effects of each variable, which in some instances is the primary motivation for using multiple regression. To measure the degree of collinearity between two predictor variables, we used the vif function (‘car’ package; Fox and Weisberg Reference Fox and Weisberg2011) for the variance-inflation factor (VIF) calculation (Marquardt Reference Marquardt1970), which is described as
 $${\rm VIF}_{i} {\rm \,{\equals}\,}{{\rm 1} \over {{\rm 1}{\minus}{\rm R}_{i}^{2} }}{\rm }$$
where
 $${\rm R}_{i}^{2} $$
is the multiple correlation coefficient of X
i
regressed on the remaining predictor variables (Belsley et al. Reference Belsley, Kuh and Welsch1980). If the predictor variables are uncorrelated, then
 $${\rm R}_{i}^{2} {\equals}0$$
and VIF
i
will be the minimum value of 1 (Fox and Monette Reference Fox and Monette1992). VIF is widely used as diagnostic measurement, and many competing “rules of thumb” have been proposed for identifying severe or excessive collinearity when assessing a VIF (O’Brien Reference O’Brien2007). Most commonly, it has been suggested that a VIF>10 indicates severe collinearity (Kutner et al. Reference Kutner, Nachtsheim, Neter and Li2005; Marquardt Reference Marquardt1970). However, Fox (Reference Fox1997) proposed that the precision of estimation (square root of the VIF) is seriously degraded at a VIF>4, and it has even been suggested that a VIF as low as 2 can indicate problematic collinearity (Graham Reference Graham2003). Condition indices (CI) are a complementary diagnostic tool for identifying collinearity, with a CI>30 commonly used as an indicator of severe collinearity (Belsley et al. Reference Belsley, Kuh and Welsch1980; Rawlings et al. Reference Rawlings, Pantula and Dickey1998). We used the colldiag function (‘perturb’ package; Hendrickx Reference Hendrickx2015) to obtain condition indices for the two predictors.
For our multiple regression analysis, we were specifically interested in calculating semipartial and partial R2 to partition the proportion of variance in weed biomass that each predictor variable (PAR transmittance and cover crop biomass) accounted for. The formulae for the semipartial correlation (sr i ) between each predictor and the response can be described as
 $$sr_{1} \,{\equals}\,{{r_{{Y1}} {\minus}r_{{Y2}} r_{{12}} } \over {\sqrt {1{\minus}r_{{12}}^{2} } }}\,{\rm and}$$
 $$sr_{2} \,{\equals}\,{{r_{{Y2}} {\minus}r_{{Y1}} r_{{12}} } \over {\sqrt {1{\minus}r_{{12}}^{2} } }}$$
where sr
1 and sr
2 express the correlation between the entirety of weed biomass (Y) and a predictor variable from which the other predictor has been “partialed” or controlled for (Cohen et al. Reference Cohen, Cohen, West and Aiken2003); r
Y1 is the bivariate correlation between Y and PAR transmittance (X
1); r
Y2 is the bivariate correlation between Y and cover crop biomass (X
2); and r
12 is the bivariate correlation between the two predictor variables, X
1 and X
2. These are considered semipartial correlations, because the effects of X
2, for example, have been uncoupled from X
1 but not from Y (Cohen et al. Reference Cohen, Cohen, West and Aiken2003). Squaring the semipartial correlation represents
 $$sr_{i}^{2} $$
, which can be understood as the proportion of variance in Y explained by a given predictor beyond that which is explained by the partialed predictor (Preacher Reference Preacher2006).
Partial correlation (pr i ) is the correlation between X i and Y in which the other predictor has been partialed from both X i and Y. This relationship is given by
 $$pr_{1} {\equals}{{r_{{Y1}} {\minus}r_{{Y2}} r_{{12}} } \over {\sqrt {1{\minus}r_{{Y2}}^{2} } \sqrt {1{\minus}r_{{12}}^{2} } }}\, {\rm and}$$
 $$pr_{2} {\equals}{{r_{{Y2}} {\minus}r_{{Y1}} r_{{12}} } \over {\sqrt {1{\minus}r_{{Y1}}^{2} } \sqrt {1{\minus}r_{{12}}^{2} } }}$$
where pr
1 represents the partial correlation between X
1 and Y after controlling for the effect of X
2 on both X
1 and Y, and pr
2 is the corresponding relationship with respect to X
2. Of the variance in Y that is not estimated by the other predictor in the model, the coefficient of partial determination
 $\left( {pr_{i}^{2} } \right)$
represents the amount of that remaining Y variance explained by X
i
(Cohen et al. Reference Cohen, Cohen, West and Aiken2003). Semipartial and partial correlations were determined in R with the spcor and pcor functions (‘ppcor’ package; Kim Reference Kim2015), respectively.
Mixed-effects analysis of covariance (ANCOVA) was used to evaluate the effect of management treatment (SNT and HRC) and year (2013 and 2014) on weed biomass, common ragweed biomass, soybean population, and soybean yield while accounting for seeding ratio or cover crop biomass as covariates and block as a random effect. Diagnostic tests were performed to ensure that there was independence of the covariate and the treatment effects and homogeneity of the regression slopes. Tukey’s honest significant difference (HSD) test was performed with the HSD.test function (‘agricolae’ package; Mendiburu Reference Mendiburu2015) to compare the means of cover crop biomass production. Data for all analyses were tested to ensure that the errors exhibited homogeneity of variance, independence, and normal distribution.
Results and Discussion
Weather and Field Conditions
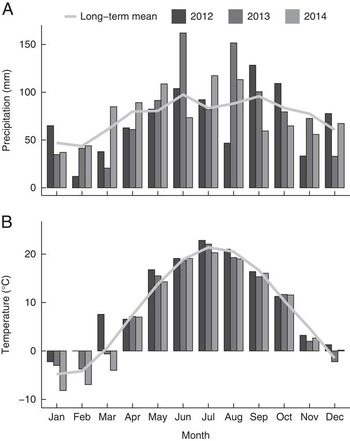
The cover crop and soybean growing seasons for years 1 and 2 were characterized by highly variable precipitation (Figure 1) and temperatures similar to the long-term average (1956 to 2014) (Northeast Regional Climate Center 2015). Compared with the long-term average, precipitation was greater by 6% or less during the cover crop growing season in years 1 and 2. However, there was 28% more precipitation during the 2013 soybean growing season and 7% less precipitation in 2014 compared with the long-term average. Notably, June and August in 2013 were much wetter than the long-term average for each month, with 65 and 73% more precipitation, respectively.
(A) Monthly precipitation from 2012 to 2014 and the long-term mean. (B) Mean monthly temperatures and the long-term mean. Data are from the Northeast Regional Climate Center (2015).

Average monthly temperatures were similar to the long-term average during the cover crop growing seasons (September 17, 2012, to June 19, 2013, and September 7, 2013, to June 16, 2014) and soybean growing seasons (June 19, 2013, to October 17, 2013, and June 16, 2014, to November 3, 2014). A total of 2,161 and 2,096 growing degree days (GDD, base 10 C) accumulated from June 1 to October 31 in 2013 and 2014, respectively (Northeast Regional Climate Center 2015). The long-term average for this site is 2,218 GDD.
In 2014 precipitation was above average from March through May and below average, overall, from June through October. Tile drainage in the 2014 field site did not function as well as the tile drainage in 2013, which exacerbated the effects of above-average rainfall in the spring. In some plots, this resulted in a 10-fold increase in biomass production directly above the irregularly spaced tiles compared with adjacent, poorly drained areas. Areas affected by poor tile drainage were mapped, and data from plots within these areas were excluded from analyses after statistical procedures, such as measuring Cook’s distance, were used to verify whether the outliers were influential.
Cover Crop Biomass Production and PAR Transmittance
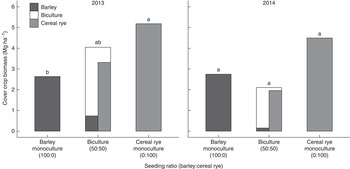
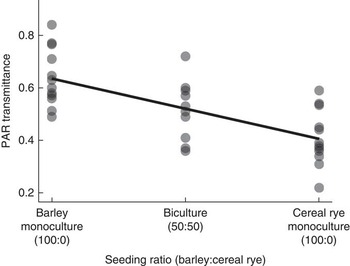
Cover crop biomass production was more variable in 2014 than 2013, which was likely due to poor drainage in the 2014 field site. As the proportion of cereal rye increased in 2013, mean cover crop biomass increased from 2.6 Mg ha−1 in the barley monoculture to 5.2 Mg ha−1 in the cereal rye monoculture (Figure 2). In 2014 mean cover crop biomass was again greatest in the cereal rye monoculture at 4.5 Mg ha−1, but the biculture was the least productive seeding ratio treatment, accumulating 2.1 Mg ha−1 of barley and cereal rye biomass combined. In all cases, total biomass production was substantially less than the recommended 8.0 Mg ha−1 threshold for adequate weed suppression. Whereas cover crop biomass increased, PAR transmittance through the cover crop canopy decreased as the proportion of cereal rye in the seeding ratio increased (Figure 3). This reduction in PAR transmittance was from 64% in the barley monoculture to 41% in the cereal rye monoculture (P<0.001). Data were pooled over 2013 and 2014 because there was no interaction or main effect of year.
Cover crop biomass production of barley and cereal rye in monoculture and biculture in 2013 and 2014. Similar letters above bars indicate no significant difference (P<0.05) among seeding ratios based on Tukey’s honest significant difference test.

Photosynthetically active radiation (PAR) transmittance through the cover crop canopy across seeding ratio treatments. Data were pooled over both years and block was included as a random effect (y=0.635–0.002x,
 ${\rm R}_{{\rm m}}^{2} \,{\equals}\,0.43$
,
 ${\rm R}_{{\rm c}}^{2} \,{\equals}\,0.70$
, P<0.001).

We seeded barley and cereal rye based on volume rather than seed density because cover crop seeding rates are more commonly established on a volume or mass basis by farmers. Although cereal rye is known to be highly competitive (Beres et al. Reference Beres, Harker, Clayton, Bremer, Blackshaw and Graf2010), barley and cereal rye production in the 50:50 mixture was notably uneven. For example, cereal rye comprised 82% of the biomass and 67% of the stem density in the 50:50 mixture in 2013 (unpublished density data). Biomass production and stem density was even more disproportionate in 2014, with the biculture consisting of 83% cereal rye stems, representing 93% of the biomass in the 50:50 mixture.
The amount of PAR transmittance decreased as the proportion of cereal rye increased, closely mirroring the relationship between cover crop biomass and cereal rye proportion. Although cover crop biomass was statistically equivalent across the three seeding ratios in 2014, the difference between the biculture and the cereal rye monoculture exceeded 2.0 Mg ha−1. Despite this substantial difference in biomass, PAR interception was lowest in the barley monoculture, not the biculture. Minor differences in plant architecture and resource partitioning might help explain this, but it is the cumulative effect on weed suppression that is of practical importance.
Compared with cereal rye, barley is typically less tolerant of wet soil and the increase in ethylene that is associated with anaerobic conditions (Drew and Lynch Reference Drew and Lynch1980; Smith and Restall Reference Smith and Restall1971; Smith and Robertson Reference Smith and Robertson1971). Nonuniform soil drainage in 2014 coupled with above-average precipitation from March to May (Figure 1) might have reduced root growth and the competitive ability of barley more so than cereal rye. Injury is often less severe when short-term flooding occurs during more mature barley growth stages, but recovery is typically limited, resulting in reduced tillering, biomass production, and grain yield (Leyshon and Sheard Reference Leyshon and Sheard1974). This occurrence would help explain the highly disproportionate density and biomass in the 50:50 biculture in 2014, but the mixture was also uneven in 2013. Although we can draw conservative inferences based on field notes, observations, and biomass data to help explain the uneven biculture proportions, our replacement series was not designed to directly assess interspecific plant competition.
Weed Response to Seeding Ratio and Management Treatments
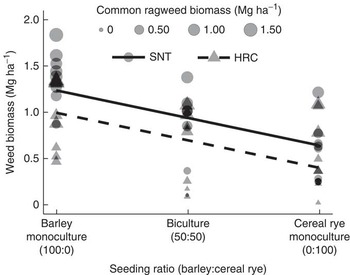
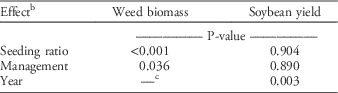
Across all seeding ratios and management treatments, common ragweed was the dominant weed, accounting for 65% of the aboveground biomass among all weed species in 2013 and 84% in 2014. The dominance of this summer annual weed species is illustrated in Figure 4 by allowing the symbol size to vary proportionally with the amount of common ragweed biomass. Giant foxtail and yellow foxtail were also prominent at the 2013 study site, comprising 25% of the total weed biomass. In 2014 the proportion of foxtail species was only 7% of the aboveground weed biomass. Based on the ANCOVA (Table 2), the interaction between seeding ratio and management treatment was not significant (P>0.05), which indicates that the relationship between weed biomass (response) and seeding ratio (covariate) was similar for the SNT and HRC management treatments. Also, these data were pooled over 2013 and 2014, because the ANCOVA showed no interaction or main effect of year. Mean weed biomass decreased as the proportion of cereal rye increased (Figure 4), ranging from 1.2 to 0.6 Mg ha−1 under SNT management and 1.0 to 0.4 Mg ha−1 under HRC management.
Weed biomass production in the standard no-till (SNT) and high-residue cultivation (HRC) management treatments across seeding ratios. The data were pooled over both years, and block was included as a random effect (
 ${\rm R}_{{\rm m}}^{2} {\equals}0.35$
,
 ${\rm R}_{{\rm c}}^{2} {\equals}0.35$
). Interactions were not observed (P>0.05), but the effects of seeding ratio (P<0.001) and management treatment (P=0.04) were significant. For SNT management, y=1.241 – 0.006x; for HRC management, y=0.999 – 0.006x. Symbol size increases as the proportion of common ragweed in total weed biomass increases.

Results from the mixed-effects analysis of covariance (ANCOVA) on weed biomass and soybean yield.Footnote a

a Block was included as a random effect. The covariate was seeding ratio treatment (barley:cereal rye, 100:0, 50:50, and 0:100), and the other factors were management treatment (SNT and HRC) and year (2013 and 2014).
b All three-way and two-way interactions were tested and removed from the models because they were not significant (P>0.05).
c Year did not have an effect (P>0.05) on weed biomass, so it was removed from the model.
Overall, HRC reduced weed biomass by 26% compared with SNT (P=0.04). This is congruent with previous research showing the weed-suppression benefit of high-residue cultivation in cover crop–based organic no-till planted soybean (Mirsky et al. Reference Mirsky, Ryan, Teasdale, Curran, Reberg-Horton, Spargo, Wells, Keene and Moyer2013). Tillage-based IRC management effectively eliminated all weeds in 2013 and 2014, reducing weed biomass to 1% or less of the biomass levels found in HRC and SNT (unpublished data). In other comparisons between no-till and tillage in organic soybean production (Bernstein et al. Reference Bernstein, Posner, Stoltenberg and Hedtcke2011, Reference Bernstein, Stoltenberg, Posner and Hedtcke2014), weed suppression was not significantly better under tillage-based management.
Common ragweed produced the greatest proportion of biomass across all treatments, which has been found in other experiments on cover crop–based organic no-till planted soybean systems in the northeastern United States (Nord et al. Reference Nord, Ryan, Curran, Mortensen and Mirsky2012; Ryan et al. Reference Ryan, Curran, Grantham, Hunsberger, Mirsky, Mortensen, Nord and Wilson2011a). As common ragweed typically emerges prior to cover crop termination (Myers et al. Reference Myers, Curran, VanGessel, Calvin, Mortensen, Majek, Karsten and Roth2004), the operation of a no-till planter can contribute to low within-row common ragweed abundance by physically cutting, burying, or uprooting seedlings. With common ragweed found primarily between rows in these systems, HRC can provide particularly effective control of this problematic species. The timing of high-residue cultivation, however, presents a trade-off: earlier cultivation can provide better control of species that emerge prior to rolling-crimping, but species that emerge later might actually be stimulated by the disturbance. A separate ANCOVA was used to test for interactions among and effects of seeding ratio, management treatment, and year on common ragweed biomass. No interactions were observed, but the effects of seeding ratio (P<0.001), management treatment (P=0.02), and year (P=0.01) were all significant. Compared with SNT management, HRC reduced common ragweed biomass by 52% in 2013 but only by 22% in 2014, when the operation occurred later in the season (Table 1). In general, HRC was not as effective at controlling foxtail species. As giant foxtail and yellow foxtail tend to emerge after rolling-crimping (Myers et al. Reference Myers, Curran, VanGessel, Calvin, Mortensen, Majek, Karsten and Roth2004), HRC might have helped stimulate germination in 2013, resulting in a 113% increase in biomass compared with SNT. Later HRC in 2014 provided more effective control of both foxtail species, which was likely due to a greater proportion of the two species emerging prior to the cultivation event.
As with any weed management tactic, timing is critical to the success of high-residue cultivation. Common ragweed is known to be problematic in these rotational no-till systems in the northeastern United States, so it might be advantageous to forgo some control of later-emerging species in favor of greater common ragweed suppression. Similar to the relationship between seeding ratio and PAR transmittance, weed biomass tended to be lower in cover crop seeding ratio treatments that were more productive. Our hypothesis that mixtures of barley and cereal rye would provide greater weed suppression than either species in monoculture was not supported by these results.
Relationships among Cover Crops, PAR Transmittance, and Weeds
Comparing the
 ${\rm R}_{i}^{2} $
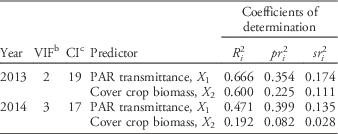
from simple linear regression analyses, PAR transmittance explains a greater proportion of the variance in weed biomass than cover crop biomass in both 2013 and 2014 (Table 3). However, this approach does not reveal the degree of redundancy that likely exists between the two predictors. Although cover crop biomass is intrinsically correlated with the amount of PAR that passes through the cover crop canopy (or, inversely, the amount intercepted by the canopy), it also contributes to weed suppression as rolled mulch. This helps differentiate the effect of cover crop biomass on weed biomass from the effect of PAR transmittance prior to cover crop termination. Without the confounding presence of severe collinearity (VIF<10 and CI<30 in both years; Table 3), we were able to assess the proportion of variance in weed biomass that was uniquely explained by PAR transmittance and cover crop biomass. To do this, we used multiple linear regression and compared the
 $sr_{i}^{2} $
and
 $$pr_{i}^{2} $$
for each predictor variable (Table 3).
The proportion of variance in weed biomass (Y) in 2013 and 2014 as explained by bivariate
 $$\left( {R_{i}^{2} } \right)$$
, partial
 $$\left( {pr_{i}^{2} } \right)$$
, and semipartial
 $$(sr_{i}^{2} )$$
coefficients of determination for two predictor variables: photosynthetically active radiation (PAR) transmittance (X
1) and cover crop biomass (X
2).Footnote
a

a Collinearity between the two predictors was assessed with variance-inflation factors (VIFs) and condition indices (CIs).
b As a general rule, a VIF>10 signifies severe collinearity.
c Severe collinearity is also commonly indicated by a CI>30.
The
 $sr_{i}^{2} $
was 0.17 and 0.14 for PAR transmittance and 0.11 and 0.03 for cover crop biomass in 2013 and 2014, respectively. This indicates that PAR transmittance explains 17% of the variance in weed biomass in 2013 and 14% in 2014 when the effect of cover crop biomass has been partialed from PAR transmittance. In comparison, cover crop biomass explains 11% of the variance in weed biomass in 2013 and 3% in 2014 when the effect of PAR transmittance has been partialed from cover crop biomass. In other words, when X
i
is added to a model that already contains the other predictor,
 $sr_{i}^{2} $
represents the incremental increase in explained variance in weed biomass that is uniquely due to X
i
.
For the
 $pr_{i}^{2} $
analysis, PAR transmittance uniquely accounted for 35% of the variance in weed biomass after partialing the effect of cover crop biomass from both PAR transmittance and weed biomass in 2013. Conversely, cover crop biomass uniquely accounted for 23% of the variance in weed biomass after partialing the effect of PAR transmittance from both cover crop biomass and weed biomass in 2013. Similarly, in 2014 the amount of variance in weed biomass that was uniquely explained by PAR transmittance was greater than the proportion of variance explained by cover crop biomass.
It is worth reiterating that both PAR transmittance and cover crop biomass were measured prior to cover crop termination but the effect of cover crop biomass on weed suppression extends (as mulch) until soybean canopy closure and, to a lesser degree, until soybean harvest. Despite influencing weed suppression over a longer period of time, cover crop biomass uniquely explained less of the variance in weed biomass than PAR transmittance. These observations are consistent with previous research demonstrating that the percent ground cover prior to cereal rye jointing (Zadoks 31) was a strong predictor of weed biomass later in the season, after cover crop termination (Ryan et al. Reference Ryan, Curran, Grantham, Hunsberger, Mirsky, Mortensen, Nord and Wilson2011a). Acknowledging that adequate cover crop biomass production is critical to the success of organic no-till planted soybean, our results suggest that farmers should consider implementing management practices that optimize shading prior to cover crop termination.
Soybean Population and Yield
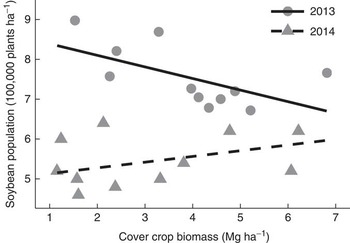
In 2013 and 2014 the no-till planter was calibrated to dispense 740,000 seeds ha−1. Final soybean stand counts in 2013 revealed that this high rate was exceeded with an average of 757,000 plants ha−1 at harvest. In 2014 average soybean population across treatments was only 545,000 plants ha−1. We tested the effects of cover crop biomass and year on soybean population using ANCOVA and found an interaction between cover crop biomass and year (P=0.01). Assessing each year separately using linear regression, soybean population decreased by 29,100 plants ha−1 for each 1 Mg ha−1 increase in cover crop biomass in 2013 (P=0.05), but there was no relationship (P=0.35) between cover crop biomass and soybean population in 2014 (Figure 5). Although high soybean seeding rates can cause lodging, this was not observed in our experiment. Within year, no differences (P>0.05) in soybean yield between seeding ratio, no-till management treatment, or their interaction were detected in 2013 or 2014 (Table 2). However, soybean yield was higher (P=0.003) at 2.9 Mg ha−1 in 2013 compared with 2.6 Mg ha−1 in 2014. Soybean yield under no-till management (HRC and SNT) was lower than the tillage-based on-site comparison (IRC management) across all seeding ratios, producing 98% of the yield obtained with IRC management in 2013 and 79% in 2014. The low weed biomass across treatments might help explain why we observed no differences in soybean yield within year, but these results were still surprising, given the treatment differences among cover crop biomass, PAR transmittance, and weed biomass.
Soybean population at harvest as affected by cover crop biomass in 2013 and 2014. The interaction between cover crop biomass and year was significant (P=0.01), and block was included as a random effect (
 ${\rm R}_{{\rm m}}^{2} {\equals}0.75$
,
 ${\rm R}_{{\rm c}}^{2} {\equals}0.82$
). Analyzing each year separately, there was a significant (P=0.05) reduction in soybean population as cover crop biomass increased in 2013 (y=8.682 – 0.291x,
 ${\rm R}_{{\rm m}}^{2} {\equals}0.31$
,
 ${\rm R}_{{\rm c}}^{2} {\equals}0.53$
), but there was no relationship (P=0.35) between soybean population and cover crop biomass in 2014 (y=4.988 + 0.144x,
 ${\rm R}_{{\rm m}}^{2} {\equals}0.09$
,
 ${\rm R}_{{\rm c}}^{2} {\equals}0.09$
).

Despite accumulating less than 8.0 Mg ha−1 of cover crop biomass in each of the seeding ratio treatments, reduced soybean populations were observed in plots with more cover crop biomass—and thus more cereal rye biomass—in 2013. This relationship was not observed in 2014, possibly due to more challenging planting conditions and the relatively low soybean populations across all cover crop biomass levels. Other researchers have also reported lower crop populations in high-residue management systems, typically attributing the reduction to a decrease in soil moisture associated with the cover crop (De Bruin et al. Reference De Bruin, Porter and Jordan2005; Wells et al. Reference Wells, Brinton and Reberg-Horton2015) or as a result of impaired planter function (e.g., hair-pinning) and poor seed-to-soil contact (Eckert Reference Eckert1988; Liebl et al. Reference Liebl, Simmons, Wax and Stoller1992; Mitchell and Teel Reference Mitchell and Teel1977). Although soybean population at harvest in 2013 decreased as cover crop biomass increased, yield loss at lower populations can be avoided through increased branching, pod formation, and more seeds per plant (Carpenter and Board Reference Carpenter and Board1997; Lueschen and Hicks Reference Lueschen and Hicks1977; Weber et al. Reference Weber, Shibles and Byth1966). Despite this phenotypic plasticity, soybean yield can be reduced when excessive cover crop biomass prevents adequate planter function and seed placement (Liebl et al. Reference Liebl, Simmons, Wax and Stoller1992).
Weight was added to the no-till planter in 2014 in an effort to overcome the hard, dry soil conditions, but inadequate seed-to-soil contact and low soil moisture resulted in an average soybean population that was much lower than the targeted planting rate. In addition to a reduced soybean population, the below-average precipitation during June 2014 (Figure 1) might help explain the lower soybean yield in 2014 compared with 2013. Previous research has found that soil moisture loss through transpiration before cover crop rolling-crimping and after incomplete termination can substantially reduce soil water content (Ashford and Reeves Reference Ashford and Reeves2003; Moschler et al. Reference Moschler, Shear, Hallock, Sears and Jones1967; Munawar et al. Reference Munawar, Blevins, Frye and Saul1990). This effect can be more pronounced when precipitation is low, with dry soil conditions resulting in low soybean emergence, seedling mortality, poor stands, and lower yields (De Bruin et al. Reference De Bruin, Porter and Jordan2005; Eckert Reference Eckert1988; Helms et al. Reference Helms, Deckard, Goos and Enz1996; Liebl et al. Reference Liebl, Simmons, Wax and Stoller1992; Wells et al. Reference Wells, Brinton and Reberg-Horton2015). Regardless of the suite of factors that affected soybean yield in the experiment, our hypothesis that soybean yield would be greater with the addition of HRC than with SNT management alone was not supported. Considering the similarity in soybean yields between the two no-till treatments and the tillage-based management, organic farmers in the northeastern United States can, however, potentially realize greater profits when using the cover crop–based organic no-till planted soybean system due to the associated cost reductions from less labor and fuel use (Mirsky et al. Reference Mirsky, Ryan, Curran, Teasdale, Maul, Spargo, Moyer, Grantham, Weber, Way and Camargo2012).
Management Implications
Although this experiment was managed without synthetic inputs, routine chemical herbicide use at the research farm in previous years likely contributed to the low weed populations and relative lack of weed species diversity observed. These conditions are not typical of most organically managed cropping systems (Bernstein et al. Reference Bernstein, Stoltenberg, Posner and Hedtcke2014; Thelen et al. Reference Thelen, Mutch and Martin2004), because the legacy of low weed populations from previous herbicide use would only be present in fields that had recently been transitioned from conventional to organic production practices. Thus, it is important to consider the effects of past management practices, such as crop rotation (Ball Reference Ball1992; Cardina et al. Reference Cardina, Herms and Doohan2002; Liebman and Dyck Reference Liebman and Dyck1993; Wortman et al. Reference Wortman, Lindquist, Haar and Francis2010) and tillage regime (Buhler Reference Buhler1995; Clements et al. Reference Clements, Benott, Murphy and Swanton1996; Mohler and Callaway Reference Mohler and Callaway1995; Murphy et al. Reference Murphy, Clements, Belaoussoff, Kevan and Swanton2006), on weed seedbank dynamics, as well as aboveground weed diversity, density, and abundance. Mirsky et al. (Reference Mirsky, Ryan, Curran, Teasdale, Maul, Spargo, Moyer, Grantham, Weber, Way and Camargo2012) found that high-residue cultivation decreased weed biomass by 66% and increased soybean yield by 23% compared with standard no-till. As weed biomass was greater in the Mirsky et al. (Reference Mirsky, Ryan, Curran, Teasdale, Maul, Spargo, Moyer, Grantham, Weber, Way and Camargo2012) study than in our experiment, the weed biomass reduction from high-residue cultivation likely had a greater impact on soybean yield.
Our results suggest that weed biomass can be reduced by enhancing cover crop shading prior to termination; however, mixtures of barley and cereal rye did not intercept more PAR than cereal rye grown in monoculture. Although our barley–cereal rye mixture did not provide increased shading, this objective might be achieved by seeding other species combinations. In the northeastern United States, cover crops used for mulch in organic no-till planted soybean production must be winter hardy and early maturing. In addition to these region-specific traits, an ideal cover crop mixture would include species that matured at approximately the same time to optimize the efficacy of rolling-crimping. Preferably, each cover crop species would also be nonleguminous for greater complementarity with the soybean cash crop, thereby enhancing the relative competitive ability of soybean, compared with weeds, through increased soil nitrogen depletion. Mixing a Brassica species with cereal rye might provide superior shading as a grass-broadleaf biculture, but research is required to determine optimal management. If a cover crop monoculture is used, selecting a winter cereal species with greater leaf area than cereal rye, such as triticale (× Triticosecale Witt.), also has the potential to enhance PAR interception. However, an assessment of any alternative winter cereal species must consider maturation and termination timing as they relate to soybean planting and yield potential.
Until these alternative mixtures or species have been evaluated, farmers can improve cover crop shading by modifying cereal rye monoculture seeding methods. For example, using narrower row spacing or drilling half of the seeding rate and broadcasting the remaining half might provide earlier, more complete ground cover. Increasing cereal rye seeding rates can also be effective for increasing weed suppression without increasing cover crop biomass (Ryan et al. Reference Ryan, Curran, Grantham, Hunsberger, Mirsky, Mortensen, Nord and Wilson2011a). Thus, future research should focus on a multitactic approach to weed management that attains adequate—rather than maximum—biomass production and reduces the need for high-residue cultivation by enhancing shading prior to cover crop termination.
Acknowledgments
We would like to thank Chris Pelzer, Brian Caldwell, and all other members of the Sustainable Cropping Systems Lab at Cornell University for their assistance with in-field data collection, as well as Paul Stachowski and his staff at the Musgrave Research Farm for all of their assistance with field operations. We would also like to thank Fulbright Canada and the Natural Sciences and Engineering Research Council of Canada for financially supporting this research. This research was also partially supported with Hatch funding (2013-14-425, “Expanding the Role of Cover Crops in Sustainable Cropping Systems”).