Norovirus is the most common cause of acute gastroenteritis in the United States,Reference Hall, Lopman and Payne 1 and most reported norovirus outbreaks occur in healthcare settings, specifically long-term care facilities.Reference Hall, Wikswo and Pringle 2 Because rapid implementation of control policies is especially important for controlling norovirus,Reference MacCannell, Umscheid and Agarwal 3 , Reference Friesema, Vennema and Heijne 4 early signals of the norovirus season may be useful.
The Centers for Disease Control and Prevention (CDC) collects nationwide epidemiologic data on norovirus outbreaks by integrating the National Outbreak Reporting System (NORS), a national outbreak surveillance system of acute gastroenteritis outbreak with CaliciNet, a laboratory-based norovirus outbreak surveillance network. These surveillance systems have reporting lags that can limit their value for rapidly assessing norovirus seasonal activity. Digital data platforms, such as Google Trends (GT), have been increasingly used for infectious disease surveillance, including early detection of outbreaks; Reference Salathé, Freifeld and Mekaru 5 – Reference Edelstein, Wallensten and Zetterqvist 7 however, they have not specifically been used to assess norovirus outbreaks in healthcare settings.
We examined temporal relationships of norovirus outbreaks among healthcare settings, nonhealthcare settings, and GT search activity. We aimed to determine whether nonhealthcare norovirus outbreaks may serve as an early warning signal for healthcare-associated outbreaks and whether GT activity can be a predictive measure of healthcare-associated norovirus outbreaks.
METHODS
Data Sources
Norovirus outbreak data were obtained from the NORS database. Our analysis included both suspected and confirmed norovirus outbreak data (detailed in the supplement) with a first illness onset date between January 2009 and December 2015. Outbreaks with norovirus and other etiologies were included in the analysis. An outbreak was categorized as healthcare-associated if the reported setting was “hospital,” “long-term care/nursing home/assisted living facility,” or “other healthcare facility.” Foodborne outbreaks were categorized as healthcare-associated when the place where food was eaten was any of these settings. “Unknown” and missing settings were categorized as setting unknown, and all other settings were categorized as nonhealthcare associated.
We analyzed GT data from the United States for the same period. Google Trends is a free online tool that provides geographically stratified temporal data describing search patterns of user-specified inquiries using Google. It provides a score representing a relative measure to a given term’s peak in search activity scaled to 100. We extracted data on the 10 norovirus-related terms identified in a previous study.Reference Desai, Hall and Lopman 6
Data Analysis
First, we conducted a descriptive analysis of healthcare-associated outbreaks (HOBs) and nonhealthcare-associated outbreaks (NOBs). For GT activity, we conducted correlation analyses among all 10 search terms with the monthly number of HOBs, then we used the term with the highest correlation coefficient for weekly analyses. We conducted 2 types of temporal analyses between HOBs and (1) NOBs and (2) GT activity. First, we identified the peak, onset, and offset of the norovirus season using the same definitions used by Rha et alReference Rha, Burrer and Park 8 and compared these indices. Second, to identify whether a time lag exists between HOBs, NOBs, and GT activity, we used a linear regression model (specified in the supplement) to estimate the regression coefficient, 95% confidence interval, and R2 to identify the lag time with the strongest correlation. We conducted the analyses using all weeks in the study period, then we analyzed the periods before and after the peak separately (from the preceding trough to the peak of an HOB and from the peak to the subsequent trough of an HOB, respectively) to examine periods of increasing and decreasing norovirus outbreak activity.
For weekly analyses, we grouped the outbreaks using the Morbidity and Mortality Weekly Report week 9 for both NORS and GT data. The seasonal year was defined as week 27 (~July 1) in 1 year to week 26 of the next. All statistical analyses were performed with SAS version 9.4 software (SAS Institute, Cary, NC).
RESULTS
From 2009 to 2015, 11,212 norovirus outbreaks involving an estimated total of 397,148 primary cases were reported through NORS (Supplement 1). Categorization revealed 5,542 HOBs, 3,247 NOBs, and 2,423 outbreaks with unknown settings (additional details in Supplement 2). Among the GT search terms, “stomach virus” had the strongest correlation with monthly HOBs (R2=0.79, Supplement 3) and was selected for subsequent analyses.
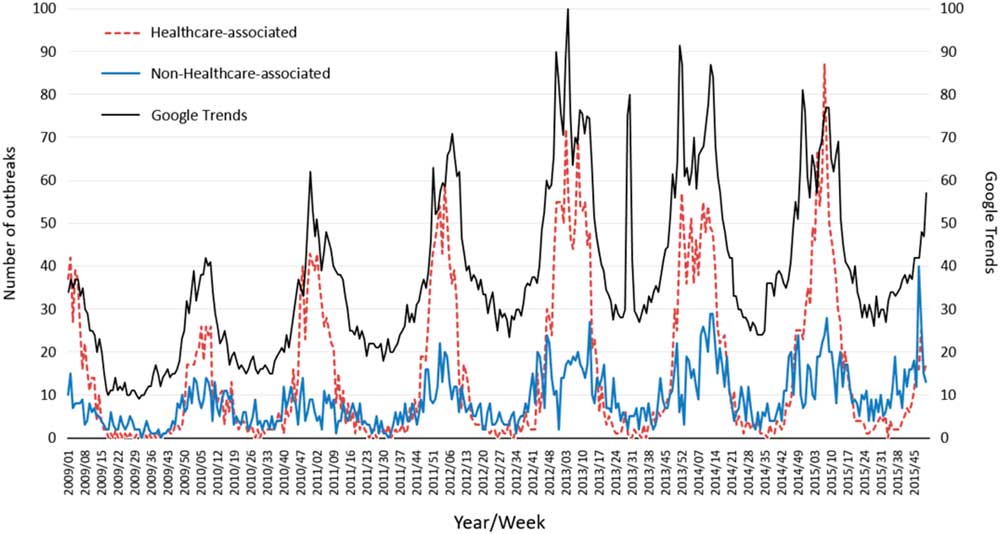
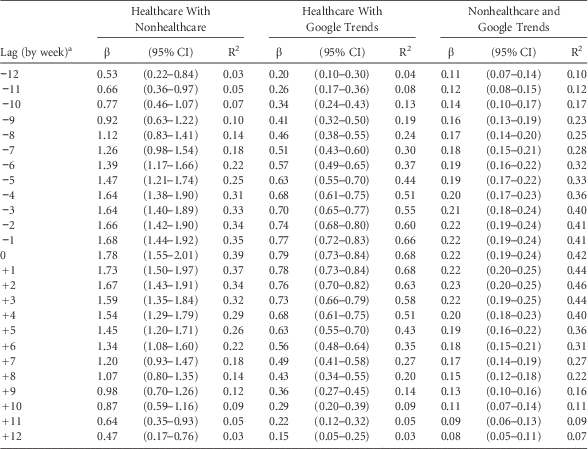
Healthcare-associated outbreaks (HOBs) had a stronger seasonality than NOBs. The ratio of the peak count of weekly outbreaks to the mean count was 5.5 vs. 3.3, respectively. Also, HOBs were more concentrated in winter months; 64% vs 45% of total outbreaks occurred during November to February (Figure 1, Supplement 4). Overall, there was a weak correlation between HOBs and NOBs (R2=0.39) and a moderate correlation with GT activity (R2=0.68, Table 1). During the period prior to the peak, correlation between NOBs and HOBs was strongest when counts of NOBs preceded HOBs by 7 weeks (R2=0.43). The correlation between HOBs and GT activity was strongest with no time lag (R2=0.68, Supplement 5).
Number of weekly reported healthcare-associated and nonhealthcare-associated norovirus outbreaks and Google Trends score with “stomach virus” between 2009 and 2015, United States.

The Coefficient with 95% Confidence Interval, R2 with the Regression Models With Various Lag Times to Assess Correlations Between Healthcare-Associated and Nonhealthcare-Associated Norovirus Outbreaks and Google Trends

NOTE. CI, confidence interval.
a Negative lag means that the second data are prior to the first data, and positive lag means that the second data are after the first data.
DISCUSSION
We found that the characteristics and temporal relationships in norovirus outbreaks differed by setting. Healthcare-associated outbreaks had a more distinctive seasonality with a higher peak-mean ratio and were more concentrated in winter but showed delayed activity when compared to NOBs. In addition, we found that Internet searches using GT showed stronger correlations with HOBs than with NOBs.
Healthcare-associated outbreaks were most highly correlated with the number of NOBs 7 weeks prior when analyzing the period of increasing outbreak activity only, but both HOBs and NOBs showed no preceding time lag with GT activity. In a previous norovirus study, the correlation was strongest (R2=0.74) between emergency department visits and GT data 2 weeks prior.Reference Desai, Hall and Lopman 6 Because we used national-level data, differences in local disease and Internet search activity may underlie our results and may dilute national relationships.
Our study has several strengths. We obtained a large quantity of data: we analyzed 11,212 outbreaks reported to NORS over 6 seasonal years. Second, we conducted different types of analyses to assess temporal relationships. In addition to identifying and comparing the characteristics of season by point (ie, onset, peak, offset), we used regression analysis to assess the temporal relationship using outbreak data from the entire seasonal year and limited to the increasing or decreasing outbreak activity periods. This multifaceted approach helped to identify subtler temporal associations, particularly those within specific portions of a given season.
This study has several limitations. Our analyses were limited by the variable levels of detail available on outbreaks reported through NORS. Although we categorized and focused on outbreak settings, 22% of outbreak settings were unknown. Second, our data may have been subject to surveillance and/or reporting bias because HOBs are more readily identified and reported. Third, because we do not know GT user distributions and/or users’ search motives, GT can be affected by various factors, such as media coverage. In this study, for example, we observed a sudden increase in GT activity in 2013 (Figure 1), but we were unable to identify the reason behind this increase. Google Trend data should be interpreted with caution, though it is useful to identify temporal trends.
Our findings suggest that GT data may be a valuable supplement to existing norovirus surveillance by providing a timely signal for reinforcing appropriate infection prevention and control practices in the healthcare setting. Because GT provides real-time, local data and is highly accessible to the public, examination of GT norovirus-related activity may augment current national surveillance systems and provide timely information to state and local health departments to enable early detection, response, and reporting of outbreaks.
ACKNOWLEDGMENTS
The findings and conclusions in this report are those of the authors and do not necessarily represent the official position of the Centers for Disease Control and Prevention.
Financial support: No financial support was provided relevant to this article.
Potential conflicts of interest: All authors report no conflicts of interest relevant to this article.
SUPPLEMENTARY MATERIAL
To view supplementary material for this article, please visit https://doi.org/10.1017/ice.2017.322