Introduction
Thermal energy storage is an important branch of energy science and technology. In the process of energy conversion and utilization, sometimes there is no match between demand and supply in time and space, such as peak and valley difference of electric load, intermittent availability of solar, wind, and ocean energy, and discontinuous operation of industrial furnace [Reference Tyagi, Panwar, Rahim and Kothari1, Reference Sharma, Tyagi, Chen and Buddhi2]. Energy storage technology is an effective way to deal with the above problems and energy efficiency will be improved accordingly [Reference Qiu, Li, Song, Chu and Tang3, Reference Shimamura and Sotoike4]. Thermal energy storage, including sensible heat storage and latent heat storage, is one of the most important means among the energy storage technologies [Reference Alkan5].
Phase change materials (PCMs) can store/release thermal energy through solid–liquid phase changes in a certain temperature range [Reference Li, Zhang, Li, Zhou, Sun and Yun6]. The stored or released thermal energy is called latent heat of phase change [Reference Cao, Tang and Fang7]. With the change in the physical state between solid and liquid, the temperature of PCMs itself almost remained unchanged before the transformation completed, and therefore a broad temperature platform could be formed along with a large amount of latent heat through the phase change process [Reference Qiu, Lu, Wang, Tang and Song8, Reference Derlet and Maass9]. So far, a lot of inorganic and organic compounds have been intensively investigated, including salt hydrates, paraffin waxes, fatty acids, fatty acid esters, and their binary and ternary mixtures [Reference Sarier and Onder10]. Paraffin waxes are considered as one of the most promising candidates for their high enthalpy value, low vapor pressure in the melting process, good chemical stability, self-nucleating behavior, safety, and commercial availability at low cost [Reference Zhang and Wang11]. However, the application of paraffin is limited to the leakage and loss during the phase change process [Reference Sharma, Tyagi, Chen and Buddhi2, Reference Zhao and Zhang12]. To overcome this problem, expanded graphite (EG) [Reference Zhang and Fang13], foam copper, and diatomite have been used as the matrix material to support paraffin at the liquid state [Reference Tan, Lin, Liu, Wang, Kang and Ran14].
EG possesses many desirable properties suitable for the PCM application. Theoretically, good thermal stability and high specific surface area (2630 m2/g) are both advantageous for shape stabilization during the solid–liquid transition of PCMs [Reference Zhang, Lin, Yang, Di and Jiang15]. Because of capillary forces and surface tension between n-octadecane and EG, the problem of leakage can be easily prevented.
What else, high supercooling degree and low crystal growth rate are two unresolved problems existing for the application of PCMs [Reference Parameshwaran, Jayavel and Kalaiselvam16]. Some researchers used sodium chloride (NaCl) to promote nucleation of n-octadecane [Reference Yang, Luo, Li, Song, Liu and Tang17]. Although NaCl can effectively reduce the supercooling degree of n-octadecane, phase separation between NaCl and n-octadecane could gradually take place, resulting in NaCl's failure to promote nucleation of n-octadecane.
In this study, we introduce a convenient and environmentally friendly route to the preparation of novel shape-stabilized PCMs of EG–NaCl composites. To our knowledge, the composite has not been reported previously. Then, the thermal cycling performances and other thermal properties of the resulted PCMs were analyzed to investigate their potential application in the thermal energy storage field.
Results and discussion
Synthetic strategy
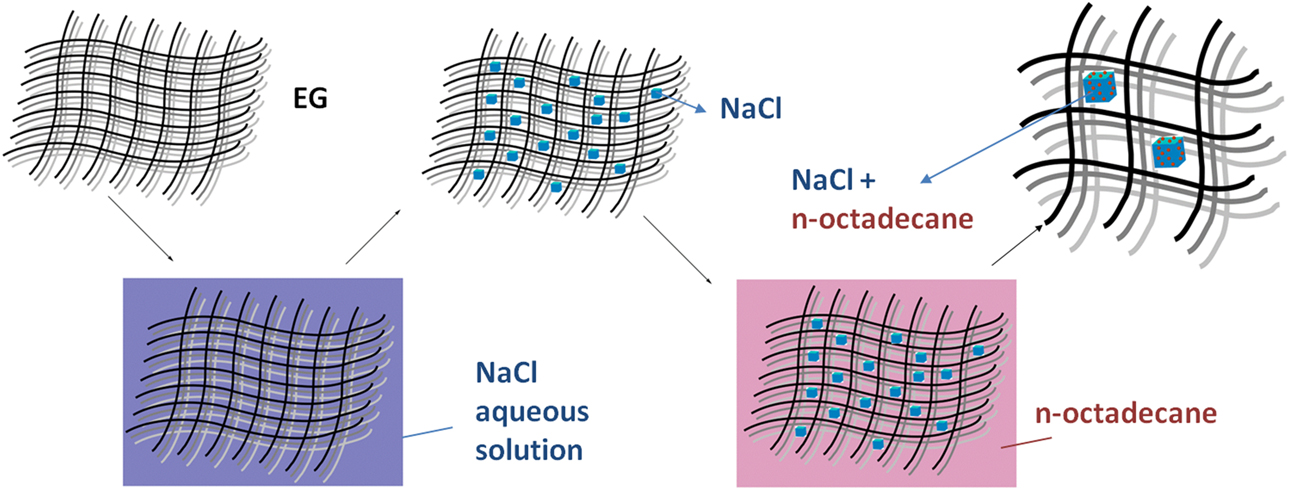
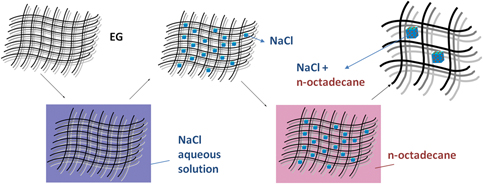
As shown in Fig. 1, the synthetic strategy is depicted by the schematic illustration. A typical fabrication procedure for the PCMs could be described as follows: EG is a porous material that consists of overlapped graphite flakes and numerous crevice-like and net-like pores [Reference Karaipekli, Sari and Kaygusuz18]. First, EG powders were added into a NaCl aqueous solution under magnetic stirring at 400 r/min. After 12 h of heating and stirring, the mixtures were dried in a vacuum oven at 60 °C for 24 h to evacuate air and water. Then the NaCl–EG composites were added into the excess melted n-octadecane and kept in the water bath with a constant temperature at 40 °C for 12 h for the saturated absorption of n-octadecane. Finally, the powder-type PCMs were obtained after being maintained in an oven at 45 °C for 12 h.
Schematic strategy of PCMs.

Morphology and EDS spectrum of NaCl–EG composites
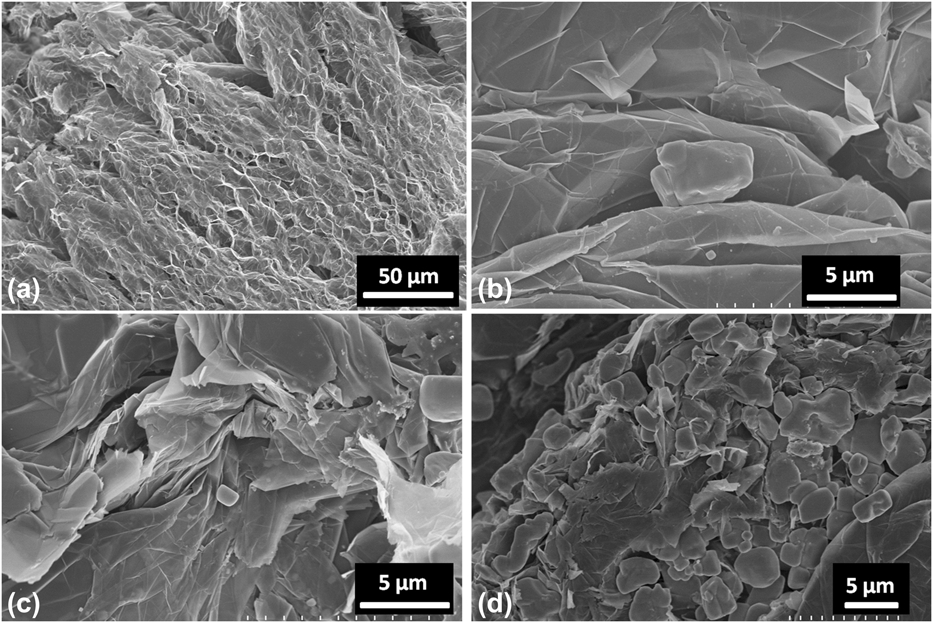
The SEM images of EG and NaCl–EG composites with different amounts of NaCl are shown in Fig. 2. As shown in Fig. 2(a), EG consists of overlapped graphite flakes and numerous crevice-like and net-like pores. This means EG is a good matrix material to store PCMs. From the amplified SEM images in Figs. 2(b)–2(d), the NaCl particles exhibiting a regular cuboid are found to be crystallized onto the flakes of EG with a size of 1–5 μm. It can be also observed from Fig. 2(b) that there are a lot of smaller NaCl crystals existing between the two graphite layers. In Fig. 2(c), it can be found that there is an increase of NaCl crystals when the amount of NaCl in the composite is increased to 1 g. Furthermore, the smaller NaCl crystals between the layers of graphite sheet are also increased, indicating that the NaCl crystals can be dispersed into the EG matrix evenly. With the further increase of the amount of NaCl, too many NaCl crystals have occupied the pores or interlayer gaps of EG as shown in Fig. 2(d), which results in the uneven distribution of NaCl crystals.
SEM micrographs of EG and NaCl–EG composites: (a) EG; (b) 0.5 g NaCl–EG; (c) 1 g NaCl–EG; (d) 6 g NaCl–EG.

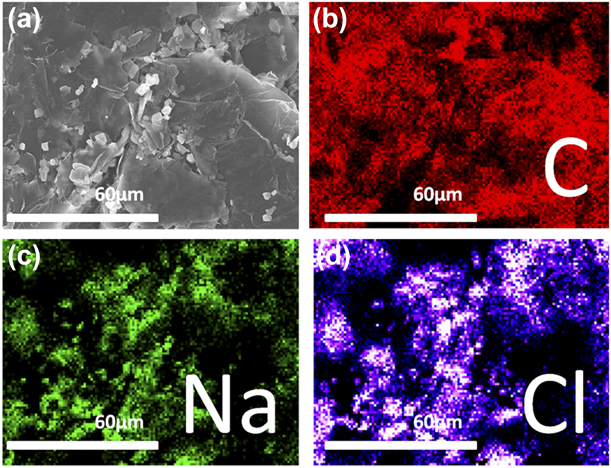
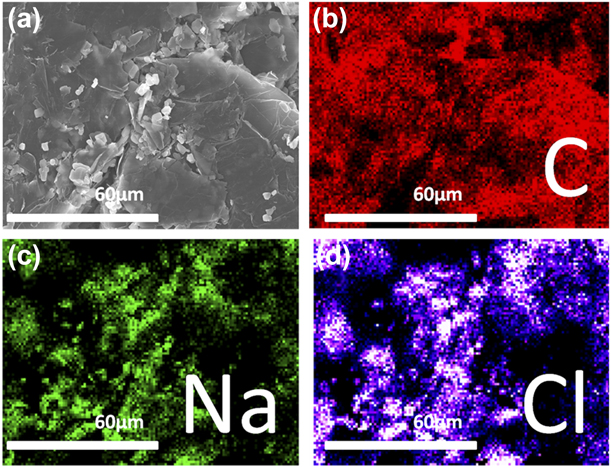
To further confirm the NaCl crystals on the graphite sheet, energy dispersive spectroscope (EDS) measurement is performed to analyze the chemical compositions of 1 g NaCl–EG composites. Figure 3 shows the distribution of C, Na, and Cl atoms in the composites. The C atom distribution represents the distribution of EG and the Na and Cl distribution represents the distribution of NaCl, which indicates the existence of NaCl in 1 g NaCl–EG composites. Also, it further proves the evenly distribution of NaCl in the matrix material EG as shown in Figs. 3(c) and 3(d).
EDS spectrum of 1 g NaCl–EG composites: SEM micrograph of the selected area (a) and element distribution of C (b), Na (c) and Cl (d).
Morphology of PCMs
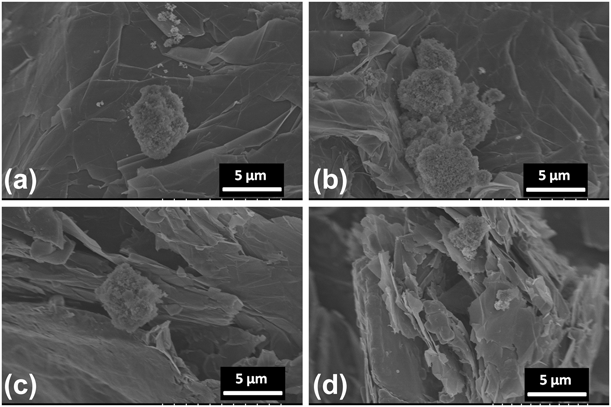
Figure 4 illustrates the SEM images of PCM-1. As shown in Fig. 4, n-octadecane has been adsorbed and filled into the NaCl–EG composites successfully. And the crystallization of n-octadecane on the surface of NaCl crystals could be clearly observed, whereas almost none of n-octadecane crystals exist on the surface of EG. This indicates that these NaCl crystals can promote the heterogeneous crystallization of n-octadecane, whereas EG as the matrix material has little positive effect on the crystallization of n-octadecane. What else, the shapes of n-octadecane crystals are consistent with the shapes of NaCl crystals from the comparison of Figs. 3 and 4. This means the proportion of heterogeneous crystallization of n-octadecane resulting from the nucleating agents of NaCl is greater than homogeneous crystallization of n-octadecane. And the heterogeneous crystallization can effectively reduce the supercooling degree of n-octadecane accordingly. In Figs. 4(a) and 4(b), it can be seen that n-octadecane crystals are distributed on the flakes of EG. In Figs. 4(c) and 4(d), it can be observed that the n-octadecane crystals are filled in the pores between the EG layers. These further prove the evenly distribution of n-octadecane crystals in the matrix material EG.
SEM micrographs of PCM-1: (a), (b), layers surface structure; (c), (d) interlayer structure.

FTIR characterization
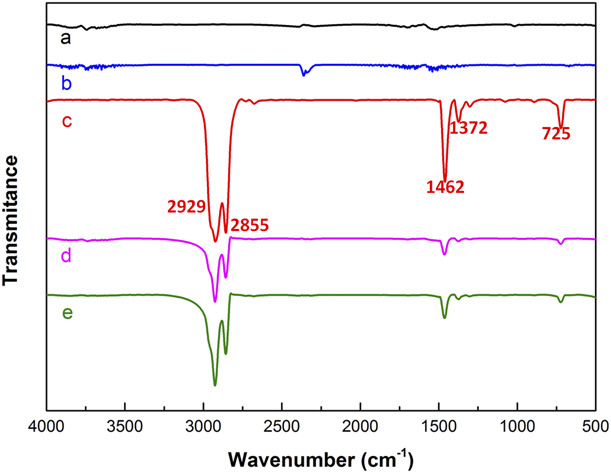
The Fourier transformed infrared spectrophotometer (FTIR) spectra of EG, NaCl, n-octadecane, and PCMs are presented in Fig. 5. In the case of EG and NaCl, there are no obvious infrared characteristic peaks. This indicates that EG and NaCl have no absorption bands in the range of 450–4000 cm−1. It is caused by the poor test results of FTIR for metal bonds and pure ionic bond compounds. The peaks appearing at 2929, 2855, 1462, 1372, and 725 cm−1 shown in Fig. 5(c) can be identified as n-octadecane contrasting with the standard spectra. The two strongest characteristic absorption peaks of n-octadecane at 2929 and 2855 cm−1 are ascribed to the methyl radical and methylene radical stretching vibration bands of C–H. While the peaks appearing at around 1462 and 1372 cm−1 belong to the deformation vibration of –CH2 and –CH3, and the peak at 725 cm−1 results from the in-plane rocking vibration of –CH2 [Reference Zhao, Luo, Wang, Song and Tang19].
FTIR spectra: (a) EG; (b) NaCl; (c) n-octadecane; (d) PCM-0; (e), PCM-1.

In the FTIR spectrum of PCMs shown in Figs. 4(d) and 4(e), all of the characteristic peaks are consistent with the standard spectra of n-octadecane, which suggests that no new chemical bonds have been found in the composite. In view of the above discussion, no chemical reaction occurs between EG, NaCl, and n-octadecane in the synthesis of PCMs.
Thermal properties of n-octadecane and PCMs
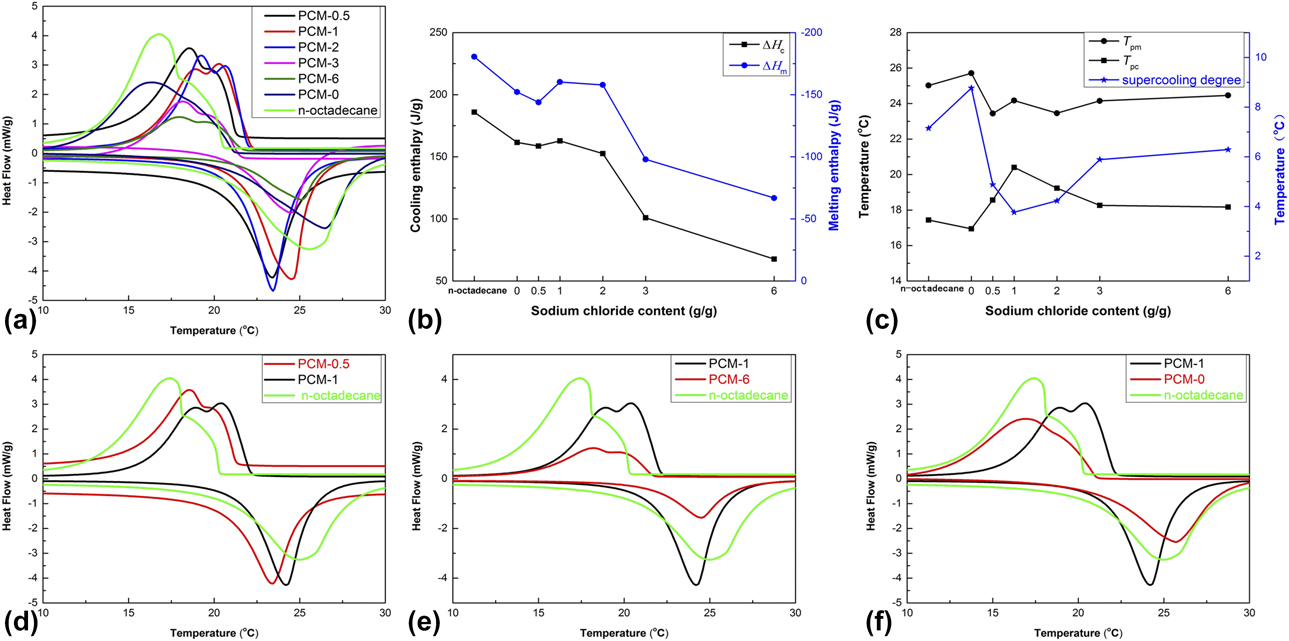
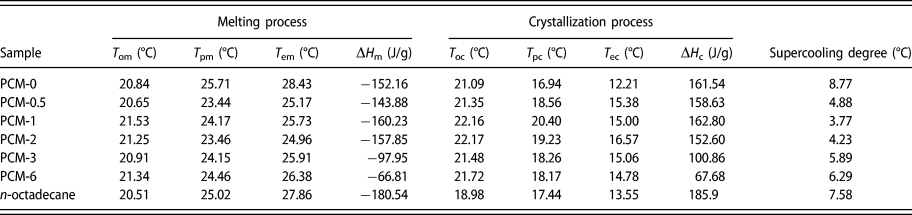
Figure 6(a) shows the differential scanning calorimeter (DSC) curves of n-octadecane and the PCMs with various weight ratios of NaCl. Thermal properties of n-octadecane and PCMs obtained from Fig. 6(a), including onset temperature, peak temperature, endset temperature, and enthalpies, are shown in Table I. As shown in Fig. 6(a), n-octadecane is found to present an intensive crystallization peak at 17.44 °C and a less obvious weak peak at 18.13 °C corresponding to the solidification process. Since n-octadecane can be heterogeneously nucleated from the liquid phase to form a metastable rotator phase at the transformation temperature close to the bulk crystallization temperature [Reference Kousksou, Arid, Jamil and Zeraouli20]. The two kinds of phase transition including homogeneous crystallization and heterogeneous crystallization correspond to the two-phase transformation temperature, respectively. And the heterogeneous crystallization is largely attributed to the crucible wall during the DSC test.
DSC curves (a, d, e, f); cooling and melting enthalpy (b); peak temperature and supercooling degree (c).

Thermal properties of n-octadecane and PCMs.

Note: T om, T oc: onset temperature on DSC curve; T pm, T pc: peak temperature on DSC curve; T em, T ec: endset temperature on DSC curve; ΔH m, ΔH c: enthalpy on DSC curve.
As shown in Fig. 6(d), with the increase of the addition amount of NaCl, it is obvious to see that two intensive crystallization peaks, including the rotator phase transformation peak and the bulk crystallization peak, on the crystallization curve of PCM-0.5 and PCM-1. When the amount of NaCl is 0.5 g, the rotator phase transformation peak is not significantly enhanced. Especially, the two crystallization peaks become comparable when the addition amount of NaCl is 1 g [Fig. 6(a)]. As shown in Fig. 6(e), with the further increase in the amount of NaCl to 6 g, the enthalpy of PCM-6 decreases drastically. It is well explained that too much NaCl, which has occupied the pores, will reduce the absorption of n-octadecane by EG. These prove that when the addition amount of NaCl is 1 g, not only the heterogeneous crystallization of n-octadecane can be promoted but also the high enthalpy of PCMs can be maintained. As shown in Fig. 6(f), it is hardly to find the peak of the rotator phase of PCM-0 during the solidification process, and the major peak temperature shows a shift to lower temperature compared to that of n-octadecane. This further proves that there is little effect of EG on the heterogeneous crystallization of n-octadecane through the solidification process. As seen at PCM-1, the two crystallization temperatures including T oc, T pc, and T ec display significant shift to the higher value when compared with n-octadecane and PCM-0. The results indicate that the NaCl crystals can serve as the effective nucleating agents and promote the solidification process of n-octadecane.
Furthermore, the influence of NaCl on the degree of supercooling between the exothermal and endothermal peak temperatures is shown in Fig. 6(c). The supercooling degree is slightly higher than that of pure n-octadecane when no NaCl was added to the PCMs. It is easily understandable that EG alone has a negative impact on solidification process of n-octadecane. However, the supercooling degree declines rapidly with the addition of NaCl and reaches the lowest value of 3.77 °C with the addition amount of 1 g. This can be explained by the promotion of NaCl on the solidification process of n-octadecane as mentioned above. And then the supercooling degree increases gradually and eventually approaches a constant value at about 6.3 °C. The result indicates that the accumulated NaCl crystals as shown in Fig. 2(d) have an adverse effect on the freezing process of n-octadecane.
The influence of NaCl on the capability in storing thermal energy (represented by latent heat) is illustrated in Fig. 6(b). Both the cooling enthalpy curves and melting enthalpy curves of the PCMs are showing a similar law. When the content of NaCl is less than 2 g, the enthalpies of PCMs are practically identical to each other. This means that a bit of NaCl has a little impact on the thermal energy storage of PCMs. However, the enthalpies of PCMs show a downward trend with the further addition of NaCl. It is understandable that the thermal energy storage properties of PCMs are greatly influenced by the excess amount of NaCl.
Thermal cycling performance of PCM-C and PCM-1
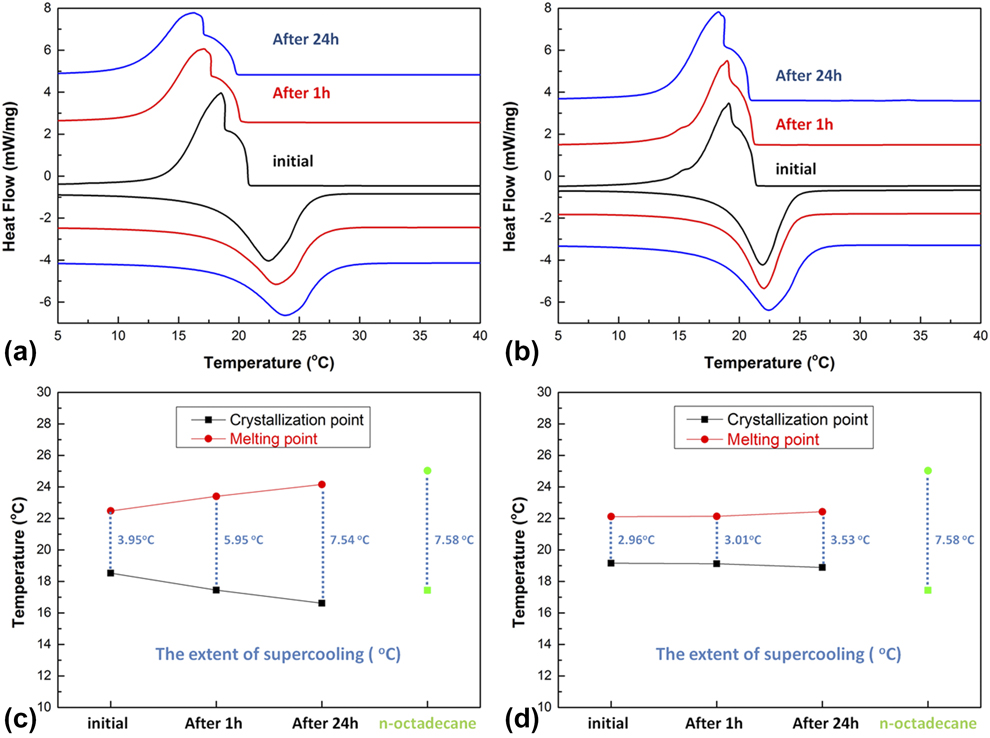
To characterize the thermal cycling performance of PCM-1, PCM-C is synthesized as a comparison. Both PCM-C and PCM-1 are divided into three groups. The first one was kept at the initial state. The other two were maintained in an oven at 45 °C for 1 h and 24 h, respectively. The DSC curves of PCM-C and PCM-1 processed at different conditions are shown in Figs. 7(a) and 7(b), and the extents of supercooling of PCM-C and PCM-1 are shown in Figs. 7(c) and 7(d). After maintained in an oven at 45 °C for 1 h, the crystallization peak of PCM-C shows an obvious shift to the lower temperature. And the supercooling degree of PCM-C increases to 7.54 °C after maintained at 45 °C for 24 h, which is close to the supercooling degree of n-octadecane at 7.58 °C. This means NaCl in PCM-C is no longer served as a nucleating agent after maintained at 45 °C for 24 h. It can be explained as below. NaCl crystals distributed in n-octadecane are in unstable state. After maintained at 45 °C, phase separation between NaCl and n-octadecane gradually happens. As time goes by, NaCl will be completely separated from n-octadecane. This will lead to the degradation effect of NaCl on the nucleation of n-octadecane.
The cyclic DSC curves of (a) PCM-C and (b) PCM-1; the extent of supercooling of (c) PCM-C and (d) PCM-1.

As shown in Figs. 7(b) and 7(d), the crystallization peak of PCM-1 shows little shift after the thermal process. And the supercooling degree of PCM-1 only increases from 2.96 °C to 3.01 °C and 3.53 °C after maintained at 45 °C for 1 and 24 h. This means that NaCl can keep the nucleating effect of n-octadecane in PCM-1 as usual even after the heating process. It can be explained that NaCl was confided in the pores of the matrix material of EG and the phase separation between NaCl and n-octadecane can be prevented even when maintained at 45 °C. All of these results prove that the thermal cycling performance of n-octadecane has been improved by EG–NaCl composites.
Thermal stability of n-octadecane and PCMs
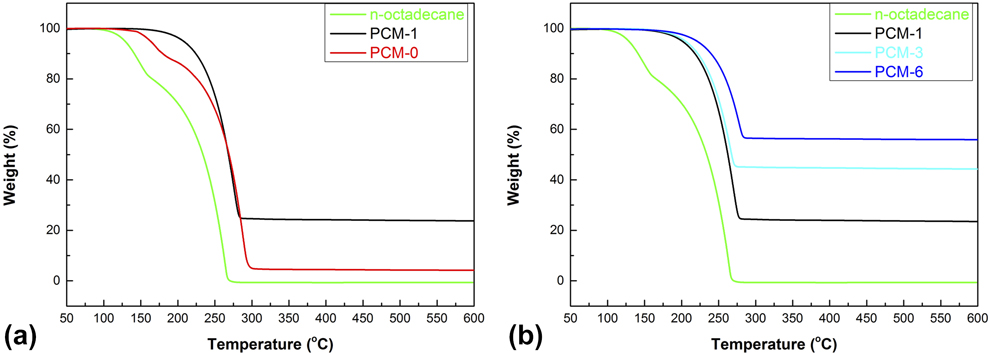
Figure 8(a) presents the thermal gravimetric analyzer (TGA) curves of n-octadecane, PCM-1, and PCM-0, and Fig. 8(b) presents the TGA curves of n-octadecane, PCM-1, PCM-3, and PCM-6. The results indicate that the n-octadecane begins losing weight nearby 100 °C and there is almost no substance left at 270 °C. And EG and NaCl are well known to have no quality loss below 600 °C. These mean that the weight loss of PCMs is mainly caused by the decomposition of n-octadecane. As shown in Fig. 8(a), the decomposition of PCM-1 happens at 150 °C compared with 125 °C of PCM-0, whereas the initial decomposition of n-octadecane is occurred at 100 °C. This indicates that both NaCl and EG are helpful for the thermal stability of PCMs.
TGA curves of n-octadecane and PCMs.

As shown in Fig. 8(b), the PCMs exhibit an improved thermal stability with the increasing addition amount of NaCl. The results may be attributed to the fact that partial of the pore channels could be occupied by the NaCl crystals, resulting in the thermal protection of NaCl crystals on n-octadecane accordingly. Hence, the weight loss ranges from 44 to 75% with different percentages of NaCl in PCMs.
Conclusions
A novel shape-stabilized PCM with high latent heat, low supercooling degree, good thermal cycling performance, and enhanced thermal stability is synthesized. In the composite, EG and NaCl are used as matrix material and nucleating agent, respectively. The SEM images show that the particle size of dispersed NaCl crystals can almost be less than 5 μm and n-octadecane can effectively crystallize on the surface of NaCl crystals. EDS spectra indicate that the even distribution of NaCl grains in the EG matrix. FTIR results confirm that no chemical reaction occurs between EG, NaCl, and n-octadecane in the synthesis process of PCMs. The results obtained from DSC and TGA indicate that the PCMs have enhanced thermal stability and good thermal cycling performance. The optimal PCMs have a phase enthalpy of 162.8 J/g and a supercooling degree of 3.7 °C. Therefore, the shape-stabilized PCMs in this study exhibit a high heat storage capability, low supercooling degree, good thermal cycling performance, and enhanced thermal stability, showing a great candidate for thermal regulation materials.
Experimental
Materials
The n-octadecane (99 wt%) with a melting point at about 28 °C served as PCM was supplied by Tianjin Chemical Reagents Company (Tianjin, China). Analytical grade sodium chloride (NaCl) was offered by Alfa Aesar (Shanghai, China). The expanded graphite (EG) was obtained from Shanghai Chemical Regents Co. (Shanghai, China). All of the chemicals were used as received without further purification.
Preparation of NaCl–EG composites
Different amounts of NaCl, ranging from 0.5, 1, 2, 3 to 6 g, were dissolved in the excessive deionized water to formulate aqueous solution, and then heated and maintained at 60 °C. Then 1 g EG powder was put into NaCl aqueous solution under the magnetic stirring at 400 r/min. After 12 h of heating and stirring, the mixtures were dried in a vacuum oven at 60 °C for 24 h to evacuate air and water. Finally, the powder-type NaCl–EG composites were obtained.
Preparation of PCMs
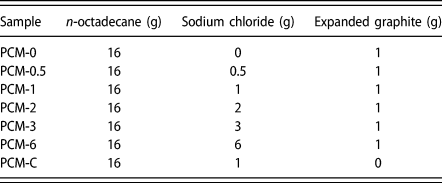
First, 16 g of n-octadecane was completely melted and weighted in the beakers. Then, different amounts of the powder-type NaCl–EG composites were added into the breakers and kept in the water bath with constant temperature of 40 °C for 12 h for the saturated absorption of n-octadecane. In addition, the composite of pure EG and n-octadecane as the contrast was also fabricated in the similar way. Subsequently, these composites were maintained in an oven at 45 °C for 12 h. And the extra n-octadecane will be absorbed by the filter papers. The fabricated composites were referred to as PCM-0, PCM-0.5, PCM-1, PCM-2, PCM-3, and PCM-6 corresponding to the PCMs in which the addition amount of NaCl is 0, 0.5, 1, 2, 3, and 6 g as shown in Table II. For comparisons, the PCM-C sample was fabricated by adding 1 g of NaCl to 16 g of n-octadecane in the water bath at 40 °C for 12 h of the magnetic stirring at 400 r/min without the supporting material of EG.
The formulations for the preparation of various types of PCMs.

Characterization
The field emission scanning electron microscope (FESEM, S4800, Hitachi, Tokyo, Japan) was used to observe the surface morphology of composites. Elemental analysis was accomplished by energy dispersive spectroscope (EDS) attached to SEM. Fourier transformed infrared spectrophotometer (FTIR, Vertex 70, Bruker, Karlsruhe, Germany) was used to analyze the component of composites. The samples were mixed with KBr and pressed into pellet. FTIR spectra in the absorbance mode were recorded in the range of 450–4000 cm−1. Thermal storage properties of composites were measured by differential scanning calorimeter (DSC; 823E, METTLER TOLEDO, Zurich, Switzerland) under argon atmosphere at the heating rate of ±5 °C/min from 0 to 50 °C and a flow rate of 60 mL/min. The thermal gravimetric analyzer (TGA; TGA/DSC1, METTLER TOLEDO, Zurich, Switzerland) was used to characterize the thermal stability of the composite. The measurements were conducted from 25 to 600 °C with a heating rate of 10 °C/min in argon atmosphere.