INTRODUCTION
Tapeworms (Platyhelminthes, Cestoda) are endoparasites that depend on two different organisms for their life cycle. The parasites’ embryos develop into metacestodes (the larval forms) via oncospheres in intermediate invertebrate or vertebrate hosts and these larvae sexually mature in other vertebrates that act as definitive hosts. Four genera of tapeworms infect humans opportunistically during the larval (Echinococcus and Taenia) or adult (Hymenolepis and Diphyllobothrium) stage and thus, have a significant medical impact (Smyth and McManus, Reference Smyth and McManus1989). Species of Echinococcus granulosus complex parasitize the small intestine of canids as an adult, whereas embryos develop into metacestodes in diverse hosts including sheep, cattle, pig, horse and camel, depending on its genotype (Thompson and McManus, Reference Thompson and McManus2002). Humans can also act as an intermediate host upon accidental ingestion of eggs, the majority of which develop into cysts in the liver and lungs. The cystic echinococcosis (CE), infection of E. granulosus metacestodes, is a widespread and severe zoonosis, which is particularly prevalent in the Mediterranean, central Asia, Northern and Eastern Africa, Australia and southern South America (Jenkins et al. Reference Jenkins, Romig and Thompson2005; da Silva, Reference da Silva2010). The annual incidence of CE ranges from 1 to 200 per 100 000 inhabitants and more than 20 million people are at risk of infection in endemic areas (Craig et al. Reference Craig, McManus, Lightowlers, Chabalgoity, Garcia, Gavidia, Gilman, Gonzalez, Lorca, Naquira, Nieto and Schantz2007).
Neodermatan platyhelminthes have evolved endo- (Trematoda and Cestoda) and ecto-parasitic (Monogenea) mode of life. Phylogenetic analyses based on molecular information showed that cestodes and trematodes form a monophyletic clade, and monogeneans form a basal paraphyletic clade with respect to them. This fact might suggest that obligate parasitism has arisen only once during the course of platyhelminth evolution (reviewed in Olson and Tkach, Reference Olson and Tkach2005; Littlewood, Reference Littlewood, Maule and Marks2006). Cladistic investigations further assumed that ectoparasitism between free-living flatworms and fish preceded endoparasitism, and that cestodes and trematodes share a common ancestor despite significant differences in their life histories. Compared with other human-invading helminths, cestodes display characteristics such as the complete loss of a gut and a modified, segmented body plan, making them an extreme representative of parasitism (Thompson and McManus, Reference Thompson and McManus2002). Therefore, cestodes are likely to have undergone a series of genomic modifications related to their unique phenotypes.
The genome sizes of cyclophyllidean tapeworms examined (haploid DNA content per cell) were ranged from 114·9 (E. granulosus) to 141·1 Mb (Hymenolepis microstoma) (Tsai et al. Reference Tsai, Zarowiecki, Holroyd, Garciarrubio, Sanchez-Flores, Brooks, Tracey, Bobes, Fragoso, Sciutto, Aslett, Beasley, Bennett, Cai, Camicia, Clark, Cucher, De Silva, Day, Deplazes, Estrada, Fernández, Holland, Hou, Hu, Huckvale, Hung, Kamenetzky, Keane and Kiss2013). The values were seemingly much smaller than those of trematodes and turbellarian, Schistosoma mansoni (364·5 Mb; Protasio et al. Reference Protasio, Tsai, Babbage, Nichol, Hunt, Aslett, De Silva, Velarde, Anderson, Clark, Davidson, Dillon, Holroyd, LoVerde, Lloyd, McQuillan, Oliveira, Otto, Parker-Manuel, Quail, Wilson, Zerlotini, Dunne and Berriman2012), Clonorchis sinensis (547·1 Mb; Huang et al. Reference Huang, Chen, Wang, Liu, Chen, Guo, Luo, Sun, Mao, Liang, Xie, Zhou, Tian, Lv, Huang, Zhou, Hu, Li, Zhang, Lei, Li, Hu, Liang, Xu, Li and Yu2013) and Schmidtea mediterranea (480 Mb; http://genome.wustl.edu/genomes/detail/schmidtea-mediterranea/). The difference in genome size is partly due to changed copy numbers and intron lengths of functional gene families. However, one of the major factors contributing to size variation might include transposable elements (TEs), which have differentially shrunk or expanded in genomes of these parasites (Berriman et al. Reference Berriman, Haas, LoVerde, Wilson, Dillon, Cerqueira, Mashiyama, Al-Lazikani, Andrade, Ashton, Aslett, Bartholomeu, Blandin, Caffrey, Coghlan, Coulson, Day, Delcher, DeMarco, Djikeng, Eyre, Gamble, Ghedin, Gu, Hertz-Fowler, Hirai, Hirai, Houston, Ivens and Johnston2009; Wang et al. Reference Wang, Chen, Huang, Sun, Men, Liu, Luo, Guo, Lv, Deng, Zhou, Fan, Li, Huang, Hu, Liang, Hu, Xu and Yu2011; Olson et al. Reference Olson, Zarowiecki, Kiss and Brehm2012; Tsai et al. Reference Tsai, Zarowiecki, Holroyd, Garciarrubio, Sanchez-Flores, Brooks, Tracey, Bobes, Fragoso, Sciutto, Aslett, Beasley, Bennett, Cai, Camicia, Clark, Cucher, De Silva, Day, Deplazes, Estrada, Fernández, Holland, Hou, Hu, Huckvale, Hung, Kamenetzky, Keane and Kiss2013). In the E. granulosus genome, the total length of retrotransposon sequences was approximately 136 kb (0·09%), which was highly contrasted to those of S. mansoni (75 Mb, 20%), Schistosoma japonicum (78·8 Mb, 19·8%) and C. sinensis (60·18 Mb, 11%) (Huang et al. Reference Huang, Chen, Wang, Liu, Chen, Guo, Luo, Sun, Mao, Liang, Xie, Zhou, Tian, Lv, Huang, Zhou, Hu, Li, Zhang, Lei, Li, Hu, Liang, Xu, Li and Yu2013; Zheng et al. Reference Zheng, Zhang, Zhang, Zhang, Li, Lu, Zhu, Wang, Huang, Liu, Kang, Chen, Wang, Chen, Yu, Gao, Jin, Gu, Wang, Zhao, Shi, Wen, Lin, Jones, Brejova, Vinar, Zhao, McManus, Chen and Zhou2013). Based on these findings, it was speculated either that retrotransposons have entered a degenerative phase in the cyclophyllidean cestode genomes or that expansion of these mobile elements is tightly regulated by the donor organisms.
Retrotransposons are class I mobile genetic elements abundantly found in the majority of eukaryotic genomes (Boeke and Stoye, Reference Boeke, Stoye, Coffin, Hughes and Varmus1997). By replicating their progenies onto novel genomic loci via mRNA intermediates, these elements exert great influence on genome remodelling and generation of intragenomic variation, which can ultimately lead to speciation (McDonald, Reference McDonald1990; Long et al. Reference Long, Lyman, Morgan, Langley and Mackay2000). A change in whole genome size is also highly attributable to the self-replicating activity of TEs (Kidwell, Reference Kidwell2002). Of multiple retrotransposon families (Capy, Reference Capy2005), the Ty3/gypsy family appeared to be the major family in the E. granulosus genome (Tsai et al. Reference Tsai, Zarowiecki, Holroyd, Garciarrubio, Sanchez-Flores, Brooks, Tracey, Bobes, Fragoso, Sciutto, Aslett, Beasley, Bennett, Cai, Camicia, Clark, Cucher, De Silva, Day, Deplazes, Estrada, Fernández, Holland, Hou, Hu, Huckvale, Hung, Kamenetzky, Keane and Kiss2013). There have been no reports on retrotransposons of Taeniid cestodes, except for a recent study describing a non-autonomous terminal-repeat retrotransposon in miniature (ta-TRIM) and an autonomous long-terminal-repeat (LTR) retrotransposon (lennie) in Echinococcus multilocularis (Koziol et al. Reference Koziol, Radio, Smircich, Zarowiecki, Fernández and Brehm2015). In the present study, the structural properties and evolutionary status of these representative LTR retrotransposons were investigated in E. granulosus with significantly shrunken genome size. The probable domestication of a gag gene, which originated from one of these retroelements, was also examined by analysing the degree of syntenic conservation and type of selective pressure acting on the gene.
MATERIALS AND METHODS
Identification and retrieval of Ty3/gypsy-like retrotransposons in E. granulosus genome
The draft genome of E. granulosus was surveyed with the Gag-Pol sequences of CsRn1 (C. sinensis, AAK07487), Ty3 (Saccharomyces cerevisiae, Q7LHG5), Penelope (Drosophila virilis, U49102), Copia (Drosophila melanogaster, X04456), Bel (D. melanogaster, U23420) and DIRS1 (Dictyostelium discoideum, M11340) using the tBLASTn program in GeneDB (http://www.genedb.org/blast/submitblast/GeneDB_Egranulosus, assembly version 3). Pol proteins encoded in non-LTR LINE-1 (human, L19088) and CRE1 elements (Crithidia fasciculate, M33009), as well as E. granulosus proteins annotated as reverse transcriptases (RTs) in the GeneDB protein database, were also applied in the homology search. Hits with a BLAST score over 100 and a length larger than 100 were selected for further examination (E-value < 1·0e-06). Sequences displaying values under the thresholds were also considered significant if the matching segments were sequentially located close or between strong hits in both the query and the subject sequences.
Sequence analyses
Pol protein sequences encoded in E. granulosus retrotransposons were determined based on the tBLASTn alignments. Coding profiles of the corresponding nucleotide sequences were also examined by using the open reading frame (ORF) Finder program at National Center for Biotechnology Information (NCBI, http://www.ncbi.nlm.nih.gov/gorf/gorf.html). Sequence information between hits and premature stop codons(s) was treated as missing data. Amino acids of the RT domain that were tightly conserved in diverse retroelements (Xiong and Eickbush, Reference Xiong and Eickbush1990), were extracted by homology-based matching of these polypeptides against the CsRn1 Pol sequence. These amino acid sequences were aligned with those of other LTR retrotransposons representing each of the distinct clades of the Ty3/gypsy family (Malik and Eickbush, Reference Malik and Eickbush1999; Bae et al. Reference Bae, Moon, Kong, Cho and Rhyu2001, Reference Bae, Ahn, Kim, Rhyu, Kong and Cho2008; DeMarco et al. Reference DeMarco, Kowaltowski, Machado, Soares, Gargioni, Kawano, Rodrigues, Madeira, Wilson, Menck, Setubal, Dias-Neto, Leite and Verjovski-Almeida2004) using the ClustalX program (Thompson et al. Reference Thompson, Gibson, Plewniak, Jeanmougin and Higgins1997). LTR retrotransposons of parasitic platyhelminths including S. mansoni were also included in the structural comparison. The alignment was used in a phylogenetic analysis using MEGA (version 6.0; Tamura et al. Reference Tamura, Stecher, Peterson, Filipski and Kumar2013). The analytical options were as follows: the Jones–Taylor–Thornton (JTT) model for amino acid substitution, estimation of invariant site proportion from the input data, and rate heterogeneity with eight gamma category (the gamma parameter was estimated from the dataset by MEGA). The gaps introduced during alignment and the missing data mentioned above were deleted in a pairwise manner, and the neighbour-joining algorithm was adapted for tree construction. The statistical significance of each branching node was estimated by a bootstrap analysis of 1000 replicates. The tree was displayed with the TreeView program (Page, Reference Page1996). A portion of the retrieved elements were employed in the phylogenetic analysis using sequence information supplemented with RNase H (RH) and integrase (IN) domains, if possible, to increase the analytical resolution (Malik and Eickbush, Reference Malik and Eickbush1999).
Selective pressure acting on each codon of the gag gene was investigated using the maximum-likelihood algorithm of MEGA by evaluating the differences between non-synonymous (dN) and synonymous substitution (dS), dN – dS (0, neutral; -, negative selection; +, positive selection). The maximum-likelihood tree (bootstrap value 1000) used in the analysis was also constructed by the program based on the nucleotide alignment of cestode gag sequences.
Determination of full-length retrotransposons
Nucleotide sequences (approximately 20 kb) encompassing the segmental pol-like genes were extracted from each of the scaffolds and used as queries in the BLASTn searches of the draft E. granulosus genome. Multiple scaffolds retrieved by a single query were compared with one another and then, a common genetic element was isolated from them by BL2Seq at NCBI, as described previously (Bae et al. Reference Bae, Ahn, Kim, Rhyu, Kong and Cho2008). Terminal repeats flanking a protein-encoding internal region were determined similarly by the program. Structural integrity of mobile elements was further verified by recognizing duplicated target sequences from the direct upstream and downstream regions of the 5′- and 3′-LTRs. The consensus nucleotide sequence of full-unit retrotransposon was determined by comparing multiple copy sequences using the GeneDoc program and its coding profile was predicted using ORF Finder. The consensus sequence was also applied in the retrieval and characterization of homologous elements from the E. multilocularis and Taenia solium genomes (BLASTn). The full-unit retrotransposons were used in the phylogenetic analysis as described above and the construction of distance matrix based on the nucleotide sequence homology with the MEGA program.
RESULTS
Retrieval of Ty3/gypsy-like retrotransposons in E. granulosus
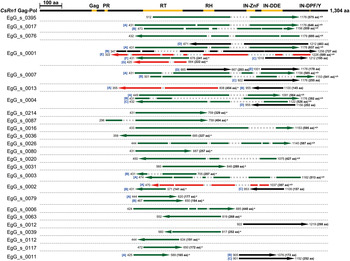
The draft genome of E. granulosus in GeneDB was surveyed with Pol sequences of CsRn1 and Ty3 to isolate the Ty3/gypsy-like LTR retrotransposons (tBLASTn algorithm, E-value < 1e-06). A total of 46 homologous sequences were isolated from 25 scaffolds during this examination (Fig. 1 and Supplementary table 1). The lengths and positions of the matched regions, and the statistical significance levels varied among hits, while a significant fraction of these sequences contained a region for RT (34 elements, 73·9%). ORFs encoded in all retrieved sequences were heavily corrupted by multiple premature stop codons. Otherwise, they displayed discontinuous matching patterns against queries with short gaps and/or changes in reading frames between hits. The average length of the retrieved sequences was 1279·1 ± 728·63 bp (including gapped regions; 420–2492 bp) or 1078·4 ± 521·58 bp (excluding gapped regions; 420–2130 bp) (Supplementary table 1). Searches using Pol proteins in Xena- (Penelope), Copia- (Copia) and Bel-family (Bel) members did not show any significant match, while that of DIRS1 (DIRS family) detected multiple sequences that overlapped to the results with CsRn1 and Ty3 (data not shown). No homologous sequence was also retrievable with the Pol protein of CRE1; however, human LINE-1 detected a single scaffold sequence (pathogen_EgG_scaffold_0325, 5397 bp; identities >95% at the amino acid and nucleotide levels), which might have originated from contaminating human DNA.
Similarity patterns in Echinococcus granulosus LTR retrotransposons. The predicted amino acid sequences of partial retrotransposons retrieved from the draft genome of E. granulosus were mapped against the homologous regions of the CsRn1 Gag-Pol protein, based on tBLASTn results. The identity of each element was distinguished by the entry number of the respective scaffold and when needed, by a subsequent English alphabet (e.g. EgG-s-00017-A or EgG-s-0017-B, where s abbreviates scaffold). Arrowheads direct the relative orientations of retrotransposons in the scaffolds and the dotted-arrow regions mark the gaps between hits during the BLAST searches. The starting and end points of matched sequences in CsRn1 Gag-Pol are provided at both ends of each arrow. Numerals in parentheses indicate the length of the matched sequences. PR, protease; RT, reverse transcriptase; RH, RNase H; IN-ZnF, Zn-finger motif of integrase; IN-DDE, DDE motif of IN; IN-DPF/Y, DPF/Y motif of IN. aElements used in the RT-based phylogenetic analysis (Fig. 2) and bthose used in RT–RH–IN-based examination (Fig. 3). Red and green arrows indicate the CsRn1- and Saci-2-like elements, respectively.

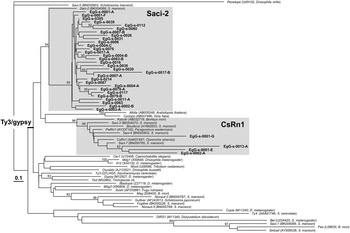
Phylogenetic positions of Echinococcus granulosus retrotransposons against the representative family members. The neighbour-joining tree was constructed with amino acid sequences of RT using MEGA. The identities of E. granulosus retrotransposons in bold letters were marked with the respective entry numbers of scaffold sequences occasionally followed by an English alphabet. Numerals at the major branching nodes indicate their percentages of appearance in 1000 bootstrap replicates.

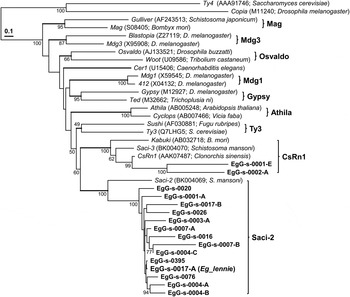
Pol-based phylogeny of Echinococcus granulosus LTR retrotransposons. The amino acid sequences of major Pol domains (RT, RH and IN) were summed to construct the neighbour-joining tree. The tree was rooted with Copia and Ty4. The identities of E. granulosus retrotransposons in bold letters were distinguished with the scaffold entry numbers occasionally followed by an English alphabet. Numerals at the major branching nodes indicate their percentages of appearance in 1000 bootstrap replicates. The major clades of the Ty3/gypsy family are marked in the tree.

Six entries named RT were also detected in the GeneDB database of E. granulosus. The coding sequences of the corresponding genes were intervened by one (EgrG_000078300, EgrG_000332600, EgrG_002017100 and EgrG_000438600) or seven (EgrG_000864400 and EgrG_000487300) introns. When considering their genomic loci, some of these rt genes were overlapped with those in Fig. 1 (EgrG_000078300 = EgG-s-0395, EgrG_000332600 = EgG-s-0031, EgrG_002017100 = EgG-s-0001-F and EgrG_000864400 = EgG-s-0017-A). EgrG_000438600 was matched to an endonuclease (EN)-RT protein of C. sinensis (GAA53638, E value = 7e-30), which suggested that the protein is highly related to a non-LTR retrotransposon. Inconsistent with its name, EgrG_000487300 did not contain any Pol-related domain, but possessed a YTH domain of YTH family proteins that act in the removal of meiosis-specific gene transcripts expressed in mitotic cells (Harigaya et al. Reference Harigaya, Tanaka, Yamanaka, Tanaka, Watanabe, Tsutsumi, Chikashige, Hiraoka, Yamashita and Yamamoto2006).
Classification of E. granulosus retrotransposons
The amino acid sequences of 34 RT-containing hits were predicted largely based on their tBLASTn alignments. The RT sequences (153·4 ± 32·02 amino acids in lengths, Supplementary Fig. 1) were combined with those of various retrotransposons representing distinct clades/families of LTR retrotransposons. LTR retrotransposons isolated in parasitic trematodes were also included in the analysis. After alignment, the sequence information was used in a phylogenetic analysis. As shown in Fig. 2, a neighbour-joining tree tightly separated members of Mag, Mdg1, Gypsy and, Athila clades, although the relationships of other clade members including those of Ty3 and Mag were somewhat ambiguous, which may be due to limited information in the RT-based phylogeny (Malik and Eickbush, Reference Malik and Eickbush1999). Interestingly, distribution of E. granulosus retrotransposons appeared to be restricted only within CsRn1 (four elements; red-coloured in Fig. 1) and Saci-2 (30 elements; green coloured in Fig. 1) clades. Branch nods connecting each of the clade members were well-supported statistically by bootstrap analysis (bootstrap values 96 and 54, respectively).
Where possible, amino acids were similarly isolated from the rh and in domains of E. granulosus retrotransposons, as well as the representative Ty3/gypsy elements. The sequences were combined with their respective RT sequences and used in a phylogenetic analysis. Members of the previously well-defined clades were strongly co-clustered in the neighbour-joining tree (Fig. 3). As in the RT-based tree, the 16 E. granulosus elements selected in this analysis were segregated into CsRn1 (two elements) and Saci-2 (14 elements) clades (bootstrap values 100). Another tree constructed with the minimum evolution algorithm showed a topology similar to that of the neighbour-joining tree (data not shown).
Analysis of full-unit retrotransposons and their mobile potential
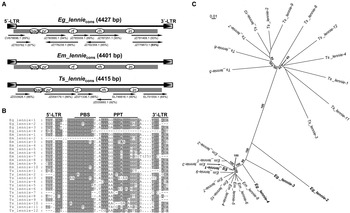
Full-length retrotransposons encompassing the partial pol sequences shown in Fig. 1 were surveyed in the E. granulosus genome. A majority of these elements were heavily truncated by segmental deletions and thus, their integral structures with two flanking LTRs were not readily defined. Nonetheless, a degenerate copy of whole-unit retrotransposon encompassing EgG-s-0017-A could be isolated from a genomic scaffold sequence (pathogen_EgG_scaffold_0017, nucleotide positions 945 896–950 285). The element comprised 4390 bp including 5′- and 3′-LTRs (236 and 235 bp, respectively; 93% similarity), and was bound by a slightly modified 5-bp target site duplication (TSD, CTAGT/CTATT). A consensus 4427-bp sequence was obtained using homologous genomic segments from GenBank (40 entries, 2340 ± 892·3 bp in length) and other full-unit copies, which were similarly determined from the E. granulosus genome (Supplementary table 2). The theoretical sequence contained an ORF for a 1327-amino acid Pol protein (Fig. 4A). Homologous elements were also identified in the genomes of E. multilocularis and T. solium (Fig. 4A and Supplementary table 2). The E. multilocularis element appeared to be identical to lennie that was previously described by Koziol et al. (Reference Koziol, Radio, Smircich, Zarowiecki, Fernández and Brehm2015) and thus, the E. granulosus and T. solium elements were named Eg_lennie and Ts_lennie, respectively. These taeniid elements were bounded by direct repeats of 4- or 5-base nucleotides known as TSDs and conserved structural/functional motifs including LTRs that initiated as TG and terminated as CA, primer-binding site (PBS) for LeutRNA and poly-purine tract (PPT), although none of them retained its coding sequence (Fig. 4B; see also Koziol et al. Reference Koziol, Radio, Smircich, Zarowiecki, Fernández and Brehm2015). The degrees of divergence in LTRs and internal region sequences of lennie copies were similar in E. granulosus (0·574 ± 0·062 and 0·232 ± 0·009) and T. solium (0·524 ± 0·032 and 0·261 ± 0·005), while the values were much lower in E. multilocularis (0·261 ± 0·005 and 0·076 ± 0·002) (P values < 0·001 in t test of pairwise distance matrices; Fig. 4C and Supplementary table 3). The clustering pattern of lennie copies in Fig. 4C further suggested that the element had expanded independently in each of the taeniid genomes. Meanwhile, a single copy in E. granulosus (Eg_lennie-1) was tightly co-clustered with the Em_lennie copies, especially with Em_lennie-3, which demonstrated that lennie had been inserted in the corresponding locus before divergence of E. granulosus and E. multilocularis. The nucleotide sequences flanking Eg_lennie-1 and Em_lennie-3 showed similarity values larger than 85% (data not shown).
Characterization of Echinococcus granulosus lennie. (A) Overall structure of the theoretically determined consensus sequence of Eg_lennie (Eg_lennie cons). Boxes containing black arrowheads represent the flanking LTRs. The grey bar indicates an ORF containing gag, protease (pr), reverse transcriptase (rt), RNase H (rh) and integrase (in) regions. Arrows at the bottom mark the positions and orientations of the expressed sequences tags matched to Eg_lennie cons. Numerals in parentheses are their similarity values. Structures of orthologous elements in Echinococcus multilocularis (Em_lennie) and Taenia solium (Ts_lennie) were also presented. (B) Structural/functional motifs of lennie elements. After alignment of full-unit lennie copies, the boundary nucleotides of 5′- and 3′-LTRs, PBS and PPT were defined. Dashes were introduced during the sequence alignment to increase similarity values and dots were inserted to separate the distinct motifs. (C) Phylogenetic analysis of the full-length lennie elements. The analysis was performed with MEGA based on the alignment of internal region sequences of lennie elements. The tree was constructed using the neighbour-joining algorithm. Numerals at branch nodes indicate their percentage of appearances in 1000 bootstrap replicates.

BLAST searches of the E. granulosus expressed sequence tag (EST) database in GenBank with the nucleotide sequence of Eg_lennie cons recognized several ESTs including JZ787251·1 (95%), JZ791468·1 (93%) and JZ779873·1 (93%). Although these ESTs were matched to various regions of Eg_lennie cons (arrows in Fig. 4A), several in-frame stop codons were detected in all sequences. The Pol sequences of Eg_lennie cons, CsRn1 and Ty3 (tBLASTn algorithm) showed results similar to that obtained using the Eg_lennie cons nucleotide sequences. Screening of T. solium EST databases using the Ts_lennie cons sequence showed a result similar to that of Eg_lennie cons. ESTs homologous to Em_lennie cons could not be retrieved from E. multilocularis ESTs (Fig. 4A).
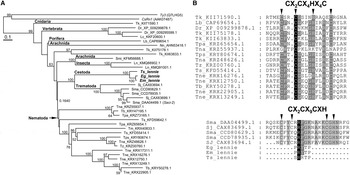
The amino acid sequences of lennie elements showed highest similarities to Gag-Pol of Saci-2-like elements isolated from various invertebrates including Schistosoma and Trichinella species (E-values < 2e-177; Fig. 5A). Homologues were also detected in teleost fish such as Danio rerio and Larimichthys crocea. Gag proteins encoded in these Saci-2-like elements conserved the conventional nucleocapsid motif CX2CX4HX4C, except for those detected in schistosomes. The motif was slightly modified as CX2CX9CXH in the schistosome elements (see also DeMarco et al. Reference DeMarco, Kowaltowski, Machado, Soares, Gargioni, Kawano, Rodrigues, Madeira, Wilson, Menck, Setubal, Dias-Neto, Leite and Verjovski-Almeida2004). However, none of the nucleocapsid motifs known in the LTR retrotransposons could be detected in the taeniid lennie elements (Fig. 5B).
Phylogenetic analysis of lennie elements detected in Echinococcus granulosus (Eg_lennie), Echinococcus multilocularis (Em_lennie) and Taenia solium (Ts_lennie). (A) The neighbour-joining tree of lennie and other Saci-2-like elements was constructed using the sum of amino acids comprising RT, RH, and IN. Ty3 of Saccharomyces cerevisiae and CsRn1 of Clonorchis sinensis were included in the analysis as outgroup members. The identities of elements were given as species names of donor organisms and their GenBank accession numbers. Tk, Thelohanellus kitauei; Lb, Lubomirskia baicalensis; Nn, Nuttalliella namaqua; Ts, Trichuris suis; Tpa, Trichinella papuae; Tne, Trichinella nelson; Tb, Trichinella britovi; Tm, Trichinella murrelli; Tps, Trichinella pseudospiralis; Tna, Trichinella native; Tz, Trichinella zimbabwensis; Smi, Stegodyphus mimosarum; Ln, Lasius niger; Sj, Schistosoma japonicum; Sma, Schistosoma mansoni; Dr, Danio rerio; Lc, Larimichthys crocea. (B) Nucleocapsid motifs conserved in the Gag proteins of Saci-2-like elements. Dots were introduced in the alignment to increase similarity values. Arrowheads indicate the conventional CCHC or unique CCCH signatures.

Characterization of a gag gene endogenized in the E. granulosus genome
The Pol-based phylogenetic trees demonstrated that E. granulosus LTR elements belong to either the CsRn1 or Saci-2 clade (Figs 2 and 3). Since all the partial sequences did not cover gag regions except for lennie (Figs 1 and 5), it could not be addressed whether these retrotransposons preserved the unique CHCC (Bae et al. Reference Bae, Moon, Kong, Cho and Rhyu2001) and CCCH (DeMarco et al. Reference DeMarco, Kowaltowski, Machado, Soares, Gargioni, Kawano, Rodrigues, Madeira, Wilson, Menck, Setubal, Dias-Neto, Leite and Verjovski-Almeida2004) Gag motifs, except for lennie. A BLAST search with the CsRn1 Gag isolated only a single scaffold sequence of the E. granulosus genome (pathogen_EgG_scaffold_0005, E-value = 3·4e-07), but the scaffolds shown in Supplementary table 1 were not retrievable by the Gag sequence. The ORF Finder program predicted an ORF of 233 codons in the matched region (nucleotide positions 5 559 972–5 560 670), of which the transcribed products were detected in the GenBank EST database (JZ785456·1, JZ784648·1 and JZ792189·1). A BLAST search using the theoretical protein sequence provided a result identical to that with CsRn1 Gag. Meanwhile, no significant match was found in the genome database using Saci-2 Gag as a query.
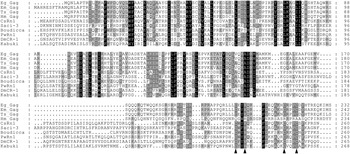
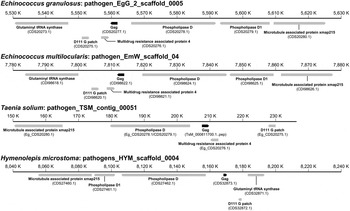
Orthologues of the E. granulosus solo Gag protein, which had been previously annotated in GenBank (CDS20277·1), were isolated in other cestode parasites including E. multilocularis (CDI98622·1), H. microstoma (CDS32873·1) and T. solium (GeneDB, TsM_000811700·1..pep). These proteins exhibited identity values of 19–95% to one another or to the CsRn1-clade Gags. All proteins, except for the H. microstoma Gag, contained the tightly conserved CHCC nucleocapsid motif in their C-terminal regions (arrowheads in Fig. 6). To better understand the evolutionary origin of the cestode solo gags, the syntenic relationship of neighbouring genes was examined in the gag-containing genomic scaffolds. As shown in Fig. 7, six genes (glutamyl tRNA synthase, D111 G patch, multidrug resistance associated protein 4, phospholipase D, phospholipase D1 and microtubule-associated protein xmap215) were clustered with the gag gene within a 100 kb region on the pathogen_EgG_2_scaffold_0005. This gene cluster was also detected in the genomic scaffolds of E. multilocularis (pathogen_EmW_scaffold_04), T. solium (pathogen_TSM_contig_00051, 236 kb) and H. microstoma (pathogen_HYM_scaffold_0004), although the synteny covered approximately 150 kb in H. microstoma and phospholipase D1 was not detected in the T. solium sequence. The relative orientations of these syntenic genes were also fully conserved in the cestodes. Of the 231 consensus codons in the cestode gag genes, 144 (62·34%) codons showed dN – dS < 0 indicating purifying selection, while 35 codons (15·15%) diverged neutrally without selection pressure (Supplementary Fig. 2).
Comparison of primary structures between Echinococcus granulosus solo Gag and its orthologues. The amino acid sequences of cestode Gag orthologues in E. granulosus (Eg_Gag, CDS20277·1), Echinococcus multilocularis (Em_Gag, CDI98622·1), Taenia solium (Ts_Gag, TsM_000811700·1..pep) and Hymenolepis microstoma (Hm_Gag, CDS32873·1) were aligned with those of CsRn1-like LTR retrotransposons. Dots represent the gaps introduced in the alignment to increase similarity values. Arrowheads indicate the unique CHCC signature conserved in the nucleocapsid domain of CsRn1-like elements. The retrotransposons used in the comparison are as follows: CsRn1 of Clonorchis sinensis (AAK07487); Saci-3 of Schistosoma mansoni (BK004070); Boudicca of S. mansoni (DAA04496); PwRn1 of Paragonimus westermani (AY237162); DmCR-1 of Drosophila melanogaster (AE003787); Kabuki of Bombyx mori (AB032718).

Comparative structures of cestode genomic loci encompassing orthologues of the solo gag gene identified in Echinococcus granulosus. The position of the gag gene (Black) was mapped on each genomic scaffold in the 150 kb (E. granulosus and Echinococcus multilicularis) or 200 kb (Hymenolepis mircostoma) scale. The protein products of the neighbouring genes are indicated in grey with their GenBank accession numbers (in case of Taenia solium genes, identity numbers in GeneDB are used). The relative transcriptional directions are represented by arrowheads.

DISCUSSION
Expansion and deletion of retrotransposon-related sequences has been considered one of the major factors that change the size of eukaryotic genomes. Cyclophyllidean cestodes possess genomes with much smaller sizes compared to closely related trematode or more basal turbellarian species. In an effort to address the shrinkage process in cestode genomes, structural and evolutionary features of LTR retrotransposons were investigated by surveying the E. graulosus genome. The E. granulosus retrotransposons examined belonged to CsRn1 or Saci-2 clades of the Ty3/gypsy family. The structural integrity and coding potential of these elements were heavily corrupted by sporadic base substitutions and segmental deletions, even though they seemed to be the major TEs occupying the parasite's genome. Apart from the degenerate and inactive copies, a solo active gag gene homologous to those of CsRn1 clade members was also detected in the genomes of E. granulosus and other taeniid cestodes. The gene was likely to be ‘endogenized’ in the genomes of cestode parasites including E. granulosus, to play a role(s) beneficial to host organisms.
Unlike prokaryotes, eukaryotic organisms have varied in genome size over 6000-fold (approximately 20–130 000 Mb; Animal Genome Size Database, http://www.genomesize.com), with a distribution bias skewed toward smaller values <5000 Mb (Oliver et al. Reference Oliver, Petrov, Ackerly, Falkowski and Schofield2007; Dufresne and Jeffery, Reference Dufresne and Jeffery2011). Genome size tends to increase in proportion to the size of cell/nucleus and duration of cell division, both of which negatively influence the developmental rate of donor organisms (reviewed in Dufresne and Jeffery, Reference Dufresne and Jeffery2011). Therefore, rapidly growing or invasive organisms have evolved genomes with a smaller size (Lavergne et al. Reference Lavergne, Muenke and Molofsky2010; Dufresne and Jeffery, Reference Dufresne and Jeffery2011). The overall genome sizes were strikingly reduced in cyclophyllidean tapeworms compared to their evolutionary neighbours mainly due to decreases in intron lengths and retrotransposon ratios (Tsai et al. Reference Tsai, Zarowiecki, Holroyd, Garciarrubio, Sanchez-Flores, Brooks, Tracey, Bobes, Fragoso, Sciutto, Aslett, Beasley, Bennett, Cai, Camicia, Clark, Cucher, De Silva, Day, Deplazes, Estrada, Fernández, Holland, Hou, Hu, Huckvale, Hung, Kamenetzky, Keane and Kiss2013; Zheng et al. Reference Zheng, Zhang, Zhang, Zhang, Li, Lu, Zhu, Wang, Huang, Liu, Kang, Chen, Wang, Chen, Yu, Gao, Jin, Gu, Wang, Zhao, Shi, Wen, Lin, Jones, Brejova, Vinar, Zhao, McManus, Chen and Zhou2013). In E. granulosus, the average intron length and retrotransposon ratio were 726 bp and 0·09%, respectively, whereas they were 1692 bp and 20·0% in S. mansoni (Zheng et al. Reference Zheng, Zhang, Zhang, Zhang, Li, Lu, Zhu, Wang, Huang, Liu, Kang, Chen, Wang, Chen, Yu, Gao, Jin, Gu, Wang, Zhao, Shi, Wen, Lin, Jones, Brejova, Vinar, Zhao, McManus, Chen and Zhou2013). However, the average number of introns in the coding genes was similar in both species (approximately 5). Considering that TEs play a central role in expansion of intron size (Jiang and Goertzen, Reference Jiang and Goertzen2011), it could be suggested that withdrawal of TEs from these cestode genomes is the most potent mechanism, if not the only one, associated with the greatly shrunken genome sizes.
Petrov et al. (Reference Petrov, Lozovskaya and Hartl1996) have proposed that deletion of nucleotides occurring in dead-on-arrival (DOA) copies of retrotransposons is essential to maintain or generate a smaller genome. In E. granulosus, Ty3/gypsy-family retrotransposons appeared to be heavily corrupted, especially by segmental DNA loss. Thus, it was difficult to isolate their full-unit sequences (only that of Eg_lennie was successfully defined in this study). Given the sizes of trematode (five species, 911·5 ± 396·02 Mb) and turbellarian (61 species, 2018·3 ± 3092·80 Mb) genomes in the Animal Genome Size Database (release 2·0), cestodes might also have had genomes with sizes similar to those of their neighbours in an early evolutionary period, as is the case of Spirometra erinaceieuropaei (1260 Mb; Bennett et al. Reference Bennett, Mok, Gkrania-Klotsas, Tsai, Stanley, Antoun, Coghlan, Harsha, Traini, Ribeiro, Steinbiss, Lucas, Allinson, Price, Santarius, Carmichael, Chiodini, Holroyd, Dean and Berriman2014). Thereafter, the genomes were likely to have shrunken gradually, which followed the inactivation of retrotransposons and/or accumulation of their DOA copies. The genetic/genomic damages and metabolic costs generated by the TE explosion are known to invoke natural selection against proliferating TEs (Charlesworth and Langley, Reference Charlesworth and Langley1989). The approved mechanisms that effectively repress TEs include CpG island methylation, heterochromatin formation, repeat-induced point mutation and action of the piwi gene (Blumenstiel, Reference Blumenstiel2011; Dufresne and Jeffery, Reference Dufresne and Jeffery2011). To date, there have been no reports on the molecular machinery regulating retrotransposons in parasitic platyhelminths including cestodes, although a neodermatan-specific argonaute gene has been suggested to play a role similar to that of the piwi gene in S. mansoni (Collins et al. Reference Collins, Wang, Lambrus, Tharp, Iyer and Newmark2013; Wang et al. Reference Wang, Collins and Newmark2013). Nevertheless, it could be suggested that smaller genomes in parasitic cestodes provide advantages to adapt to or overcome the physicochemical barriers in host environments, such as accelerated growth/development rate and reduced metabolic costs. As an example, small genome size is likely to be highly advantageous in reducing the metabolic cost of DNA replication in E. granulosus, which lacks enzymes involved in de novo synthesis of purine and pyrimidine bases (Zheng et al. Reference Zheng, Zhang, Zhang, Zhang, Li, Lu, Zhu, Wang, Huang, Liu, Kang, Chen, Wang, Chen, Yu, Gao, Jin, Gu, Wang, Zhao, Shi, Wen, Lin, Jones, Brejova, Vinar, Zhao, McManus, Chen and Zhou2013).
A phylogenetic analysis of multiple lennie copies demonstrated that these copies had expanded independently in each of their host genomes, similar to ta-TRIM (Fig. 4C; Koziol et al. Reference Koziol, Radio, Smircich, Zarowiecki, Fernández and Brehm2015). The genomic positions of only a single pair (Eg_lennie-1 and Em_lennie-3) were found to be orthologous in E. granulosus and E. multilocularis (>85% identities in their flanking nucleotide sequences), suggesting its insertion before divergence of the host species. Like the genomic copies, the ESTs of E. granulosus and T. solium, which were homologous to lennie, contained multiple premature stop codons. Therefore, Eg_lennie and Ts_lennie might also have lost their mobile potential, similar to Em_lennie (Koziol et al. Reference Koziol, Radio, Smircich, Zarowiecki, Fernández and Brehm2015). Considering the lowest distance values, lennie seemed to have amplified most recently in E. multilocularis (Supplementary table 3). Investigations on the characterization of lennie homologs in diphyllobothroid tapeworms including S. erinaceieuropaei and role(s) of the mRNAs transcribed from the DOA copies of lennie might be helpful in understanding the genomic implication of lennie in association with the evolution of cestode parasites.
LTR retrotransposons identified in E. granulosus were classified exclusively as Saci-2- or CsRn1-clade members (Figs 2 and 3). Saci-2 described in S. mansoni is known to encode Gag with a unique CCCH nucleocapsid motif (DeMarco et al. Reference DeMarco, Kowaltowski, Machado, Soares, Gargioni, Kawano, Rodrigues, Madeira, Wilson, Menck, Setubal, Dias-Neto, Leite and Verjovski-Almeida2004). A major fraction of E. granulosus retrotransposons formed a novel clade in the phylogeny of the Ty3/gypsy family together with Saci-2. The Saci-2 clade further included elements identified in a broad range of donor organisms from cnidarians to vertebrates (Fig. 5A). It was apparent that the characteristic CCCH Gag motif specifically emerged in Schistosoma retrotransposons, although its biological implications remain unclear. Saci-2-like elements detected in other taxa conserved the canonical CCHC motif in their corresponding regions. Interestingly, nucleotide sequences of taeniid lennie cons encoding the probable C-terminus of Gag were highly divergent and therefore, none of the Gag motifs was defined (Fig. 5B). It was also apparent that lennie with the degenerate gag sequence had independently multiplied in each taeniid genome (Fig. 4C). Gag function is critical for the assembly of viral-like particles (VLPs) during retrotransposition (Boeke and Stoye, Reference Boeke, Stoye, Coffin, Hughes and Varmus1997). Therefore, it seems likely that the indispensable activity is complemented in trans by a Gag or Gag-like protein expressed by another retrotransposon or chromosomal gene (Schulman, Reference Schulman2012). Alternatively, the degenerate form of lennie Gag is possibly engaged in VLP formation, even if the efficiency is reduced.
The occasional domestication of TE genes including retroviruses has been demonstrated with the env gene of endogenous retroviruses (ERVs) found in eutherian mammals, as well as the universal meiotic recombinase, DNA repair protein Rad51 and telomerase RT. Fixation of gags originating from LTR retrotransposons/retroviruses was also reported in mammals (Volff, Reference Volff2006). Unlike parasitic TE sequences, the captured gene is subject to strong selective pressure exerted by the host due to its beneficial effect(s). In eutherian mammals, the Env protein plays a key role during placental development (Sinzelle et al. Reference Sinzelle, Izsvák and Ivics2009; Haig, Reference Haig2012). Gag proteins are also involved in diverse biological processes such as the control of cell proliferation and apoptosis, early embryonic angiogenesis, and restriction of viral replication (reviewed in Volff, Reference Volff2006). The ORFs of Ty3/gypsy-like LTR retrotransposons in the E. granulosus genome were heavily corrupted by insertions/deletions and/or base substitutions, which demonstrated loss of mobile potential and thus, underwent neutral evolution. However, a gag gene with the CHCC nucleocapsid motif, which might have originated from a CsRn1-like retrotransposon (Bae et al. Reference Bae, Moon, Kong, Cho and Rhyu2001), was found to preserve its coding potential for 232-aa polypeptide. Orthologous genes were further detected in the tightly conserved synteny of other cestode parasites (Figs 6 and 7). The mRNA sequences of the gag gene were readily detected in E. granulosus (fragments per kilobase of transcript per million mapped reads [FPKM] 6 in protoscolex), E. multilocularis (FPKM 1 and 4 in pre-gravid and gravid, respectively) and H. microstoma (FPKM 11 in adult) during RNA-Seq data analysis (Tsai et al. Reference Tsai, Zarowiecki, Holroyd, Garciarrubio, Sanchez-Flores, Brooks, Tracey, Bobes, Fragoso, Sciutto, Aslett, Beasley, Bennett, Cai, Camicia, Clark, Cucher, De Silva, Day, Deplazes, Estrada, Fernández, Holland, Hou, Hu, Huckvale, Hung, Kamenetzky, Keane and Kiss2013). Collectively, these data suggest that the gag gene has been captured as a host gene in cestodes.
Retroviral Gag is the primary structural protein functioning in viral assembly. Though being highly diversified among viral groups, Gag is separated into three functional polypeptides, named matrix (MA), capsid (CA) and nucleocapsid (NC) proteins, by proteolytic cleavage. In retroviruses, these segmental proteins play specific roles in membrane targeting of Gag polyproteins for capsid assembly, formation of the hydrophobic core of the virion (Gag–Gag interaction) and RNA packaging, respectively (Boeke and Stoye, Reference Boeke, Stoye, Coffin, Hughes and Varmus1997; Maldonado et al. Reference Maldonado, Martin, Mueller, Zhang and Mansky2014). Two zinc-finger motifs conserved in NC are essential for the recognition of and/or binding to a specific region of the viral RNA genome (Gorelick et al. Reference Gorelick, Henderson, Hanser and Rein1988; Muriaux et al. Reference Muriaux, Costes, Nagashima, Mirro, Cho, Lockett and Rein2004). NC is also known to be involved in nucleolar trafficking/accumulation of viral Gag (Lochmann et al. Reference Lochmann, Bann, Ryan, Beyer, Mao, Cochrane and Parent2013). Information of Gag function(s) encoded in LTR retrotransposons, especially on those with the un-conventional nucleocapsid motifs, is limited. Therefore, it is not easy to predict the physiological implication of the retrotransposon-derived gag gene in E. granulosus. Biochemical characterization of the Gag protein including its spatiotemporal expression pattern and DNA/RNA binding activity would provide important clues elucidating its role(s) in relation to parasitic cestode-specific function.
The total length of retrotransposon-related sequences analysed in this study was approximately 58·84 kb, which comprised 43·3% of the total retrotransposons identified in the E. granulosus genome (136 kb; Zheng et al. Reference Zheng, Zhang, Zhang, Zhang, Li, Lu, Zhu, Wang, Huang, Liu, Kang, Chen, Wang, Chen, Yu, Gao, Jin, Gu, Wang, Zhao, Shi, Wen, Lin, Jones, Brejova, Vinar, Zhao, McManus, Chen and Zhou2013). Since Pol, especially RT, of retrotransposons can be used to detect one another in homology-based gene fishing, the present data would represent the real aspects of autonomous E. granulosus LTR retrotransposons preserving an analysable length. In general, eukaryotic genome with a smaller size harbours less copies but more diverse clades of LTR retrotransposons and vice versa (Volff et al. Reference Volff, Bouneau, Ozouf-Costaz and Fischer2003). E. granulosus, which has evolved a smaller genome than those of its phylogenetic neighbours, contained numerous copies of degenerate LTR retrotransposons belonging to only two clades (Saci-2 and CsRn1) of the Ty3/gypsy family. Therefore, parasitic cestodes might have had a larger genome, where less diverse LTR retrotransposons had over-expanded, during an early evolutionary stage and then, the mobile elements became inactive in parallel in cyclophyllidean species. The intrinsic DNA losses of inactive copies were likely to have contributed to decrease in genome size. Investigation of retrotransposons in pseudophyllidean cestodes with larger genomes such as S. erinaceieuropaei is required to address issues regarding the evolutionary history of retrotransposons and their genomic implications in cestode parasites.
SUPPLEMENTARY MATERIAL
The supplementary material for this article can be found at http://dx.doi.org/10.1017/S0031182016001499.
FINANCIAL SUPPORT
This work was supported by the Basic Science Research Programme of the National Research Foundation of Korea (NRF), which was funded by the Ministry of Science, ICT and Future Planning (Grant no. NRF-2013R1A1A2012011).