Introduction
The goal of most applied experimental research in agricultural soil management is to find the treatments that cause the highest crop yield. However, most cropping system improvements and adaptations are originated by farmers rather than experimental stations or test plots (Adhikari et al., Reference Adhikari, Araya, Aruna, Balamatti, Banerjee, Baskaran, Barah, Behera, Berhe, Boruah, Dhar, Edwards, Fulford, Gujja, Ibrahim, Kabir, Kassam, Khadka, Koma, Natarajan, Perez, Sen, Sharif, Singh, Styger, Thakur, Tiwari, Uphoff and Verma2018). This is because the research knowledge transferred to farmers often does not consider the multiple factors influencing agricultural systems. Experimental research recommends that the treatments should be evaluated on statistically significant differences of a few response variables. However, the technical optimum usually does not correspond to the economic optimum (Lanfranco and Helguera, Reference Lanfranco and Helguera2006), and the interaction among the environmental, social, and economic dimensions may not be considered in experiments based on yield evaluations and environmental impact or profitability variables (e.g., Gu et al., Reference Gu, Han, Fan, Shi, Kong, Shi, Siddique, Zhao and Li2018; Wang et al., Reference Wang, Palta, Chen, Chen and Deng2018).
Pretty et al. (Reference Pretty, Sutherland, Ashby, Auburn, Baulcombe, Bell, Bentley, Bickersteth, Brown, Burke, Campbell, Chen, Crowley, Crute, Dobbelaere, Edwards-Jones, Funes-Monzote, Godfray, Griffon, Gypmantisiri, Haddad, Halavatau, Herren, Holderness, Izac, Jones, Koohafkan, Lal, Lang, McNeely, Mueller, Nisbett, Noble, Pingali, Pinto, Rabbinge, Ravindranath, Rola, Roling, Sage, Settle, Sha, Shiming, Simons, Smith, Strzepeck, Swaine, Terry, Tomich, Toulmin, Trigo, Twomlow, Vis, Wilson and Pilgrim2010) examined strategies to establish a consensus in developing and testing metrics of sustainability in different agricultural systems that are appropriate and acceptable to several agroecological, social, economic, and political contexts. To perform agricultural sustainability assessments, tools (metrics) have focus on evaluating the sustainability of traditional production systems already established (e.g., Afshar and Dekamin, Reference Afshar and Dekamin2022; Akinnifesi et al., Reference Akinnifesi, Makumba and Kwesiga2006; Astier et al., Reference Astier, Speelman, López-Ridaura, Masera and Gonzalez-Esquivel2011; Moore et al., Reference Moore, Dormody, VanLeeuwen and Harder2014; Starkl et al., Reference Starkl, Brunner, Das and Singh2022; Uphoff, Reference Uphoff2003; Van Asselt et al., Reference Van Asselt, Van Bussel, Van der Voet, Van der Heijden, Tromp, Rijgersberg, Van Evert and Van Wagenberg2014; van der Vossen, Reference van der Vossen2005). However, to date, there are no tools to assess the sustainability of the treatments (cropping systems) evaluated through experimentation. Deytieux et al. (Reference Deytieux, Munier-Jolain and Caneill2016) stated that sustainability assessments should be oriented to new crop alternatives developed through experimentation or modeling. These assessments will allow farmers to adopt the recommendations and leading public science to become proactive rather than reactive (Pretty et al., Reference Pretty, Sutherland, Ashby, Auburn, Baulcombe, Bell, Bentley, Bickersteth, Brown, Burke, Campbell, Chen, Crowley, Crute, Dobbelaere, Edwards-Jones, Funes-Monzote, Godfray, Griffon, Gypmantisiri, Haddad, Halavatau, Herren, Holderness, Izac, Jones, Koohafkan, Lal, Lang, McNeely, Mueller, Nisbett, Noble, Pingali, Pinto, Rabbinge, Ravindranath, Rola, Roling, Sage, Settle, Sha, Shiming, Simons, Smith, Strzepeck, Swaine, Terry, Tomich, Toulmin, Trigo, Twomlow, Vis, Wilson and Pilgrim2010).
Considering that key soil functions in the ecosystem allow essential provision, regulation, culture, and support services (Adhikari and Hartemink, Reference Adhikari and Hartemink2016) and the impact of production strategies depends on the soil, many of the agricultural sustainability assessments use few or no indicators related to soil properties or processes (e.g., Gómez-Limón and Sanchez-Fernandez, Reference Gómez-Limón and Sanchez-Fernandez2010). According to Van Asselt et al. (Reference Van Asselt, Van Bussel, Van der Voet, Van der Heijden, Tromp, Rijgersberg, Van Evert and Van Wagenberg2014), no more than one indicator per dimension is necessary to carry out agricultural sustainability assessments. In this context, there may be a case where no indicator related to the soil is evaluated. However, Aloui et al. (Reference Alaoui, Hallama, Bär, Panagea, Bachmann, Pekrun, Fleskens, Kandeler and Hessel2022) stated that soil researchers need a tool to estimate the level of sustainability of experimental treatments through a quantitative index.
The objective of this work was to propose the Sustainability Assessment Methodology Oriented to Soil-Associated Agricultural Experiments (SMAES) that estimates the sustainability level through a quantitative index. This methodology has three essential features: (i) it can be adapted to experiments related to soil management with different spatial, temporal, and measurement characteristics; (ii) it can be used in experiments with broad or limited access to indicators; and (iii) it is quantifiable, in terms of sustainability index for the treatments under consideration.
To know the functionality of SMAES in possible scenarios, we built SMAES from hypothetical data and tested it with data from a real experiment.
Materials and Methods
Normalization, weighing, selection, and aggregation techniques with hypothetical data
The most common process to build sustainability indices includes normalization, weighting, and aggregation (Gomez-Limón and Sánchez-Fernandez, Reference Gómez-Limón and Sanchez-Fernandez2010). According to that, we evaluated different techniques for each of those processes to find the best fit with SMAES. Four normalization techniques were evaluated according to Freudenberg (Reference Freudenberg2003), as shown in Table 1.
Normalization and aggregation techniques evaluated

V´ = normalized value, v = observed value to normalize, v x = average of all observed values, S d = standard deviation, M A = more sustainable value of the data set, v min = minimum observed value, v max = maximum observed value, IS S = sustainability index for weighted sum, W k = weight associated to the indicator k, I k = standard value of indicator k, Mink (W k * I k ) = weighted and normalized minimum value for the set of indicators. Five values of the compensation parameter are considered (λ = 0.00, 0.25, 0.50, 0.75, and 1.00). Twenty randomized values (v), from 93 to 140, were used to the normalization simulations.
The techniques for allocating weights to the indicators can be divided into positive and normative: Positive or endogenous are techniques that use statistical procedures. Principal components analysis (PCA) is one of the most used. In this sense, PCA approach suggests computing the sum of the square coordinates of an indicator k in each eigenvector (λ j ) multiplied by the percentages of total variability (f j ) explained by each principal component (PC) used as a weighting factor or weighting (W k ) to rate the indicators (Rossi et al., Reference Rossi, Franc and Rousseau2009), as shown below.
 $${{\rm{W}}_k} = {\rm{\;}}\mathop \sum \limits_{j = 1}^{{\rm{PC}}} {{\rm{\lambda }}_{\rm{j}}}{\rm{\;}} \times {\rm{\;P}}{{\rm{C}}_j}$$
in which W k corresponds to each attribute. Each W k indicates the weight of the selected indicator representing the attribute. The higher the W k , the more important the contribution of the attribute.
Normative or exogenous techniques try to allocate different weights to the indicators as a function of expert knowledge, assuming sustainability as a social construction (Baush et al., Reference Baush, Bojórquez and Eakin2014; Gómez-Limón and Sanchez-Fernandez, Reference Gómez-Limón and Sanchez-Fernandez2010; OECD-JRC, 2008).
The indicator selection method developed by Monsalve and Henao (Reference Monsalve and Henao2022) was included in SMAES. In summary, this method divides the indicators according to their hierarchy (raw, baseline, and core indicators). The minimum indicators set (MIS) is defined according to the compliance of the different types of criteria (mandatory, main, alternative non-mandatory, and correlation) and the score obtained through a checklist. Indicators in the MIS represent each attribute and dimension in SMAES.
Through simulations of a range of real possible responses, three aggregation techniques were evaluated (Table 1) to determine which one has the best representation of reality. To perform the simulations, the three dimensions of sustainability (I k ) were assumed with three different possible values each, as follows: I1 = 0.00, 0.33, 1.00; I2 = I3 = 0.10, 0.33, 1.00. Each possible combination of Ik was contrasted with a weight vector (W k ), with four combinations of factors (W1, W2, W3) = {(0.33, 0.33, 0.33), (0.1, 0.1, 0.8), (0.1, 0.8, 0.1), (0.8, 0.1, 0.1)}. Each value of W k is assigned to each value of I k , building four scenarios with 27 combinations I k W k each (Table 2).
Simulations designed to find the best aggregation technique

Evaluation of SMAES with experimental results
The study was carried out in the Bio-Systems Center of the Jorge Tadeo Lozano University, located in Chía (Cundinamarca, Colombia). A randomized complete block design with five treatments and 15 experimental units (EU) – three repetitions per treatment - was established. Five treatments or mixtures of organic and chemical fertilization in different proportions were evaluated, as follow: chemical control (CR); organic control (OR); organic:chemical ratio 25%–75% (O25:C75); 50%–50% (O50:C50); 75%–25% (O75:C25). One-hundred percent organic pre-planting fertilization formula was composed of: 2600 g m−2 of chicken manure compost, 180 g m−2 of phosphoric rock, and 6 g m−2 of manganese sulfate. One-hundred percent chemical pre-planting fertilization formula was composed of: 50 g m−2 of ammonium sulfate, 65 g m−2 of diammonium phosphate, 4 g m−2 of manganese sulfate, and 0.5 g m−2 of boron.
SMAES requires the construction of one production system inventory (PSI) for each EU. With the PSI, some environmental and social indicators and all economic indicators are estimated. In the PSI, all agricultural exploitation and resource consumption data (inputs, labors, and outputs) were collected (data shown in supplementary material). Regarding the indicators management, Table 4 shows the indicators selected (core indicators) for analysis with SMAES. Characteristics of all raw indicators can be seen in Monsalve and Henao (Reference Monsalve and Henao2022). To define the core indicators, we adopted the method for selection of indicators proposed by Monsalve and Henao (Reference Monsalve and Henao2022). In summary, this method divides the indicators according to their hierarchy (raw, baseline, and core indicators). The MIS is defined according to the compliance of the different types of criteria (mandatory, main, alternative non-mandatory, and correlation) and the score obtained through a checklist. Indicators in the MIS represents each attribute and dimension in SMAES (Monsalve and Henao, Reference Monsalve and Henao2022).
Results
Evaluation of SMAES with hypothetical data: selection of normalization method
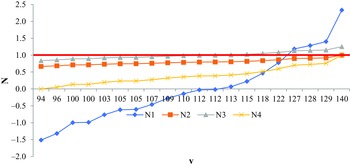
After comparing the four normalization techniques, the distance from the maximum (N2) was chosen to be used in SMAES. Standard deviation from the mean (N1) and distance from the average (N3) generate values outside the established range (0 to 1). Distance from extreme observed values (N4) assigns a value of 0 to the lowest observed value. This causes inconsistences with the aggregation technique since zero implies absolute unsustainability and should not occur even with the lowest observed values (Fig. 1).
Comparison of normalization techniques: N1 = standard deviation from the mean; N2 = distance from the maximum; N3 = distance from the average and N4 = distance from extreme observed values; v = observed values. Average = 112; standard deviation = 12; maximum = 140; minimum = 94. Horizontal red line allows visualization of those normalization techniques that generate values above one (1).

Evaluation of SMAES with hypothetical data: selection of weighing technique
Positive or endogenous techniques (e.g., PCA) are widely used showing a good fit for the plot or EU scale (Dong et al., Reference Dong, Mitchell and Colquhoun2015; Gómez-Limón and Sanchez-Fernandez, Reference Gómez-Limón and Sanchez-Fernandez2010; Rossi et al., Reference Rossi, Franc and Rousseau2009). PCA is a method that allocates weights to attributes objectively (Rossi et al., Reference Rossi, Franc and Rousseau2009), which is advantageous for the geographical evaluation scale (plot or EU) of the SMAES. At this scale, the three dimensions of sustainability depend on agricultural activities rather than government policies. Normative or exogenous technique requires surveys to obtain the opinion of experts. In this sense, the researcher should (i) define the minimum viable and reliable number (statistically) of experts to contact, (ii) design the survey, (iii) rely upon experts to respond, (iv) rely upon researchers to both carry out the survey, and (v) analyze the results. This survey technique works well for large-scale studies whose results impact a considerable population, but it can be very costly and unfeasible to carry out at the plot or experimental unit scale.
Evaluation of SMAES with hypothetical data: selection of aggregation technique
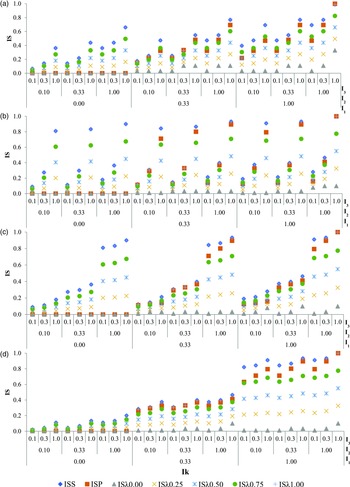
The performance of IS P and ISλ0.00 with the four possible weighting forms revealed the result is zero when at least one of the I k is 0, regardless of W k (Fig. 2). Unlike IS P and ISλ0.00, the ISS and ISλ1.00 indices (which generate the same result) tend to compensate for the effect of indicators with values close or equal to zero. It is important to define the notion of ‘compensation’. In this context, compensation is the action of masking the effect of an indicator, attribute, or dimension that is outside the optimal range with another that is within the optimal range. For instance, for W1–2–3 = (0.33, 0.33, 0.33) (Fig. 2a), when I1 = 0, IS P and ISλ0.00 = 0, while IS S and ISλ1.00 = 0.07 to 0.66. In this case, the total compensation effect between indicators is observed for IS S and ISλ1.00. There is no evidence of any combination for W k that result in zero for ISS and ISλ1.00.
Simulation of indicators (I k ) and weights. (a) W1 = W2 = W3 = 0.33, (b) W1 = 0.1, W2 = 0.1, W3 = 0.8, (c) W1 = 0.1, W2 = 0.8, W3 = 0.1, (d) W1 = 0.8, W2 = 0.1, W3 = 0.1 for the proposed sustainability indices (IS): IS S = weighted sum of indicators, IS P = product of weighted indicators, and ISλ = multicriteria function for λ = 0.00, 0.25, 0.50, 0.75, and 1.

Whenever I1 = I2 = I3 = 1, independent on any combination of W k , then IS P = 1 (Fig. 2). IS P also applies compensation between indicators, although the compensation rate between indicators is not constant. It varies depending on the value of the indicators and the weights. Thus, as any indicator increases, the same applies to its compensation capacity and vice versa. Except for IS P and ISλ0.00, all IS values increased proportionally with the increase of I k and W k . This increase is more prominent when (I1 = 0; W k = 0.1) (Fig. 2b, c). In Fig. 2d, if [I1 = 0, W k = 0.8], all IS are very low and increase as I1 rises to 0.33, and finally to 1. When analyzing the intermediate levels of compensation (ISλ0.25, ISλ0.50, and ISλ0.75), ISλ generated higher values as the degree of compensation increased.
Based on these results, the weighted indicator product technique (IS P ) provides sufficient representation of the objective and subjective process of the analysis which is best suited for SMAES. This is because the same equation represents the total, partial, and null compensation.
SMAES summary
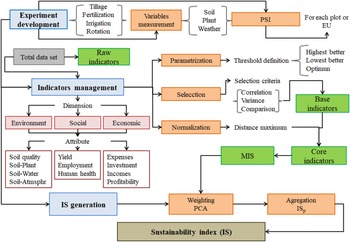
Figure 3 shows a scheme that summarizes the methodology of sustainability evaluation oriented to agricultural experiments associated with soil (SMAES) divided into three macro-processes: (1) Experiment development (tillage, fertilization, irrigation, or rotation) during which the measurement of soil, plant, and climate variables are taken, and the PSI is constructed individually for each EU or plot and (2) the entire data set (variables or raw indicators) is divided according to the dimension (environmental, social, or economic) and attribute to which it belongs. Subsequently, (i) each indicator is parameterized by defining the thresholds (whether there is an optimum or this optimum is the highest or lowest value in the dataset), (ii) a correlation, variance, and comparison analysis is performed to define the base indicators, (iii) which are normalized, and (iv) each base indicator goes through the checklist of selection criteria to define the core indicators and subsequently the MIS; (3) build the sustainability index (IS), where weights are assigned to each core indicator (weighting) by PCA. The indicators are added using the product of weighted indicators technique (IS p ) to obtain the IS value.
Synthesis of the sustainability evaluation methodology oriented to agricultural experiments associated with soil (SMAES). The blue, green, orange, gray, and brown boxes indicate macro-processes, achievements, activities, data organization, and outcome (IS), respectively. PSI = production system inventory; EU = experimental unit; MDS = minimum data set; PCA = principal component analysis; IS p = product of weighted indicators.

Evaluation of SMAES with experimental results: minimum indicators set (MIS)
As mentioned in the Materials and Methods section, indicator selection process was based on the method developed by Monsalve et al. (2022). As shown in Table 3, the minimum indicator set (MIS) was made up at the environmental dimension from the core indicators soil quality indicator using principal component analysis (SQ PCA ), with a score of 0.81; land use (LU) (0.68); potential eutrophication (PE) (0.75); and global warming potential (GWP) (0.73). For the social dimension, MIS came from the core indicators yield (Yd) (0.77); wages per year per hectare (JA) (0.77); and human toxicity (HT) (0.68). Finally, for the economic dimension, MIS was built from the core indicators variable costs (VC) (0.81); net incomes (NI) (0.81); and benefit-cost ratio (B/C) (0.82) (Table 3). From 30 raw indicators (13 environmental, 7 social, and 10 economic), 10 core indicators were chosen (4 environmental, 3 socials, and 3 economics) (Table 4).
Score obtained by the raw indicators for the mandatory

MnTr = main nonmandatory; NmMn = alternate nonmandatory; NmAt and correlation (CrLc) = selection criteria. Where StOb: related to sustainability objective; QuAt: quantifiable; SpIn: specifically interpretable; TrSt: transparent and standardized; NoRd: not redundant; SgDf: significantly different; WCS: weighting value assigned for the selection criteria; AfMs: affordable measurement; PrTz: parameterized; MsEd:measured or estimated; ObSt: related to the study objective; VrRt: variable between repetitions; AcTn: acceptance; PtDv: participatory development; PrFu: present and future balance; AgGt: aggregate; and Tt: total score.
Indicators: soil management assessment framework (SQSMAF); soil quality indicator using principal component analysis (SQPCA); land use (LU); amount of water per kilogram produced (W-kg); amount of nitrogen per kilogram produced (N-kg); fresh water toxicity (FWT); marine water toxicity (MWT); potential eutrophication (PE); potential acidification (PA); global warming potential (GWP); ozone depletion (OLD); yield (Yd); percentage of first category (PCat); wages per year per hectare (JA); work effort indicator (ELB); high and maximum work effort (ELB(4,5)); photochemical oxidants (PO); human toxicity (HT); variable costs (VC); fixed costs (FC); investment (IV); gross income (GI); net income (NI); net present value (NPV); benefit–cost ratio (B/C); opportunity rate obtained (ORO); internal rate of return (IRR); breakeven point by quantity (BPQ); and breakeven point by price (BPP).
Core indicators selected in the environmental, social, and economic dimensions

where Abb = abbreviation; Thrs = threshold, HVB = highest value is the best, and LVB = lowest value is the best.
* For all indicators estimated through life cycle assessment (LCA), all resource consumption and emissions referred to a functional unit of mass of one kg of fresh commercial tomatoes. Extraction of the raw material to the farm gate was the limit of the system, i.e., an LCA from cradle to door. It was considered a single subsystem, fertilization. The background processes included the production of fertilizers, whose data for their production came from the Ecoinvent V3.4 database (Ecoinvent Center, 2017).
** The indicators of each attribute were obtained from the PSI, based on a business model, where all the technical, administrative, and management processes followed the Colombian legal framework (CCB, 2019; DIAN, 2019). All the variable costs (plant material, fertilizers, crop protection, wages, among others) and fixed costs (leasing, public services, salaries, administration, among others) associated with the production were accounted for and included in the analysis. The analysis was carried out based on the technique of investment projects assessment (Karibskii, 2003a y Reference Karibskii, Shishorin and Yurchenko2003b), assuming that production is constant for a cropping area of one hectare in each EU (project), transforming the values of each variable, of the EU area to one ha.
Evaluation of SMAES with experimental results: weighting, comparing treatments, and estimation of IS
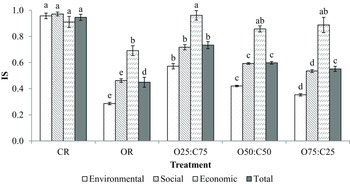
Weights (W k ) were allocated similarly for all attributes indicating that, in this case, all dimensions had a similar influence on sustainability (Table 5). CR showed the best results for the core indicators of all dimensions. On the other hand, OR had the lowest values because of its lowest income (NI) and yield (Yd). At the same time, OR needed a higher area (LU) to produce the same amount of produce as CR (Table 6). CR showed the highest economic sustainability index (Fig. 4). This is due to the relationship among Yd, VC, and NI (Table 6). The opposite occurred with OR, which reported the lowest index (Fig. 4), incurring in higher costs with lower income (Table 6). A similar outcome was seen for the environmental and social dimensions, with CR being the most sustainable treatment and OR the least one (Fig. 4). Considering the three dimensions altogether, the CR treatment showed the highest sustainability index followed by O25:C75 (Fig. 4).
Weighting indicators results through principal component analysis

PCA. PC = Principal component; Atm = Atmosphere; Food sec = Food security; Empl. Gen = Employment generation; Hum. Hlt = Human health; Weight (Wk).
Results for the evaluation of the indicators for each treatment dimension

Same letter indicates no significant differences among treatments (Tukey, p < 0.05); n = 15.
Comparison of sustainability indices (SI) between treatments. The SI for each dimension and the accumulated SI (Total). Equal letters indicate no significant differences between treatments (Tukey, p < 0.05); n = 15. Chemical control (CR); organic control (OR); organic:chemical ratio 25%–75% (O25:C75); 50%–50% (O50:C50); 75%–25% (O75:C25).

Discussion
Simulation process: indicators
SMAES integrates the three dimensions of sustainability (environmental, social, and economic) to define the best treatments evaluated in soil-associated agricultural experiments. To use SMAES, the first step is to select the indicators. The environmental indicators collected in this study consider the impact of soil management and the cropping system on the entire ecosystem, i.e., on biota, water, atmosphere, humans, and the soil itself. It is composed by four attributes: soil quality, soil–plant, soil–water, and soil–atmosphere (Monsalve et al., Reference Monsalve, Bojacá and Henao2021a). These attributes search for a sustainable environmentally management of the soil, i.e., not performing any irreparable negative effect either to the soil itself or to any other ecosystem (Tóth et al., Reference Tóth, Hermann, da Silva and Montanarella2018). A considerable number of indicators can be measured either in the field or lab; however, the number of indicators must be estimated through models, such as life cycle assessment (LCA) (Monsalve et al., Reference Monsalve, Bojacá and Henao2021a). In this sense, the PSI is critical to SMAES because most environmental and social indicators along with all economic indicators are based on the PSI (Monsalve et al., Reference Monsalve, Bojacá and Henao2021a). It is worth noting that SMAES works at the plot level, where commercial conditions are simulated, and the treatments are the only modifications to the cropping system. Experiments under fully controlled conditions may have limitations since the inventory of the production system may not be related to the commercial cropping conditions.
Many authors have pointed out the importance of establishing selection procedures with transparent and well-defined criteria that lead to relevant, comprehensive, and meaningful assessments that represent a production system (Binder et al., Reference Binder, Feola and Steinberger2010; de Olde et al., Reference De Olde, Moller, Marchand, McDowell, MacLeod, Sautier, Halloy, Barber, Benge, Bockstaller, Bokkers, De Boer, Legun, Le Quellec, Merfield, Oudshoorn, Reid, Shader, Szymanski, Sorensen, Whitehead and Manhire2016; Lebacq et al., Reference Lebacq, Baret and Stilmant2013; Marchand et al., Reference Marchand, Debruyne, Triste, Gerrard, Padel and Lauwers2014). The definition and prioritization of the criteria to make the selection of the indicators vary widely among the assessment tools. Therefore, it is necessary to describe these criteria by adding clarity and reliability to the sustainability assessments (de Olde et al., Reference De Olde, Moller, Marchand, McDowell, MacLeod, Sautier, Halloy, Barber, Benge, Bockstaller, Bokkers, De Boer, Legun, Le Quellec, Merfield, Oudshoorn, Reid, Shader, Szymanski, Sorensen, Whitehead and Manhire2016). The indicators selection procedure included in SMAES (Monsalve and Henao, Reference Monsalve and Henao2022) allows the user to choose the suitable indicators given a list of criteria grouped in hierarchical categories (raw, baseline, and core indicators). It is possible and highly recommended to use this procedure both before the experiment development and during the analysis.
Simulation process: IS selection
Munda (Reference Munda2005) suggests the use of noncompensatory multicriteria techniques (ISλ0.00) for the elaboration of sustainability indices. These techniques do not allow indicators with low values to be compensated by those with higher values validating the concept of ‘strong’ sustainability, which implies the impossibility of replacing the effect of one indicator or dimension by another. However, if quantitatively zero corresponds to unsustainable and one corresponds to the highest degree of sustainability, the results of the simulations suggest that even in ideal conditions, such as shown with the combination W1 = W2 = W3 = 0.33 with I1 = I2 = I3 = 1.0 (Fig. 2a), ISλ0.00 will never be equal to one. Conversely, in this condition, ISλ0.00 tends to be closer to zero than one (0.33 in this case), suggesting that the system is unsustainable, which is not a reflection of the input values in this scenario.
On the other hand, ISS and ISλ1.00 have a high compensation power. If an attribute or dimension obtains a zero value, it will be masked by another with a higher value. This implies, for example, that any environmental conflict can be solved with economic compensation with IS not reflecting such differences, which is the opposite of the multidimensional and integrated concept of sustainability. Hediger (Reference Hediger1999) indicates that assuming total compensation between indicators is associated with the concept of ‘weak’ sustainability, which implies the possibility of replacing the effect of one indicator by another.
Using intermediate compensation values (ISλ0.25, ISλ0.50, and ISλ0.75) adds subjectivity to the study since it is necessary to define which value is going to be defined and justify that decision adequately. Considering that the objective of this analysis was to reduce the degree of subjectivity inherent in sustainability analyses, no value is recommended for intermediate partial compensation within the multicriteria function as a single sustainability index.
The product of weighted indicators technique (IS P ) uses a compensation rate between indicators that varies depending on the value of the indicators and the weights. Thus, as the value of an attribute or dimension takes extreme values (close to 0 or 1), the same occurs with its compensation capacity. This implies that an I k that has a high W k generates a high degree of compensation. However, if I k is close to zero, indicating that it is outside the allowed threshold, all the dimensions, and therefore the treatment, would be considered unsustainable. This way, IS P represents better the potential results in real scenarios than IS S and ISλ. The aggregation process refers to attributes or dimensions since this process can be applied to both cases.
Experimental results: comparing treatments
The lower yield of OR directly influences the environmental impact, since the LCA uses a kilogram of fresh tomato as a functional unit, i.e., the more input used to produce a kilogram of tomato, the higher the environmental impact will be generated. Despite being the only treatment to which no organic fertilizers were applied, CR excels in the environmental dimension. In this regard, there is a tendency to increase the environmental impact (PE and GWP) as the amount of organic fertilizer applied (chicken manure) increases, in this order: OR > O75:C25 > O50:C50 > O25:C75 > CR. These results are consistent with those reported by Bojacá et al. (Reference Bojacá, Wyckhuys and Schrevens2014), who found that fertilization is the agricultural activity that generates the highest negative environmental impact (regardless of infrastructure) and, accordingly, chicken manure is the precursor of this result for most of the categories evaluated in their study on the environmental impact of Colombian greenhouse tomato crop. The high N content of chicken manure is associated with high levels of leaching and N emissions (Bergström and Kirchmann, Reference Bergström and Kirchmann2010; Hayakawa et al., Reference Hayakawa, Akiyama, Sudo and Yagi2009).
As for the number of wages (JA), the analysis can be done from two points of view: (1) the farmer (owner of the crop) and (2) the employee. For the farmer, a smaller number of wages is more convenient, while for the employees there is a more significant benefit while more wages require the crop. For this case study, the analysis was made from the farmer perspective, since a higher number of wages implies higher production costs, which can affect the sustainability of the system alone. Based on this, CR is the most economically sustainable treatment because it requires the fewest number of wages. This has to do with the fertilization scheme, since a smaller number of wages is required when only applying chemical fertilizers in preplanting.
The measurement timespan is too short (one production cycle) to appreciate the application of the organic amendment advantages in the soil and the ecosystem. However, it also influences the fact that chicken manure was used to replace a percentage of the amount of chemical fertilizer, i.e., it was used as a fertilizer, not as an amendment. It is noticeable that compared to chemical fertilizers, whose nutrients are immediately available to the plant, chicken manure has a limited fertilizing action.
In this study, thresholds were not associated with the selected environmental indicators, thus the definition of the level of sustainability was based on the comparison between the evaluated treatments. This simple comparison limits the analysis, especially for the environmental dimension. If hypothetically, all treatments have a negative environmental impact, statistically significant variation forces the assignment of differential sustainability levels (weights). In fact, the world legislation and policy on soil quality are poorly defined due to the diffuse definition of soil quality, which is accentuated by the difficulty inherent in the quantification and mapping of its space variability (de Paul Obade and Lal, Reference De Paul Obade and Lal2016).
Final considerations about SMAES
In SMAES, many of the variables that feed the indicators come from core research, and the indicators as measures of sustainability on an experimental scale are able to capture the sources of variation or treatments due to the homogeneity and size of the plots. This is contrary to the sustainability studies on a larger geographical scale, which require a large number of observations due to the heterogeneity of the information source (e.g., Dantsis et al., Reference Dantsis, Douma, Giourga, Loumou and Polychronaki2010). Government policies have the same influence on all EU under evaluation in SMAES as well as different computational tools allow calculating specific indicators that act as a complement of the measurements in the field (e.g., LCA), and the classic statistical evaluation is no longer a critical parameter for decision making. This serves as a selection criteria to decide which indicators will be included in the sustainability analysis.
Conclusion
This study provides a conceptualization of SMAES, an adaptable and quantifiable methodology for the evaluation of sustainability oriented to soil-associated agricultural experiments. The outputs are interpreted through a sustainability index that assembles the environmental, social, and economic information of the experiment. SMAES could become part of a decision support tool whose use would allow soil researchers to define how sustainable the evaluated treatments in their experiments are, to improve the reliability, and application feasibility of results that would be transferred to the farmers. When only a few variables are studied and the recommendation is based just on technical results, it can generate biases because it is not considering how the recommended treatment would affect each dimension of the sustainability. Thus, as in this study, if only the yield is considered as an indicator to designate the best treatment, all treatments are recommended exception made for the one with organic fertilizers and amendments applied as preplanting fertilization. However, with the use of SMAES, differences among treatments were revealed, indicating that the most sustainable treatment is the one where chemical fertilizers were not mixed with organic fertilizers. It is important to highlight that SMAES is applied to evaluate the results of the experiments without considering possible replications in time and/or space. Each experiment must be analyzed separately. In this specific study and, in accordance with the literature, it is possible that if the management of the treatments is maintained over time, in 10 or 20 years, the fertilization treatments including organo-mineral mixtures could show the highest yields. On the other hand, the chemical treatment could generate a greater negative environmental impact, which probably makes it unsustainable.
Supplementary material
The supplementary material for this article can be found at https://doi.org/10.1017/S0014479723000145
Financial support
This study is made possible by the support of the Ceiba foundation. Program activities are funded by the Colombian royalty’s general system for the state of Cundinamarca. The contents are the sole responsibility of the authors and do not necessarily reflect the views of Ceiba or the Colombian government.
Competing interests
None.