


Introduction
Ion chromatography (IC) is a convenient and reliable method widely used to analyze soluble chemical components like Na+, NH4 +, K+, Mg2+, Ca2+, F–, MSA–, Cl–, NO3 – and SO4 2– in ice cores where these ions are present at the ppb level (e.g. Reference MayewskiMayewski and others, 1997). Two of the main contributors to the Greenland ice-core ion chemistry are sea salts and ions released from mineral dust particles. the Na+ concentration is often taken as an indicator for the content of sea-salt aerosols. Non-sea-salt contributions to the contents of various ionic components in ice cores can be evaluated by subtraction of the sea-salt contribution (e.g. Reference De Angelis, Steffensen, Legrand, Clausen and HammerDe Angelis and others, 1997). the content in Greenland ice cores of soluble Ca2+ correlates well with the content of insoluble dust (Reference SteffensenSteffensen,1997), and use of the Ca2+ concentration as an indicator for the content of dust aerosols is well established (e.g. Reference Fuhrer, Wolff and JohnsenFuhrer and others, 1999). the insoluble mineral-dust aerosols are mostly aluminium silicates (e.g. Reference LajLaj and others, 1997; Reference Svensson, Biscaye and GroussetSvensson and others, 2000). Iron and aluminium are therefore better tracers for insoluble dust aerosols than Ca2+, but the number of data from analysis of these elements in ice cores is limited due to the tedious analytical technique. Contributions to ions in Greenland ice cores other than sea salt and mineral dust aerosols can be aerosols of biogenic or volcanic origin.
Very little has been reported about IC measurements of lithium in geological samples, because up to now the IC technique has been insufficient. IC methods for measuring Li+ were optimized by Reference Betti, Giovannoni, Onor and PapoffBetti and others (1991), who measured Li+ along with other cations using column switching, and by Reference Singh and AbbasSingh and Abbas (1996), who measured only monovalent alkali metals. After sample dilution they measured Li+ in concentrations down to 0.5 μeq kg–1. But since their work, IC techniques have improved markedly. Today all components of interest are easily separated in a single run, and the procedures for measurement and data evaluation have become automated to a high degree. Reference Lyons and WelchLyons andWelch (1997) measured Li+ concentrations in stream and lake samples during IC analysis of chemistry in waters from the McMurdo Dry Valleys, Antarctica. They report a detection limit of 0.01 μeq kg–1, and after sample dilution they measured Li+ concentrations down to about 0.1 μeq kg–1. In this work, we present an IC method where Li+ concentrations down to 0.0001 μeq kg–1 or 0.7 ppt can be measured, and we introduce the Li+ concentration as a new parameter in the analysis of ice cores.
Since sea salt and mineral dust aerosols are two of the main contributors to ion chemistry in Greenland ice cores, we consider the contribution of these two sources to the Li+ content in our samples. In Table 1 the abundance of lithium relative to other elements in the Earth upper crust and in sea water is listed. In sea water, the molar ratio between lithium and sodium is 0.061610–3 (Reference HollandHolland,1984), which is much lower than the ratios we have measured. We therefore assume that the origin of lithium in Greenland ice cores is mainly mineral dust aerosols. This assumption is supported by recent analysis of single-particle aerosol using aerosol time-of-flight mass spectrometry in air masses in Southern California., U.S.A. There Reference Silva, Carlin and PratherSilva and others (2000) detected lithium in soil dust particles, and Reference HughesHughes and others (2000) used lithium, along with aluminium, iron and calcium, as an indicator for mineral dust particles in the analysis of the evolution of various atmospheric particles. In the Earth’s upper crust, the lithium and calcium contents are 22 and 29 450 ppm (Reference WedepohlWedepohl,1995), corresponding to 3.1 meq kg–1 and 1.47 eq kg–1, respectively. Lithium has a very low solubility in water, but a very high mobility during chemical weathering processes, and replaces magnesium in rocks and minerals (Reference Heier, Billings and WedepoolHeier and Billings, 1970). the lithium content in minerals varies (see Table 2), and the concentration of lithium in clays and sedimentary rocks is much higher than in igneous rocks and fresh basalts. In fresh basalts, the lithium content is typically 5 ppm, whereas in some clays it can be 150 ppm (Reference HollandHolland, 1984). Lithium is unlikely to be replacing calcium in minerals, and in marine carbonates the lithium content is very low (Reference Hoefs and SywallHoefs and Sywall, 1997). Because of this variation in lithium content in minerals, the relative concentrations of Li+, Mg+ and Ca2+ measured in Greenland ice cores might be useful in the study of mineral composition of dust aerosols.
The average lithium and relative lithium abundance in the upper crust and sea water, from Reference HollandHolland (1984) and Reference WedepohlWedepohl (1995). the ratios are given in equivalents/equivalents

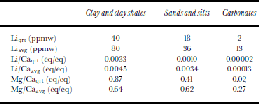
Lithium content in some Quaternary (qrt) and average ( avg) sediments in ppmw, and ratios in equivalents between lithium and calcium in some Quaternary sediments. Data are evaluated from Reference HollandHolland (1984) and Reference Hoefs and SywallHoefs and Sywall (1997)
Here we present exemplary Li+ profiles along with Ca2+ profiles from three different data series. One series represents 70 years around 400 years BP from the North Greenland Ice-core Project (NorthGRIP) Holocene ice core (personal communication from H. B. Clausen,2001) where a seasonal signal in the Li+ profile can be seen and where Li+ was measured in concentrations as low as 0.0001 μeq kg–1 or 0.7 ppt. Another series represents the Greenland Icecore Project (GRIP) ice-core Greenland Stadial 21 (GS-21) to Greenland Interstadial 20 (GIS-20) transition approximately 75 kyr BP (Reference DansgaardDansgaard and others, 1993;Reference WalkerWalker and others, 1999). the third series we have chosen to present is from the NorthGRIP ice core representing approximately 170 years around the Holocene 8.2 kyr BP cold event (personal communication from H.B. Clausen, 2001). the 8.2 kyr BP event has been described by, among others, Reference Klitgaard-Kristensen, Sejrup, Haflidason, Johnsen and SpurkKlitgaard-Kristensen and others (1998) and has been analyzed in the Greenland Ice Sheet Project 2 (GISP2) ice core by Reference Alley, Mayewski, Sowers, Stuiver, Taylor and ClarkAlley and others (1997). In the NorthGRIP ice-core series the lithium profile shows a strange and incomprehensible behaviour during this event.
Ice-Core Samples
The GRIP ice core was drilled during the 1990, 1991 and 1992 summer field seasons and reached 3028m depth very close to bedrock (Reference DansgaardDansgaard and others, 1993). the NorthGRIP 1 ice core was drilled during the 1996 and 1997 summer field seasons and terminated at 1371m depth (Reference Dahl-JensenDahl-Jensen and others, 2002).
Samples for IC analysis were decontaminated and cut into 5.0 or 2.5 cm samples manually in a clean bench using a microtome knife and then stored frozen in Coulter accuvettes. Except for a few samples from the GRIP ice core, all the samples have been decontaminated and cut in the field.
From the NorthGRIP 1 ice core, the upper 350m were sampled for a continuous record in 5 cm resolution, and below 350 m depth selected sections were sampled.
IC Method
The ions in the ice-core samples were measured using a DIONEX 500microbore ion chromatograph equipped with a two-channel set-up for simultaneous measurements of cations and anions. Each channel has a preconcentration column, gradient pump, suppressor and a conductivity detector. the samples were decanted into 5 mL sample vials and injected into the ion chromatograph by an autosampler. from each sample a 3 mL portion was injected into the cation system, and a 1.5 mL portion was injected into the anion system. the ionic components were separated within 20 min for both cations and anions.
The cations were separated on Ionpac CS12 2 mm columns using a gradient mixture of 20 meq kg–1 methanesulphonic acid (MSA) and 18 MΩ water as eluent with a flow rate of 0.5 mL min–1. the initial eluent concentration was 9 meq kg–1 MSA with a gradient increase up to 16 meq kg–1 between 2 and 12 min. Between 12 and 16 min the eluent concentration was constant at 16 meq kg–1 and then changed back to 9 meq kg–1 for the baseline to relax.
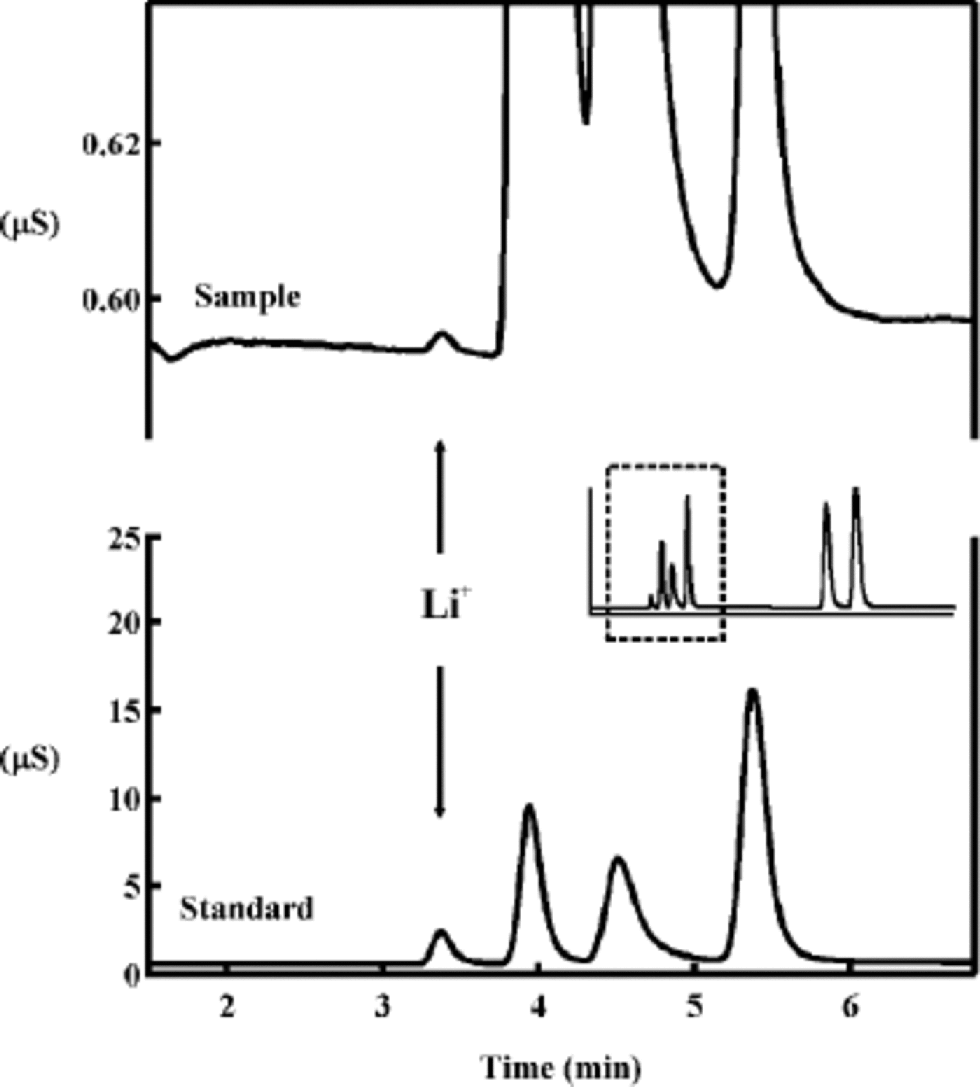
The application of a preconcentration column decreases markedly the effect of the water dip in the beginning of the chromatograms, and therefore a large sample volume can be injected. Since lithium is present in ice-core samples in very low concentrations, a large sample volume is essential for the detection of lithium. the decreased effect of the water dip is also an advantage because Li+ is the first component in the cation chromatograms. With a low initial eluent concentration the lithium peak is distant from the water dip, and a good separation of the first four components Li+, Na+, NH4 +, K+ is achieved. A high eluent flow rate ensures a low detection limit since the component peaks are easier to distinguish from baseline noise. Important for a low detection limit is a high chemical purity of the eluent and an optimally working pump and suppressor. the gradient in the eluent concentration is applied for the components Mg2+ and Ca2+ to be measured along with the monovalent cations within 20 min. the chromatograms were integrated using Peaknet 4.30 software, and the peak heights were used in the data evaluation except when the peak area seemed to be more reproducible. In Figure 1 the detector responses of the first four components in the cation chromatograms are shown for a standard solution and for a sample solution. the Li+ concentration in the standard solution is 0.2 μeq kg–1, and the Li+ concentration in the sample was evaluated to 0.00025 μeq kg–1.
The detector response vs time for the first four components in the cation chromatograms is shown for a sample solution and for a standard solution. the cations measured are Li+, Na+, NH4 +, K+, Mg2+ and Ca2+.The Li+ concentration in the standard was 0.2 μeq kg–1.The sample concentration of Li+ was evaluated to 0.0003±0.0001 μeq kg–1.
Reproducibility and linearity of the Li+ response was tested on solutions with Li+ concentrations of 0.2, 0.02, 0.002 and 0.0002 μeq kg–1.The tests showed no significant deviation from linearity of the Li+ response for concentrations down to 0.002 μeq kg–1. for 0.0002 μeq kg–1 Li+ the tests showed a positive deviation from linearity of <+20%. Thismeans that, using a linear calibration curve, Li+ concentrations evaluated to around 0.0002 μeqkg–1 are overestimated by <20%. the standard deviation for repeated measurements of solutions with Li+ concentrations of 0.2, 0.02, 0.002 and 0.0002 μeq kg–1 was <5%, <5%, 10% and 10–15%, respectively. After standard solutions of 0.2 μeqkg–1 Li+ and 4.1 μeq kg–1 Ca2+ two blank solutions were measured. In the first blanks an average of 0.0001 μeq kg–1 Li+ was measured with a reproducibility of 17%, corresponding to a carry-over of 0.07% of the previous standard solution. No Li+ was detected in second blanks. for Ca2+ there was a carry-over of 4% in the first blanks.
During routine IC measurements of samples from various ice cores, the Li+ content was evaluated and recorded. the detection limits for components in the chromatograms depend on how well the system was running. for an optimally working system, the detection limits, taken as three times the height of baseline noise, were 0.0001 μeq kg–1 for Li+ and 0.0002 μeq kg–1 for Ca2+. In practice, calcium has a much higher detection limit of 0.05 μeq kg–1, which is determined by blank concentrations. During automatic data evaluation, the detection limit is controlled by parameters in the integration software, and it was possible to detect Li+ peaks smaller than corresponding to 0.0001 μeq kg–1 in chromatograms of high quality. This means that Li+ concentrations as low as 0.0001 μeq kg–1 or 0.7 ppt were evaluated. During routine IC measurements the limit for automatic detection of Li+ could vary between 0.0001 and 0.0003 μeq kg–1 depending on the quality of the chromatograms.
For quantification of ion concentrations, a single standard solution was used. Deviations from linearity in the detector response of very low Li+ concentrations have not been taken into account in the data evaluations. Therefore Li+ concentrations around 0.002 μeq kg–1 have an error of 10% from reproducibility, while Li+ concentrations around 0.0002 μeq kg–1 have a total error of 30–35% from reproducibility and deviations from linearity.
Contamination of samples occasionally occurs during manual sampling and shows up as spikes in the data profiles. A typical source of contamination is fingerprints, so spikes in the sodium, potassium and chloride profiles are good indicators of sample contamination. During the manual sampling of NorthGRIP samples, 4.4% of the samples were marked as possibly contaminated. the marked samples have 91%,76% and 33% higher average concentrations of sodium, potassium and chloride, respectively. for lithium the average concentration in the marked samples is 30% higher than in unmarked samples. This shows that a few samples have been contaminated with lithium during the manual sampling. We believe that contamination during manual sampling would have affected several of the measured components and that samples contaminated with lithium are also contaminated with other components. We therefore assume that sample data that look like normal data with respect to components other than lithium represent real ice-core data with respect to lithium.
Presentation of Data
Here we will show the Li+ profiles along with the Ca2+ profiles for selected data series in order to characterize the pattern of Li+ concentrations in ice cores. the complete datasets involving all the ionic components measured will be presented and discussed elsewhere.
Holocene seasonals
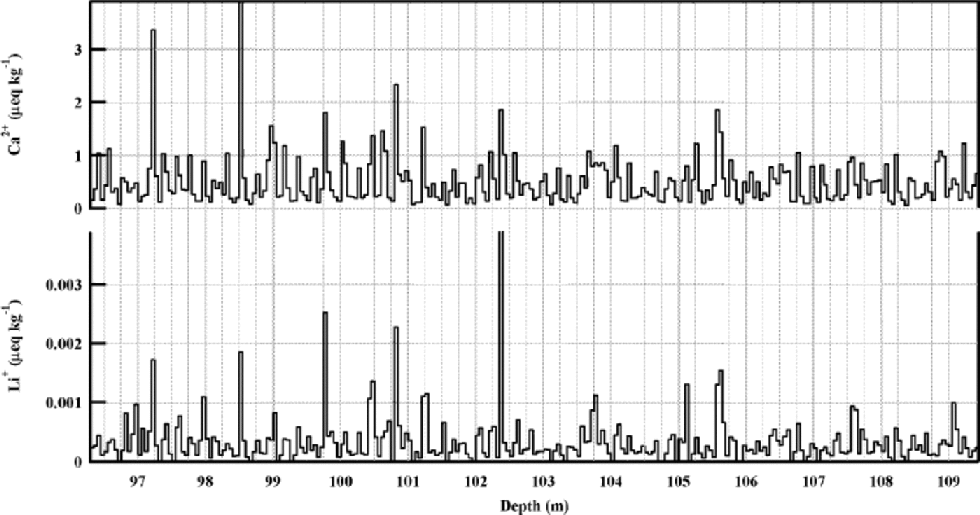
From the upper 350 m IC-data profile of the NorthGRIP ice core, Li+ was measured in sample sections corresponding to approximately 250 m.We selected a section from 96–109m depth for this presentation. the Ca2+ and Li+ profiles from the series are shown in Figure 2.This section corresponds to a time-span of approximately 70 years starting from approximately 400 years BP at 96 m (personal communication from H. B. Clausen, 2001). With the 5 cm sample resolution, seasonal variations of ionic components can be recognized in the whole 350 m data series, and the Li+ data show seasonal variations in line with Na+ and Ca2+. But the resolution of the data series is not good enough to show any details in the seasonal pattern. the average values of all the ionic components from the 96–109m section are typical for the whole 350 m series. the measured Li+ concentrations in this series are in the range 0.0001–0.004 μeq kg–1, with an average of 0.0003 ±0.0001 μeq kg–1. the ratio between the average concentrations of Li+ and Ca2+ is 0.0007±0.0002. This is comparable to ratios of lithium and calcium contents in various minerals (see Table 2).
NorthGRIP Holocene seasonals. Ca2+and Li+profiles in 5 cm resolution from a typical Holocene section of the NorthGRIP ice core. the section represents approximately 70 years around 400 years BP.
A glacial Stadial/Interstadial transition
From the GRIP ice core a 5m section at 2582.25–2587.2m depth was analyzed. This section represents the transition from GS-21 to GIS-20 approximately 75 kyr BP (Reference DansgaardDansgaard and others, 1993;Reference WalkerWalker and others, 1999). the Ca2+ and Li+ profiles are shown in Figure 3. the data show that the Li+ concentration is higher in the cold GS-21climate period than in the warmer GIS-20.This response to a change in climate is a familiar pattern seen for most ionic components measured in ice cores (e.g. Reference MayewskiMayewski and others, 1997). Although the Li+ profile looks noisy during the Interstadial the other data from this series show no sign of contamination.
Ca2+and Li+profiles from the GRIP ice core showing the GS-21 to GIS-20 transition approximately 75 kyr BP.

The average Li+ concentrations and ratios between average concentrations of cations for the three climatic periods represented by the Holocene and the glacial transition data series are listed in Table 3. to compare the values of the different climatic periods, the errors are estimated on the basis of data reproducibility. In Table 3 the ratio between Li+ and Ca2+ varies with the highest value for the Holocene series and the lowest value for the GS-21 series, whereas the ratio between nssMg2+ (non-sea-salt Mg2+) and Ca2+ seems to be constant for the three climate series. the ratio between Li+ and Na+ also seems to be constant.
Average values of δ18O, average concentrations in μeq kg–1of Ca2+and Li+and ratios between average concentrations of various cations evaluated for three different climate series: a Holocene section of the NorthGRIP ice core, and two sections from the GRIP ice core representing the GIS-20 and the GS-21 climate series

Holocene 8.2 kyr BP cold event
Another NorthGRIP data profile to be presented here is from a 16.5m series from 1221–1237.5m depth. the series represents approximately 170 years during the Holocene 8.2 kyr BP cold event (personal communication from H. B. Clausen, 2001). This series is particularly interesting with respect to the Li+ signal because the lithium content increases more than one order of magnitude, and the lithium signal does not seem to correlate with any other of the ionic components measured.
In Figure 4 the δ18O profile from NorthGRIP (personal communication from S. J. Johnson, 2001) is shown together with the Ca2+ and Li+ profiles of this series. In the δ18O profile the 8.2 kyr BP event begins at approximately 1234.5m depth and ends at approximately 1219.5 m. Ca2+ concentrations increase slowly with time at the beginning of this depth interval and seem to decrease again later during the event. Li+ concentrations start to increase with time more suddenly at approximately 1232m depth, which is later than the beginning of the event in the δ18O profile. the Li+ profile continues to increase through the whole data series and reaches values at the end that are almost two orders of magnitude higher than the values from the deepest part of the core section. This pattern of the Li+ profile is not correlated to any other of the measured ionic components. Unfortunately, our Ca2+ and Li+ profiles do not cover the complete cold event, so we do not know how the data profiles of Li+ and Ca2+ will respond to the end of the event at approximately 1219.5 m.We have removed data from a few samples that were marked for possible contamination. These samples had higher values of both Li+ and K+, which is a good indicator for contamination. the rest of the data from this series show no sign of contamination, and the measured Li+ profile appears to be a real ice-core signal. Samples were measured in random order, which excludes the possibility that the Li+ profile could be a systematic artefact from the measurements.
δ18O, Ca2+and Li+profiles from the NorthGRIP ice core showing the Holocene 8.2 kyr BP cold event. the Ca2+ and Li+sections represent approximately 170 years. In the deeper part of these sections the Ca2+and Li+concentrations are similar to typical Holocene values.

Four-metre averages of concentrations, and ratios between average concentrations from this data series are listed in Table 4.The last column in the table shows values from the deepest part of the section. In the δ18O profile this part represents the climate just prior to the cold event, and the evaluated data from this part of the core have values typical of data from the NorthGRIP Holocene section at 9–350m depth. During the series, the 4 maverage value of δ18O decreases about 1‰, and Ca2+ increases about 40%. Reference Alley, Mayewski, Sowers, Stuiver, Taylor and ClarkAlley and others (1997) report a decrease in δ18O of 2‰ and an increase in Ca2+ of 60% during the 8.2 kyr BPevent in the GISP2 ice core.
Average values of δ18O, average concentrations in μeq kg–1of Ca2+and Li+and ratios between average concentrations of various cations evaluated for 4 m sections from the NorthGRIP ice-core Holocene 8.2 kyr BP cold event series

Discussion
Holocene seasonals and glacial transition
In the data series from the NorthGRIP Holocene seasonal
series and the GRIP GS-21/GIS-20 transition series we see that the Li+ profiles show the same pattern as Na+ and/or Ca2+. We would expect this if the sources for Li+ are sea salt and mineral dust. the ratios between the average measured values of Li+ and Na+ range between 0.0010±0.0003 and 0.0013±0.0004, which is 20 times higher than the Li/Na ratio of 0.06610–3 in sea water. This means that sea salt can only contribute 5% of the Li+ measured, as long as no significant ion fractionation occurs in sea-salt aerosols. Such a fractionation has not been observed in Greenland ice cores for other sea-salt components. We therefore suggest that the Li+ measured in the Holocene seasonal series and the GS-21/GIS-20 transition series is mainly a dust-derived component.
If Li+ originates from a mixture of different mineral types we expect to see varying ratios between Li+, nssMg2+ and Ca2+ concentrations as the composition of mineral types in the samples varies. In both series, the Li/Ca ratio of individual samples varies and has a lower limit of 0.0002. This lower limit of the Li/Ca ratio fits well to the content of lithium in average marine carbonates (see Table 2). This supports the assumption that lithium in the Greenland ice cores is of terrestrial origin and has a potential application in the analysis of dust aerosols in Greenland ice cores.
Studies of insoluble dust particles in the GRIP ice core suggest that these particles originate in eastern and central China (e.g. Reference Svensson, Biscaye and GroussetSvensson and others, 2000), but the source of soluble calcium to the central Greenland ice cores and the relation to the insoluble dust are not completely understood. There is a difference in the calcium/dust ratio in different climatic periods (Reference SteffensenSteffensen, 1997). There is also a difference in the ratios between dust-derived ionic components in different climatic periods (Reference De Angelis, Steffensen, Legrand, Clausen and HammerDe Angelis and others, 1997). Reference LajLaj and others (1997) measured the insoluble part of the aerosols on filtered samples and the total content of elements in evaporated samples using microprobe techniques. They found that fractions of soluble K, Ca, S and Fe are different in different climatic periods and that the correlation between soluble and insoluble contents of these four elements is very poor. Reference De Angelis, Steffensen, Legrand, Clausen and HammerDe Angelis and others (1997) and Reference LajLaj and others (1997) suggest that a change in source contribution to mineral dust aerosols in Greenland ice cores occurs during climate changes.
Holocene 8.2 kyr BP cold event
The data from the NorthGRIP 8.2 kyr BP Holocene cold event show an increase in the Li+ concentration of more than one order of magnitude. the Li+ change seen in the series is not correlated to any other of the measured ions. the Li+ profile from 9–350m in the NorthGRIP ice core bears no resemblance to the 8.2 kyr BP series. Therefore the data from the 8.2 kyr BP event represent a special event with respect to lithium. We cannot say if the Li+ change seen in the 8.2 kyr BP data series is directly related to the cold event. the time delay of the increase of Li+ concentrations relative to the decrease in δ18O, and the missing decrease later during the cold period suggest that the pattern of Li+ concentrations seen in the series is not directly linked to the temperature drop. However, since the 8.2 kyr BP event is a special climate event, the increase in Li+ could be indirectly related to some climate changes taking place during the event.
Some clay minerals have relative lithium and calcium contents that correspond to the high ratio of the measured concentrations of Li+ and Ca2+ in the 8.2 kyr BP series. But it is unlikely that such a high increase in the measured Li+ concentration, and no significant change in other dust-derived components, is only an effect of a change in mineral composition due to changes in source contribution. We therefore need to find an additional source of Li+ in this series, but we have no candidate for such a source. to understand the lithium chemistry of the 8.2 kyr BP series, additional IC measurements to extend the data series would be helpful in order to clarify whether the concentration of soluble lithium increases further and for how long the lithium event lasts. Analysis of the insoluble fraction of components and of the mineralogy in this ice-core series would also be valuable in showing whether a change in mineral composition or a change in the soluble fraction of lithium has caused the increased Li+ concentrations and what kind of changes in climate could explain such a change in lithium. Since the isotopic composition of lithium varies in material of different geological origin (e.g. Reference Hoefs and SywallHoefs and Sywall, 1997), an analysis of the isotopic composition of lithium in this ice-core series might indicate whether the lithium is of volcanic origin or whether it comes from secondary minerals.
Conclusion
The main result of this work is the introduction of the Li+ ion in ice-core analysis. We have shown that it is possible to measure a reliable lithium signal from ice cores in concentrations down to 0.0001 μeqkg–1 using IC with a reproducibility of 15% for concentrations close to the detection limit.
The data profiles of Li+ from a NorthGRIP Holocene seasonal series and from the GRIP GS-21/GIS-20 transition series demonstrate that Li+ data from ice cores have a potential application in the analysis and interpretation of ice-core dust chemistry. Future analysis of the ice-core chemistry of lithium may provide a better insight into the chemistry of the dust-derived ionic components and the relation between soluble calcium and dust in ice cores. the Li+/Ca2+ relation can contribute to a characterization of calcium sources and to an analysis of potential solubility effects on mineral dust particles. the Li+ component might also give some new information about ice-core chemistry, as suggested by the independent behaviour of the Li+ component to other species during the 8.2 kyr BP Holocene cold event.
The NorthGRIP 8.2 kyr cold-event series represents a special lithium event where the source of lithium to the ice-core samples is unknown. Further IC measurements, along with analysis of the insoluble fraction and isotopic composition of lithium in this series, would provide information about the origin of the Li+ measured in this series.
Acknowledgements
The GRIP project is organized by the European Science Foundation with eight nations (Belgium, Denmark, France, Germany, Iceland, Italy, Switzerland and the United Kingdom), and the European Economic Community. the NorthGRIP project is directed and organized by the Department of Geophysics at the Niels Bohr Institute for Astronomy, Physics and Geophysics, University of Copenhagen. It is supported by funding agencies in Denmark, Belgium, France, Germany, Iceland, Japan, Sweden, Switzerland and the United States of America. We thank GRIP and NorthGRIP participants and supporters for their cooperative effort. We also thank reviewers for useful comments.



