Introduction
Documenting the inter-annual variability of major components of the cryosphere such as sea-ice and snow-cover extent is important for a number of reasons, such as validation of GCM climate simulations, climate-change detection, and greater understanding of climate cryosphere interactions. A number of recent papers have highlighted the importance of the spring period in cryosphere climate interactions. Groisnian and others (1994) demonstrated a prominent positive feedback between snow cover and the radiative balance over Northern Hemisphere NH hind areas during the spring period. On the basis of this relationship, they hypothesized that the enhanced spring warming observed over the NH during the 20 th century by Reference Jones and BriffaJones and Briffa (1992) was likely to have been significantly enhanced by corresponding changes in snow-cover extent. Consistent satellite-derived, hemispheric-scale observations of snow-covered area (SCA) are only available from the early 1970s. However, principal component PC analysis of these data (Reference BrownBrown, 1995; Reference Frei and RobinsonFrei and Robinson, 1995) has revealed that seasonal variability in snow cover is controlled by a relatively small number of key response regions. For example, Reference FosterFoster (1986) was able to explain 77% of the variability in Eurasian winter snow-covered area for the 1973–85 period from station data in the Turan Lowlauds. Assuming that spatial variability in snow cover has remained relatively constant this century, it should lie possible to reconstruct historical variation in continental-scale snow-covered area from station-derived time-series of snow-cover variations in key response regions.
The objective of this paper was to determine whether it was in fact possible to reconstruct 20th-century variations in spring snow-cover extent using currently available historical snow-cover data from southern Canada, the United States, the former Soviet Union and China, and to investigate the hypothesized reduction in NH spring SCA by Reference Groisman, Karl and KnightGroisman and others (1994).
Snow-Cover Data
Station data
Former Sovier Union
The Former Soviet Union (FSU) is by far the most important land area in Eurasia. It was originally intended to use the “Historical Soviet Daily Snow Depth” dataset for the 1881–1985 period, recently released by the National Snow and Ice Data Center (NSIDC). Unfortunately, while this dataset has extensive snow-depth information during the main snow-cover season, the data are characterized by high frequencies of missing data at the start and end of each snow-cover year, which place constraints on their use for assessing inter-annual variability in snow-cover duration.
The next Option was to reconstruct snow cover using daily climalological data. This approach was applied successfully in the Great Plains (Reference Hughes and RobinsonHughes and Robinson, 1993) and Canada (Reference Brown and GoodisonBrown and Goodison, 1996) for filling and extending the observed snow-cover record. For example, Reference Brown and GoodisonBrown and Goodison (1996) found that a locally calibrated melt-index method was able to explain more than 70% of the variability in annual snow-cover duration over most of Canada. Unfortunately, this particular approach could not be applied to the FSU because the observed snow-cover data were too incomplete for calibration purposes. In view of this, it was decided to estimate snow-cover duration over the FSU using an uncalibrated melt-index method.
The technique selected was a simple water-balance approach used for Canadian climate stations by Reference Johnstone and LouieJohnstone and Louie (1983). This method was found to give consistently good performance at reconstructing inter-annual variability in snow cover over a range of snow-cover climate regimes (Reference BrownBrown, 1996). In the method, daily snow depth was estimated from accumulated snowfall less any melt that had occurred. Melt was assumed to occur when the mean daily air temperature exceeded 0°C, and daily melt (mm d −1 w.e.) was estimated following the U.S. Army Corps of Engineers (1956) from:

where RAIN is daily rainfall (mm), and TEMP is the mean daily air temperature in °C. Rainfall and snowfall were partitioned using a mean daily temperature threshold of 0°C. Snow on the ground was assumed to have a fixed mean density of 300 kg m −3. This Value was selected as it gave the closest agreement between observed and reconstructed daily snow depths at a number of sites across Canada. Monthly snow-cover duration totals were then obtained by summing the number of days in a month when daily snow depth was greater than zero. From past experience, uncalibrated climatological snow-cover reconstruction methods are known to produce significant local biases in estimated mean snow-cover duration. However, these are eliminated when estimated snow-cover duration values are converted to standardized anomalies during data analysis. The estimation method should therefore produce an internally consistent index of snow-cover variability at a particular site.
The climate data used for estimating snow-cover variability were the “Daily Temperature and Precipitation Data for 223 USSR Stations” dataset described by Reference Razuvaev, Apasova and MartuganovRazuvaev and others (1993) and distributed by the Carbon Dioxide Information Analysis Center (ORNL/CDIAC NDP-40). The data cover the period 1881–1989) although there are relatively few stations with data after 1985. The data have been subject to quality control both in the FSU and by CDIAC, but no attempt was made to homogenize them. Reference Groisman, Koknaeva, Belokrylova and KarlGroisman and others (1991) documented two important systematic changes to precipitation measurements in the FSU: first, a change to Tretyakov-shielded gauges in the 1948–53 period, which is estimated to have increased precipitation catch from 5-40%; second, the application of a welting-loss correction in 1966–67 which is estimated to also have produced a 5-10% increase in recorded precipitation. Reconstructed snow cover should be relatively insensitive to changes in precipitation observing practices for two reasons: first, after the onset of melt, snow melts very rapidly due to a number of positive feedbacks (Reference Cohen and RindCohen and Rind, 1991); second, the reconstruction method used a zero snow-depth threshold for defining snow (over, which means it is relatively insensitive to variations in snow depth.
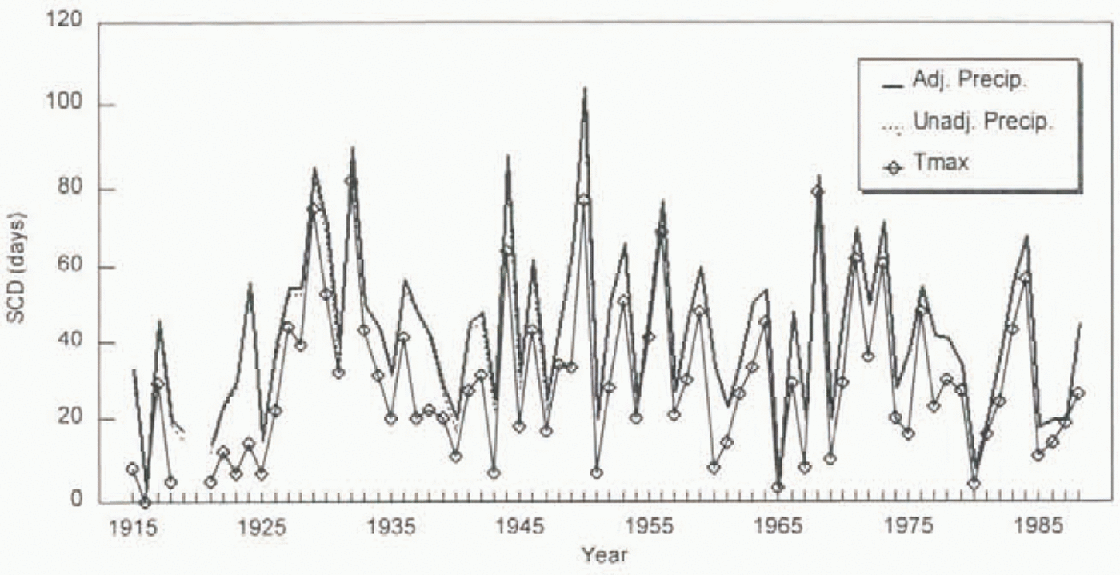
To check the validity of this assumption, the effect of precipitation undercatch in pre-Tretyakov years was taken into account by applying a constant 40% increase to solid precipitation. Wetting loss was taken into account by applying a constant 5% wetting-loss factor prior to 1936 (one precipitation reading per day), and a 10% wetting loss from 1936 to 1965 (two readings per day). These correction factors are at the upper end of the representative correction factors provided by Reference Groisman, Koknaeva, Belokrylova and KarlGroisman and others (1991). The above corrections were applied to two stations with long periods of non-missing data in two different climate regimes: Tashkent (41.3° N, 69.3° E) and Kandalaska (67.1 °N, 32.4 °E) with reconstructed mean annual snow-cover duration of 45 and 182 days, respectively. The effect of the precipitation correction on annual snow cover was small (Figs 1 and 2) with annual differences in snow-cover duration of ≤5 days. There was thus no compelling evidence that ignoring precipitation correction would affect trends in snow cover.
Comparison of reconstructed snow-cover duration at Tashkent (41.27° N, 69.27°E) with and without adjusted precipitation and with daily maximum air temperature in place of daily mean air temperature.
Comparison of reconstructed snow-cover duration at Kandalaska (67.13° N, 32.43° E) with and without adjusted precipitation and with daily minimum an temperature in place of daily mean air temperature.
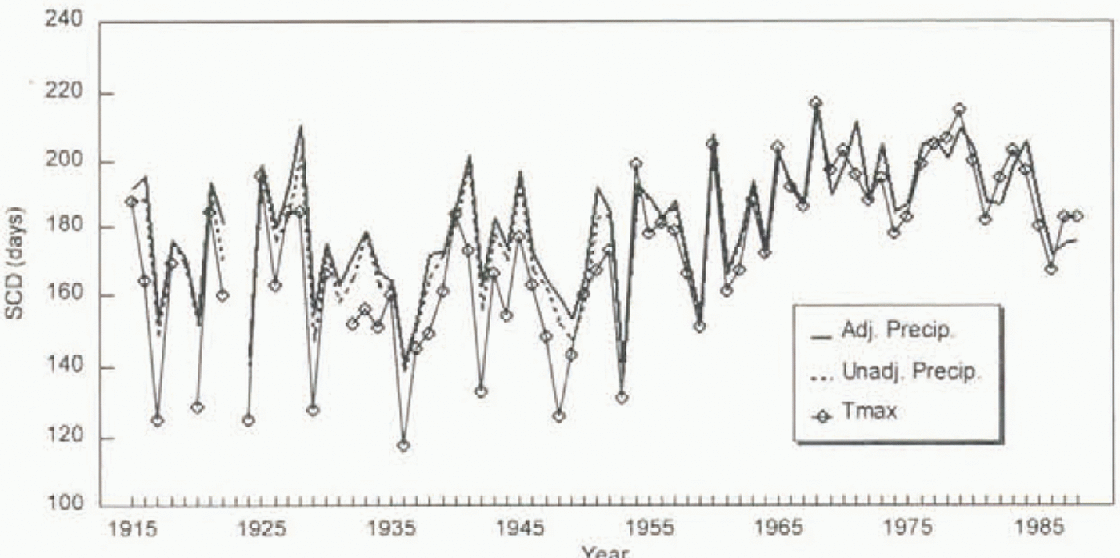
A more significant source of error may come from changes in the way mean daily temperature was calculated. Prior to 1936, daily mean temperature was computed from three observations taken at 0700, 1300 and 2100h Local Mean Time (LMT). According to Reference Razuvaev, Apasova and MartuganovRazuvaev and others (1993), the lack of a night-time observation meant that mean temperatures were most likely overestimated during this early period. Analysis of the statistic T mean − [T max + T min]/2 (personal communication from P. Y. Groisman, 1996) for the 10 year periods either side of 1936 revealed the presence of a spatially and seasonally varying warm bias, which ranged from 0.25°C in January, to 0.52°C in June. After 1936, the daily mean was computed from four observations taken at 0100, 0700, 1300 and 1900 h LMT, which according to Reference Razuvaev, Apasova and MartuganovRazuvaev and others (1993), reduced the warm bias in daily mean temperatures to ~0.2°C. After 1966, temperature readings were made every three hours, which eliminated this bias. In light of this problem, it would have been preferable to reconstruct snow cover using daily maximum temperatures. Unfortunately, maximum-temperature data were frequently missing. In order to assess the potential impact of systematic errors in mean daily temperature, snow-cover duration was reconstructed with daily maximum temperature in an uncalibrated melt-index method following Reference BrownBrown and Goodison (1996) for the above-noted two stations. The results (Figs 1 and 2) showed no evidence of any major discontinuity in reconstructed snow cover around 1936, so the uncorrected mean daily-temperature data were used to reconstruct snow cover. Only stations with at least 70 years valid snow-cover data from 1915 were included in the analvsis to maintain a fixed-station network for subse-quent analysis. A total of 72 stations was included in the analysis (see Fig. 3 for locations).
Location of stations used in the PC analysis of Eurasian spring snow cover.

People's Republic of China
Long-term records of monthly snow-cover data at (50 stations across the People's Republic of China (PRC) were obtained from Reference Shinyan, Congbin, Zhaomei and QingyunShinyan and others (1991) (CDIAC, NDP-39). The criteria applied by Reference Shinyan, Congbin, Zhaomei and QingyunShinyan and others (1991) for selecting these stations were: (1) the station was representative of a particular climate region of China, (2) the station's data were of relatively high quality, (3) the period of record of the station was reasonably long and (4) the resulting station network had a relatively uniform spatial distribution. According to Reference Shinyan, Congbin, Zhaomei and QingyunShinyan and others (1991), monthly snow cover was defined as the number of days in the month with measurable snow cover. However, no information was provided on the snow-observing program, or what depth threshold defined “measurable” snow. The PRC data all suffered from major data losses in the 1930s and 1940s, which meant that the inclusion criteria had to be relaxed to 50 years in the post-1915 period. In spite of this relaxation, only six stations had sufficient snow-cover data to be included in the analysis, which meant that China was poorly represented in the station data (see Fig. 3 for locations).
Canada
In Canada, daily snow-depth observations are only available in digital formal from 1955 onward. Reference Brown and GoodisonBrown and Goodison (1996) were able to extend the snow-cover record back to 1915 using a locally calibrated mass balance method with daily snowfall and maximum temperature as input. The method was able to account for more than 70% of the variance in annual snow-cover variability over much of southern Canada. For this study, only stations hav ing at least 70 years reconstructed snow cover since 1915 were included in the analysis. This yielded a total of 53 stations for analysis (see Fig. 4 for locations).
Location of stations/gridpoints used in the PC analysis of NA spring snow cover.

United States
For the United States, the Great Plains historical snow-cover dataset of Reference Hughes and RobinsonHughes and Robinson (1993) was used. This was derived from observed (82%) and reconstructed (18%) daily snow-depth data at 230 stations across the continental interior of North America, and has data extending back to 1910 at many stations. These data have been subjected to rigorous quality control (Reference Robinson, Dewey and HeimRobinson, 1993), and were obtained as gridded seasonal totals of the number of clays with snow depth ≥ 1 in over a one degree latitude longitude grid covering the area 37–49°N and 90–110°W. A random sample of 50 points was taken from the gridded data to avoid biasing the spatial analysis of North American snow-cover data to the Great Plains region (see Fig. 4 for locations). Quality-controlled snow-cover data were not available for other regions of the United Slates. However, it has been shown (Reference Frei and RobinsonFrei and Robinson, 1995; Reference Brown and GoodisonBrown and Goodison, 1996) that the continental interior of North America is a dominant “centre of action” in continental-scale variations in snow cover.
Satellite data
The NOAA satellite snow-cover dataset used in this study is described in Reference Robinson, Dewey and HeimRobinson and others (1993). The data consisted of digitized weekly charts of snow cover derived from visual interpretation of visible satellite imagery by trained meteorologists. The charts are digitized on an 89 × 89 polar stereographic grid for the NH, with cell resolution ranging from 16 000 km2 to 42000 km2 (Reference Robinson, Dewey and HeimRobinson and others, 1993). The data are binary in format with cells interpreted to be at least 50% snow covered represented by a “1”. The data were obtained from D. Robinson (personal communication, 1996) and contain the corrections recommended by Reference Robinson, Keimig and DeweyRobinson and others (1991). In addition, the Rutgers weighting scheme (Reference RobinsonRobinson, 1993) was used to partition correctly weekly charts into appropriate months for computing seasonal snow-cover duration. Linear interpolation was used to account for a missing chart in week 51 of 1972. Reference RobinsonRobinson (1991) found that station- and NOAA-derived estimates of snow cover agree closely on a seasonal time-scale given a good network of .stations in non-forested, non-mountainous terrain.
Methodology
The first step in the reconst ruction process was to determine an appropriate seasonal definition for “spring”. Reference Karl, Groisman, Knight and HeimKarl and others (1993) defined spring as April and May based on a subjective assessment of NOAA snow-cover data over North America for the 1972–91 period. A more quantitative way to define changes in snow-cover seasons is to look at seasonal variations in “active areas”, i.e. those regions where snow cover exhibits considerable inter-annual variability. Analysis of monthly variation in NH active areas (personal communication from A. Reference Frei and RobinsonFrei, 1996) revealed two distinct times of the year when the active area peaked: a prominent peak in Octoher and November, and a less prominent peak centred on April. These peaks represent the major transition periods in snow-covered area, and for the purpose of this study, it was decided to use a three-month window centred on April to define “spring”. The use of the larger three-month window was considered appropriate to accommo-date possible shifts in spring snow-cover climate. In this study, a snow year was defined to extend from September to August, and each season in the snow year was assigned the starting year (e.g. March, April and May of 1995 belong to the 1994 snow year).
The next step in the reconstruction was to identify the key regional centres of action that controlled inter-annual variability in NH spring snow cover. In order to do this, a rotated PC analysis was performed on the satellite-derived spring snow-cover duration data over the NH. In this study, an “S-mode” analysis was performed where the matrix columns were the gridpoints, and the matrix rows were the spring snow-cover duration values for each year from 1973/74 to 1994/95. In “S-mode” analysis, a plot of the PC loadings provides information on the spatial structure of the field (i.e. areas of coherent changes in spring snow cover), while a plot of the PC scores provides information on the temporal variability of spring snow cover within the defined coherent regions. A covariance matrix was used to weight individual points according to their contribution to the total variance (a correlation matrix applies equal weight to all points). An orthogonal Varimax rotation was applied to the identified PCs to avoid many of the problems of tin rotated PCls discussed by Reference RichmanRichman 1986). In order to reduce computational time, the PC analysis was only performed at gridpoints displaying considerable inter-annual variability in seasonal snow cover. A criterion was applied, follwing Reference Frei and RobinsonFrei and Robinson (1995), which restricted the analysis to gridpoints that had a snow cover in at least one-third of the years studied. The PC analysis was carried out following Reference BrownBrown (1995), and PCs explaining ≥ 5% of the total variance were retained for analysis.
Following the identification of spatially important snow-cover regions from the satellite data, corresponding station-derived snow-cover anomaly series were derived by converting reconstructed snow-cover data to standardized anomalies with respect to a 1961–80 reference period, then averaging individual station anomalies to produce a regional time series. To check the representativeness of the station-derived regional averages, corresponding regional series were also derived from satellite snow-cover data. These regional series were then input to a stepwise multiple regression analysis with satellite-derived snow-covered area, to develop optimum regional weightings for reconstructing past variation in spring snow-covered area.
Results
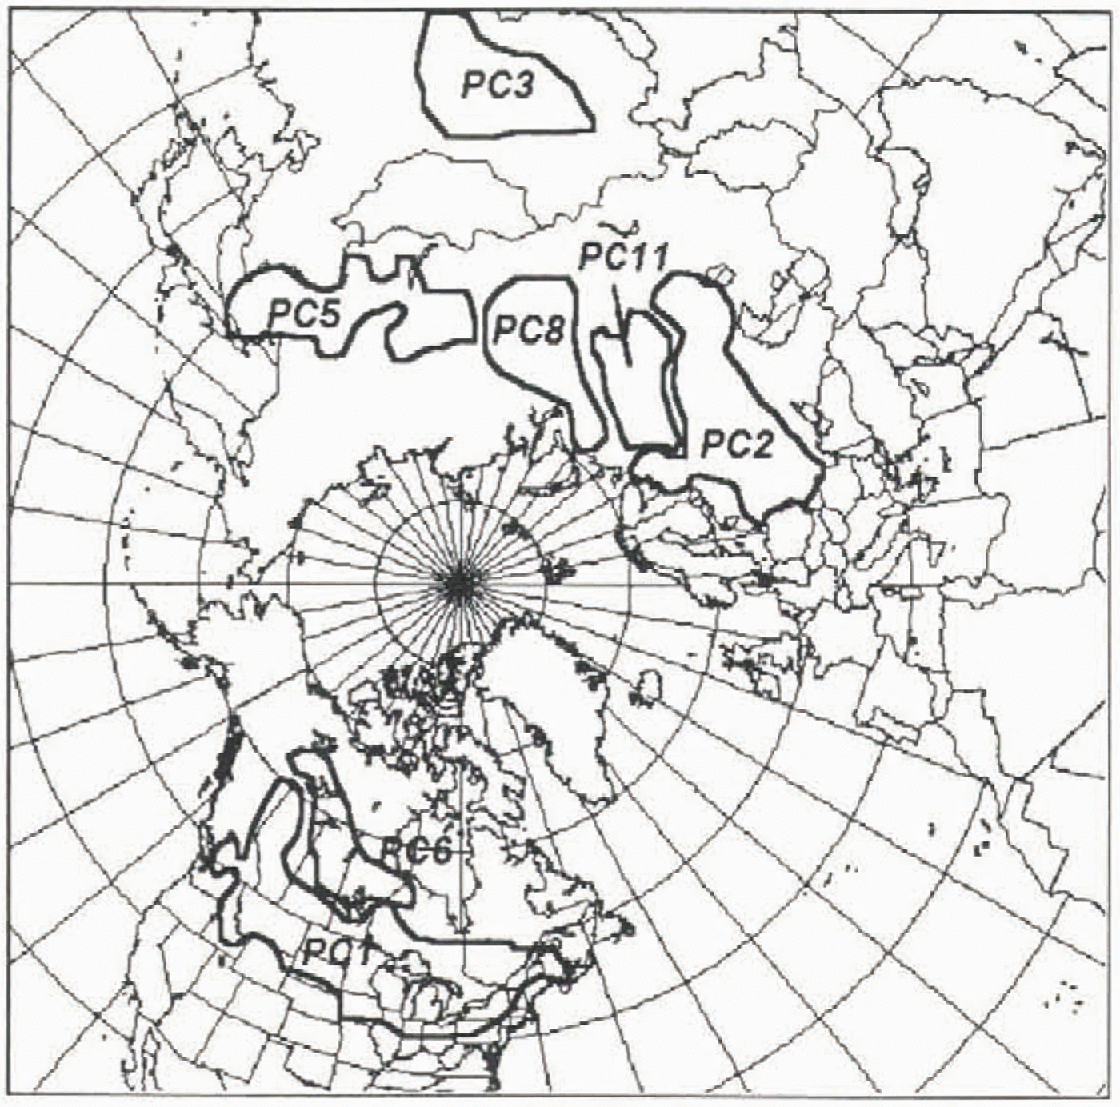
The PC analysis of satellite-derived spring snow-cover duration data revealed seven PCs that explained ≥ 5% of the variance in NH spring snow-cover variability, and that occupied coherent spatial domains. These seven PCs were able to account for more than 95% of the variance in satellite-derived estimates of NH spring snow-covered area SCA for the 1973–74 to 1994–95 period, which demonstrates the strong link between snow-cover duration and area anomalies. The locations of the PCs are shown in Figure 5 and summary information is provided in Table 1. Unfortunately, no station data were available for two of these areas (PCs 3 and 6), so a stepwise multiple regression was carried out between the PC score time series and NH spring SCA to determine if a smaller subset of PCs could be found that provided reasonable estimation of inter-annual variability in NH spring SCA. A combination of PCs 1, 2, 3 and 5 was able to explain 83% of the variance in NH spring SCA; however, ignoring PC 3 caused the amount of explanation to drop to 72%.
Location of PCs explaining ≥5% variance in NH spring snow-cover duration from NOAA weekly snow-cover charts for the 1973–74 to 1994–95 period.
Summary of PCs explaining ≥5% of the variance in satellite-derived spring (MAM) snow cover over the NH for the 1973–74 to 1994–95 period
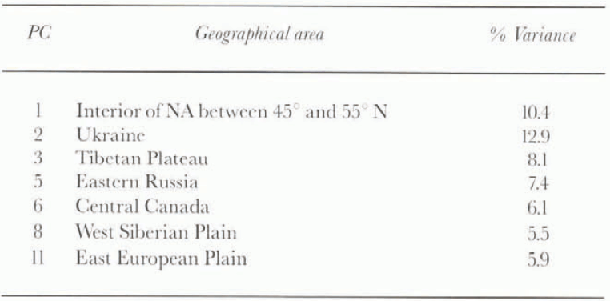
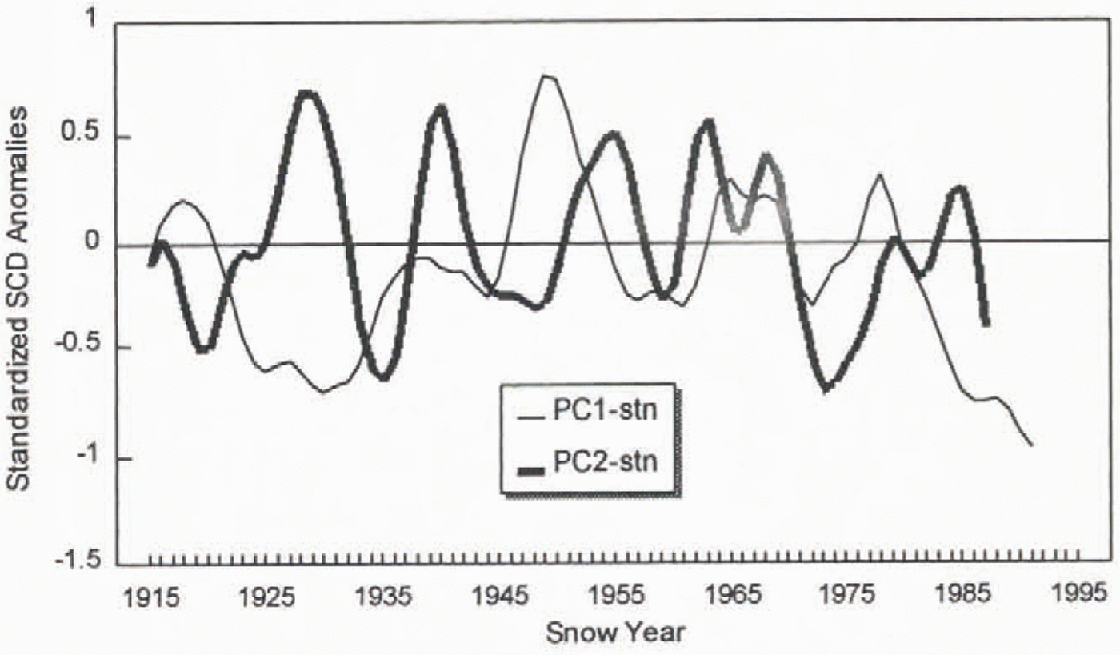
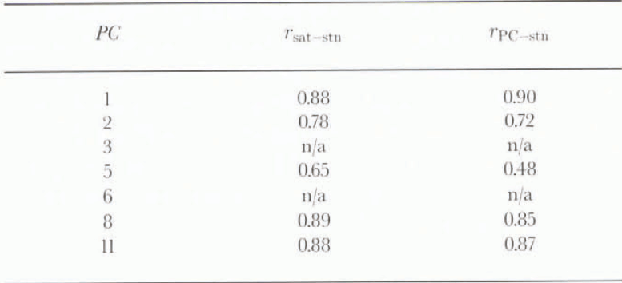
Comparison of the station-derived snow-cover estimates with those obtained by satellite data, and the PC score series (Table 2) revealed another problem with the proposed method for reconstructing snow cover: in addition to two PCs not having station data, PC 5 was poorly represented by the available station data. This made it impossible to construct a multiple linear regression model between the dominant PCs and NH spring SCA. Nevertheless, some insight into possible trends in NH spring snow cover was obtained from the station-derived time series for PCs 1 and 2, the two dominant PCs in the 1973–74 to 1994–95 period (Fig. 6). Neither series displayed any statistically significant trend over the entire period; however, both exhibited statistically significant (95% level) trends toward reduced spring snow-cover after 1950.
Station-derived estimates of snow-cover variations in areas corresponding to NH PCs 1 and 2 (see Table 1 for location of PCs). The series have been low-pass filtered with a nine-term binomial filter.
Correlations between station-derived and satellite-derived regional estimates of spring snow-cover variability (rsat-stn) and between station-derived estimates and PC score series (rPC-stn)
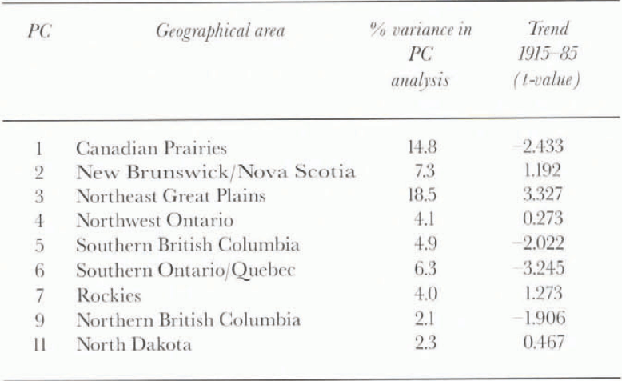
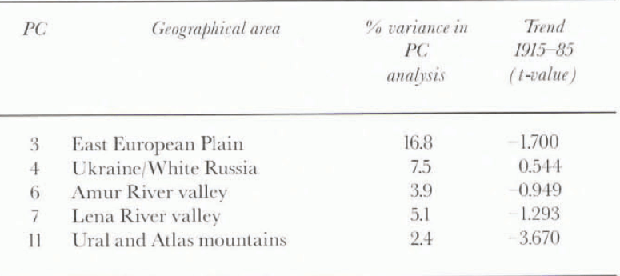
At this point, a different approach was taken to try to maximize the information content of the station data. PC analyses were performed with the station data for NA (1915–92) and Eurasia (1915–85) to develop separate NA and Eurasia regression models between the station- derived PCs and satellite-derived SCA. The rule of thumb of Reference North, Bell and CahalanNorth and others (1982) suggested that approximately 10 PCs be retained for each area. This was increased to 12 so that the cumulative variance explained by the PCs exceeded 80% in both areas. The use of a fixed number of PCs is considered justified because of the unev en station distribution — even though a PC may represent only a small amount of the total variance of the station data, the PC may in fact represent an important areal signal for reconstructing continental-scale snow cover. The 12 PCs were then input to a stepwise linear regression analysis to obtain an optimum model for estimating spring snow-covered area. For NA, a combination of nine PCs was able to explain 81% of the variance in NA spring snow-covered area over the 1972–92 calibration period (Table 3). Of the nine regions selected in the regression analysis, one region (northeast Great Plains) exhibited a significant increase in spring snow cover, while three regions (southern British Columbia, Clanadian Prairies, and southern Ontario and Quebec) exhibited a significant decrease. For Eurasia, only live PCs made a significant contribution to estimating liurasian spring snow-covered area, and the amount of variance explained (67%) was somewhat lower than in NA. A summary of the five PCs is provided in Table 4. While part of the lower explanation for Eurasia is likely related to the lack of station data over the Tibetan Plateau and northern China, weaknesses in satellite charting over eastern Eurasia during the 1970s may also be contributing (personal communication from D. Robinson, 1996).
Summary of nine station-derived PCs used to estimate NA sprint snow-covered area
Summary of fire station-derived PCs used to estimate Eurasian spring snow-covered area
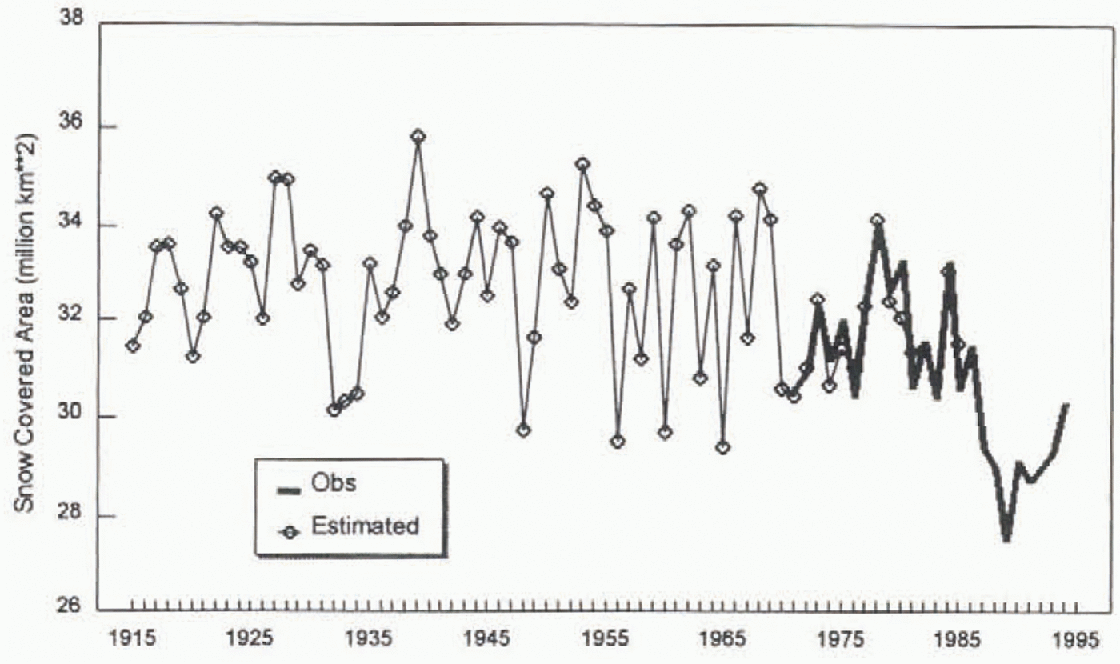
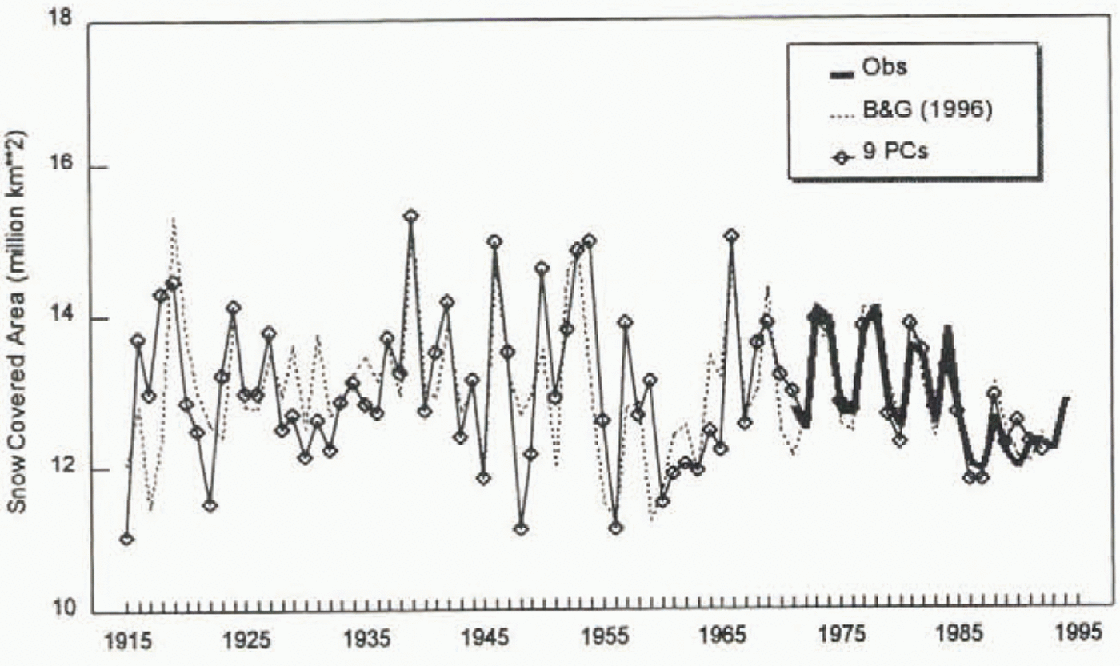
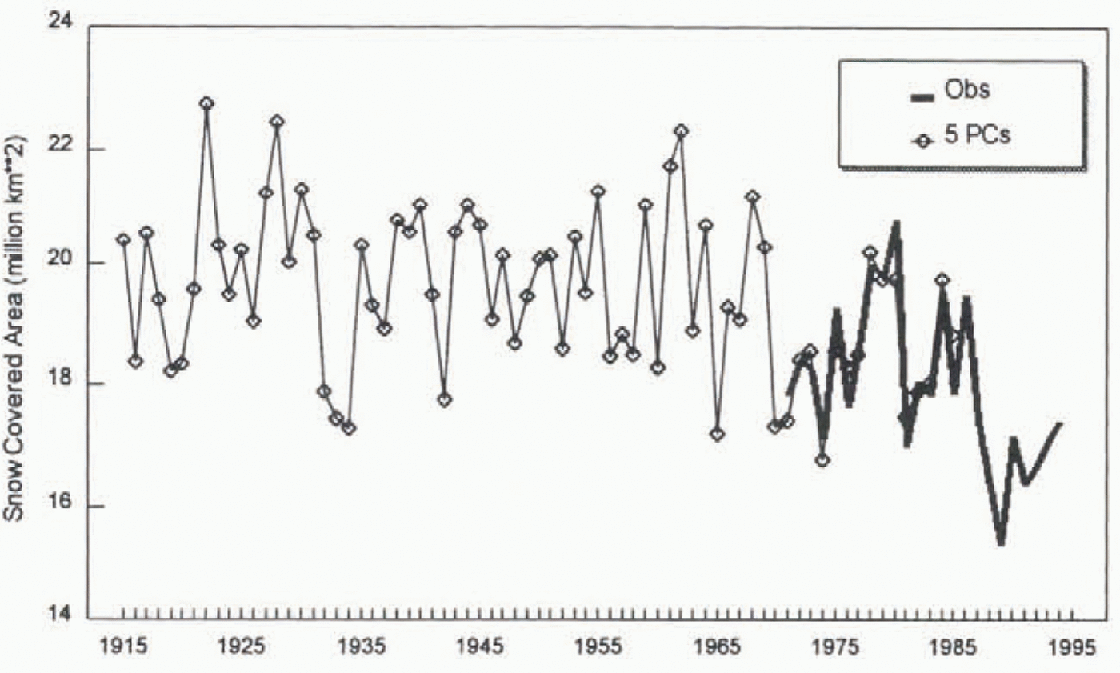
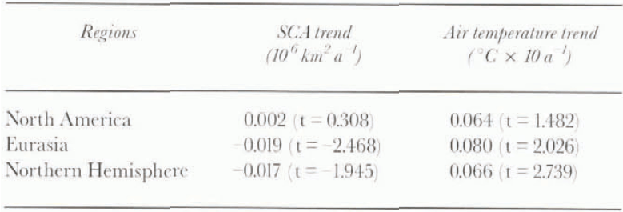
The reconstructed spring SCA scries for NA is shown in Figure 7 together with the results from a previous attempt to reconstruct SCA from station data by Reference Brown and GoodisonBrown and Goodison (1996). Overall, the two estimates agree quite well and there is little evidence of any systematic decrease in spring snow cover. Recent climate simulations of the 1905–92 period by the Hadley Centre atmospheric general circulation model with prescribed sea-surface temperature and sea-ice extents (personal communication from R. Essery, 1996) also showed no evidence of any systematic reduction in NA spring SCA this century. The reconstructed spring SCA series for Eurasia is shown in Figure 8, and the combined NH series in Figure 9. These results suggest that NH spring snow cover has exhibited a noticeable decrease since the mid-1930 s, and that the main area of decrease has been over Eurasia. To investigate Reference Groisman, Karl and KnightGroisman and others' (1994) hypothesized link between the elevated warming trend in NH spring temperatures and decreased snow cover, trend analysis was carried out with the estimated SCA series and corresponding spring air temperature' series computed over a 40-70°N latitudinal band from the gridded temperature dataset of Reference JonesJones and others (1991). The trend analysis was carried out for the common 1915–85 period of data for NA and Eurasia, which has an advantage of excluding the extremely low Eurasian snow cover observed during the late 1980s and early 1990s. The results (Table 5) support Groisman and others' hypotheses for Eurasia, which experienced a statistically significant reduction in spring snow cover and a statistically significant increase in spring air temperature over the 1915–85 period. However, there were no significant changes in spring snow cover or air temperature over NA, which decreased the statistical significance of spring snow-cover reductions at the hemispheric scale. The hemispheric reduction in spring snow cover was found to be statistically significant when the trend analysis was extended to 1994 with the inclusion of satellite data after 1985.
Estimated variation in NA spring (MAM) snow-cover extent from a calibrated multiple linear regression relationship with nine PC score series.
Estimated variation in Eurasian spring (MAM) snow-cover extent from a calibrated multiple linear regression relationship with five PC scare series.
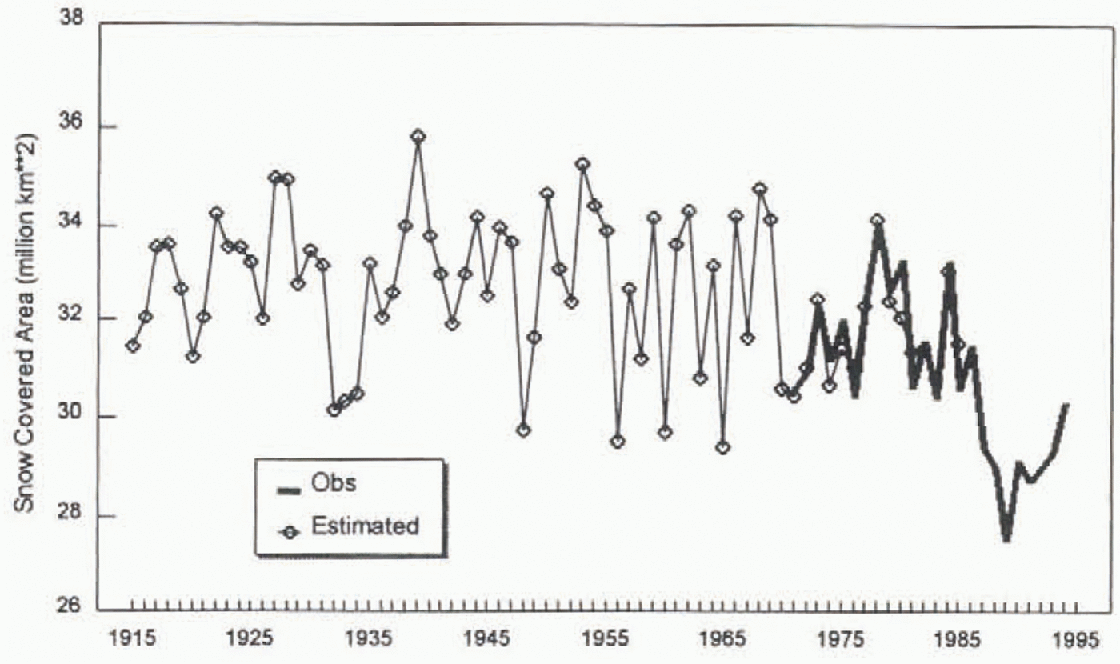
Observed linear trend in estimated spring snow-covered area and mean air temperature over the 1915–85 period
Discussion
Some caution should be used when interpreting the reconstructed snow-cover results: first, the network of stations used was less than optimal, with a number of major regions not represented (Tibetan Plateau, northern China, western Europe, eastern and western U.S.); and second, the regional weightings obtained during the calibration period were assumed to be valid over the entire period of record. This latter assumption may not be valid in light of documented shifts in atmospheric circulation patterns known to affect the climate of North America (e.g. Reference Knox, Higuchi, Shabbar and SargentKnox and others, 1988; Reference Shabbar, Higuchi and KnoxShabbar and others, 1990; Reference TrenberthTrenberth 1990; Reference Leathers and PaleckiLeathers and Palecki, 1992). To test this, the PC analysis was carried out with the station data over NA and Eurasia for two consecutive 20 year periods: 1946–65 and 1966–85, to determine if there was any evidence of major shifts in snow-cover response regions between two consecutive 20 year periods. The results for Eurasia revealed the same dominant PC in both periods: a belt running across Kazakhstan centred on 50°N which explained 18 and 20% of the variance in each period, respectively. Over NA however, there was evidence of a northward shift in the dominant area of spring snow-cover variability from the southern Great Plains to the northern Great Plains and Canadian Prairies. This change is consistent with a shift in the Pacific-North America pattern to more positive values around 1960 documented by Reference Leathers and PaleckiLeathers and Palceki (1992). Under the post-1960 circulation regime, snow cover and temperature exhibit a much stronger negative relationship over the continental interior of NA Reference BrownBrown. 1995; Reference Brown, Hughes and RobinsonBrown and others, 1995). This shift had an impact on the calibration in that the PC corresponding to the southern Cireat Plains was not selected during the step-wise multiple regression with NA spring SCA for the 1972–92 period. Closer examination of the PC score time series for the southern Circat Plains revealed that spring snow cover is characterized by a few isolated years with high scores, and that the score series did not exhibit any trend, which meant that ignoring this region only affected the reconstructed results for a few isolated years.
Conclusions
Spring snow-covered area for North America and Eurasia was reconstructed by identifying key snow-cover response regions from PC analysis of snow-cover duration data at 181 stations, then applying stepwise multiple regression analysis with satellite-derived snow-covered area to develop optimum regional weightings for estimating spring snow-covered area. A combination of nine PCs from NA, and live PCs from Eurasia were able to explain 81% and 67%, respectively, of the variance in observed NA and Furasian spring SCA. The results suggest that North Anictican spring SCA has not experienced any systematic long-term decrease this century, unlike the Eurasian results, where spring snow cover appears to have experienced a systematic decrease. These two results are supported by spring air-temperature data, which show no evidence of significant increases over NA, but significant increases over Eurasia. A prominent feature of the extended NH spring SCA time series is the anomalously low snow cover observed during the late 1980s and early 1990s.
Acknowledgements
This work is a contribution to the NASA/EOS CRYSYS program, which is supported by the Atmospheric Environment Program of Environmenl Canada. The author gratefully acknowledges the contribution of valued colleagues at Rutgers University (D. Robinson, M. Hughes and A. Frei) who have been unfailingly helpful and open with their data, research results and advice. Thanks are also extended to the two anonymous reviewers for their useful comments and to P. Groisman for invaluable insights into the climate data-collection program in the former Soviet Union. This Study would not have been possible without access to important global and regional climatic datasets provided by the Carbon Dioxide Information Analysis Center.