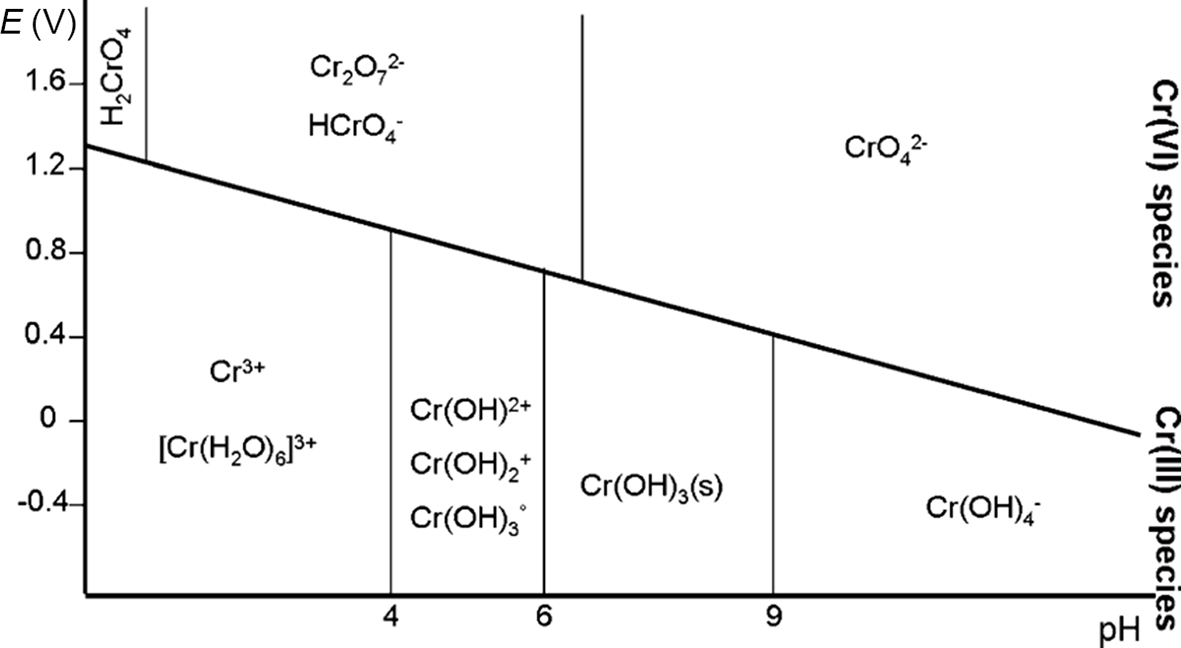
The oxidation states of Cr commonly found in nature are the trivalent form Cr(III) and the hexavalent form Cr(VI) (Rai et al., Reference Rai, Eary and Zachara1989; Richard & Bourg, Reference Richard and Bourg1991; Kotaś & Stasicka, Reference Kotaś and Stasicka2000; Magar et al., Reference Magar, Martello, Southworth, Fuchsman, Sorensen and Wenning2008). In its trivalent state, Cr mainly forms insoluble or sparingly soluble compounds such as chromium oxide (mineral eskolaite, Cr2O3) and chromium hydroxide (minerals grimaldite, guyanite and bracewellite, Cr(OH)3). The most common Cr(III) natural mineral is chromite ((Mg,Fe2+)(Cr,Al,Fe3+)2O4), belonging to the oxyspinel group, which is the main ore source for Cr. The solubility of Cr(III) increases in the presence of organic ligands (Hao et al., Reference Hao, Ma, Wang, Zhu and He2022). In contrast, hexavalent chromium forms the chromate ion (CrO42–) and the dichromate ion (Cr2O72–), both of which are highly soluble at the most common pH conditions of natural waters (Salem et al., Reference Salem, Parkerton, Lewis, Huang and Dickson1989; Unceta et al., Reference Unceta, Séby, Malherbe and Donard2010). Figure 1 shows the Pourbaix diagram of chromium species in water under various pH and redox conditions.
Pourbaix diagram showing the predominant chemical species of chromium in aqueous systems (after Unceta et al., Reference Unceta, Séby, Malherbe and Donard2010). E = voltage potential.

Figure 1 Long description
Pourbaix diagram showing the predominant chemical species of chromium in aqueous systems. The x-axis is labeled pH, ranging from 0 to 14. The y-axis is labeled E in volts, ranging from -0.4 to 1.6. The diagram includes regions for different chromium species: Cr superscript 3 plus, [Cr(H subscript 2 O) subscript 6] superscript 3 plus, Cr(OH) subscript 2 plus, Cr(OH) subscript 3, Cr(OH) subscript 4 superscript minus, Cr(OH) subscript 3 (s), CrO subscript 4 superscript 2 minus, Cr subscript 2 O subscript 7 superscript 2 minus, HCrO subscript 4 superscript minus and H subscript 2 CrO subscript 4. Vertical and sloped lines separate these regions, indicating transitions between species. At low pH and high potential, Cr(VI) species like CrO subscript 4 superscript 2 minus dominate. At high pH and low potential, Cr(III) species such as Cr(OH) subscript 3 are stable. The diagram illustrates the stability of chromium species across different pH and potential conditions, highlighting the transitions between trivalent and hexavalent states.
Cr(III) is considered an essential micronutrient for the proper functioning of living organisms, while Cr(VI) exerts toxic effects on biological systems (Hossini et al., Reference Hossini, Shafie, Niri, Nazari, Esfahlan and Ahmadpour2022). This divergence in toxicological properties is intrinsically linked to the different chemical features exhibited by the two oxidation states (Tumolo et al., Reference Tumolo, Ancona, De Paola, Losacco, Campanale, Massarelli and Uricchio2020; Aharchaou et al., Reference Aharchaou, Maul, Pons, Pauly, Poirot and Flayac2022; Mortada et al., Reference Mortada, El-Naggar, Mosa, Palansooriya, Yousaf and Tang2023).
Compounds of Cr(VI) are mobile and bioavailable compared to the trivalent Cr species (Mandiwana et al., Reference Mandiwana, Panichev, Kataeva and Siebert2007; Martello et al., Reference Martello, Fuchsman, Sorensen, Magar and Wenning2007). Due to its toxicity, chromium release into aquatic ecosystems is subject to regulation through international, national and local laws. In the European Union (EU) regulations, Cr is on the list of significant pollutants (Annex VIII – Water Framework Directive). Various international bodies within the EU, such as the Helsinki Commission (HELCOM) and the Oslo–Paris Convention (OSPAR), have issued recommendations regarding permissible emission levels of chromium compounds, most of which have been adopted and enforced by Member States. To maintain Cr(VI) in discharge waters below the legislated level, many industries are required to treat their effluents (Vaiopoulou & Gikas, Reference Vaiopoulou and Gikas2020). A number of techniques have been used to remove hexavalent chromium, but many of them have failed to bring contaminants down to an acceptable level according to the recommendations and guidelines of various agencies (Irshad et al., Reference Irshad, Sattar, Nawaz, Al-Hussain, Rizwan and Bukhari2023).
The typical method for eliminating Cr(VI) from industrial wastewater involves precipitation of Cr(III) hydroxide through redox reactions, facilitated by reducing agents such as sodium metabisulfite. However, this approach requires the use of substantial amounts of reagents, including sodium hydroxide, often resulting in elevated costs (Rosa et al., 2021). Alternative methods for Cr(VI) removal include techniques such as membrane filtration, ion exchange, coagulation, reverse osmosis and chemical precipitation (Irshad et al., Reference Irshad, Sattar, Nawaz, Al-Hussain, Rizwan and Bukhari2023).
Among these, adsorption by zeolites appears particularly promising for eliminating pollutants from aqueous solutions. Zeolites are characterized by a three-dimensional porous structure with a high specific surface area and a large cation-exchange capacity (CEC). These characteristics give zeolites various advantageous physical and chemical properties, making them suitable for a wide range of water treatment applications, such as detergents, the removal of industrial pollutants, the removal of radionuclides from nuclear waste effluents, the treatment of acidic mine drainage waters and the recovery of heavy metals (Munthali et al., Reference Munthali, Elsheikh, Johan and Matsue2014). To expand their applicability, zeolites may undergo various surface modifications or chemical alterations to make them compatible with various chemical species, such as oxyanions (Franus et al., Reference Franus, Wdowin and Bandura2015; Suhartana et al., Reference Suhartana and Azmiyawati2018; Sumari et al., Reference Sumari, Santoso and Wardani2018). In particular, zeolites modified with iron oxides/hydroxides and iron ions are valuable substrates for removing metals and metalloids in anionic form, such as Cr(VI) (Tashauoei et al., Reference Tashauoei, Attar, Kamali, Amin and Nikaeen2010; Lv et al., Reference Lv, Li, Jiang, Ackley, Fenske and Demarco2014; Chmielewská et al., Reference Chmielewská, Tylus, Drábik, Majzlan, Kravčak and Williams2017).
There are several methods for modifying zeolites with iron, which can be divided into two main categories. The first category involves enriching the zeolite with Fe(II) ions, which act as reducing agents, promoting the reduction of Cr(VI) to Cr(III) within the zeolite structure (Døssing et al., Reference Døssing, Dideriksen, Stipp and Frei2011; Bols et al., Reference Bols, Devos, Rhoda, Plessers, Solomon and Schoonheydt2021; Rosa et al., Reference Rosa, Boga, Cruz, Furquim and Shinzato2022). The reduction of Cr(VI) to Cr(III) is a process that naturally occurs in the environment due to the presence of a number of electron donors, including Fe(II)-bearing phases (Brigatti et al., Reference Brigatti, Lugli, Cibin, Marcelli, Giuli and Paris2000; Kiser & Manning, Reference Kiser and Manning2009). However, the kinetics of this reaction are generally very low, and it is common to use reducing agents such as catalysts to speed up this process (Kwak et al., Reference Kwak, Yoo, Moon and Baek2018). This category of zeolites is referred to as bivalent iron zeolites (BIZs).
The second category of modifications relies on the complexation of hexavalent chromium onto trivalent iron oxides/hydroxides at the surface of the zeolite (trivalent iron zeolite (TIZ)). Chromates, particularly at a low pH, tend to bond to the surfaces of hydrous ferric oxides (Villalobos et al., Reference Villalobos, Trotz and Leckie2001; Tzou et al., Reference Tzou, Wang and Loeppert2003; Ajouyed et al., Reference Ajouyed, Hurel, Ammari, Allal and Marmier2010; Du et al., Reference Du, Li, Liao, Hanson, Leick, Hoeppner and Jiang2012).
Both BIZ and TIZ show promise as viable alternatives for treating water contaminated with hexavalent chromium. However, a detailed comparative analysis to determine their relative effectiveness in Cr(VI) removal is currently lacking. Direct comparison of the adsorption capacity values reported in various studies is inherently challenging due to variations in analytical methodologies and experimental design. Differences in the type of natural zeolite (NZ) used, the modification technique, initial contaminant concentration, contact time, particle size, solid-to-liquid ratio, pH, ionic strength and temperature can significantly influence the calculated adsorption capacity. For example, Lofù et al. (Reference Lofù, Mastrorilli, Dell’Anna, Mali, Sisto and Vignola2016) reported an adsorption capacity of 0.09 mg g–1 for an Fe(II)-modified NZ, whereas Rosa et al. (2021) measured a value of 0.9 mg g–1 under different experimental conditions, representing a 10-fold difference. Such discrepancies highlight how strongly adsorption capacity depends on the specific experimental framework rather than solely on the intrinsic properties of the modified material. Similar variability has also been reported for Fe(III)-modified zeolites.
For this reason, to provide a meaningful and scientifically sound comparison of material performance, it is essential to evaluate different modification strategies under identical experimental conditions, using the same original material. Only by controlling these variables can differences in removal efficiency be attributed to the modification approach itself rather than to circumstantial factors. Accordingly, this study presents a detailed physical and chemical characterization of BIZ and TIZ, together with a systematic evaluation of their efficacy in treating Cr(VI)-contaminated water, using both a synthetic solution and water collected from an actual polluted site.
Materials and methods
Chemicals and sorbent material
The NZ was purchased from Zeocel Italia. This material originates from Slovenia and consists of natural clinoptilolite zeolite grains with particle sizes 0.7–1.2 mm, with a specific surface area of 30m2 g–1 and a CEC of 1.5–2.1 mol kg–1. Other minor constituents are cristobalite, mica clay minerals, plagioclase and rutile according to the supplier’s datasheet.
All of the reagents necessary for the synthesis of BIZ and TIZ and for the sorption experiments – ferrous sulfate heptahydrate (FeSO4·7H2O), ferric chloride (FeCl3), sodium hydroxide (NaOH) and potassium dichromate (K2Cr207) – were purchased from Brenntag S.p.A.
Modified zeolites
The method proposed by Liu et al. (Reference Liu, Li, Tan and Zhu2010) and followed by Rosa et al. (2021) was applied to saturate the NZ with Fe(II) ions on its exchange sites. A total of 100 g of NZ was mixed with 1 L of a solution of 1 M FeSO4·7H2O at 50°C for 24 h to achieve the best conditions for modifying the zeolite with Fe(II). The mixture was then filtered and washed with distilled water, dried at 80°C overnight and stored in a desiccator. This modified zeolite is referred to as BIZ (bivalent iron zeolite).
A proprietary method developed by DND Biotech was used to precipitate trivalent iron oxides onto the surface of the NZ. In this process, the zeolite was immersed in a highly concentrated Fe(III) solution prepared from FeCl3 and NaOH. The resulting modified material is referred to as TIZ (trivalent iron zeolite).
Synthetic solution and Cr(VI)-contaminated natural water
Various laboratory-produced synthetic solutions with varying Cr(VI) concentrations were prepared using demineralized water and K2Cr2O7. One solution containing 29.2 mg L–1 of Cr(VI) was initially applied in the batch tests. Another solution, prepared with a lower concentration of 2.26 mg L–1 Cr(VI) to better approximate the concentration in real contaminated water, was used in both batch and column tests.
Additional solutions were prepared to evaluate the influence of pH and electrical conductivity (EC). The pH was adjusted using NaOH and nitric acid (HNO3). To vary EC, pure demineralized water, pure tap water and four intermediate mixtures of the two at different proportions were employed. The tap water is characterized by a Ca–HCO3 species, with the following major ion concentrations (mg L–1): Ca2+ = 58.9; Mg2+ = 14.7; Na+ = 41.1; K+ = 1.5; Cl– = 41.5; SO42– = 60.0; and HCO3– = 232.0.
The real Cr(VI)-contaminated water was collected from a surface water body in an urban area severely contaminated by hexavalent chromium, released from pyrolysed tannery sludge wastes in central Italy (Ghezzi et al., Reference Ghezzi, Arrighi, Mugnaioli, Perchiazzi, Zamponi and Pollastri2024). This water is characterized by a high salinity (EC of 1.2 mS cm–1), pH 7.7 and a Cr(VI) concentration of 2.14 mg L–1.
Batch tests and column tests
Batch tests were conducted to estimate the zeolite sorption capacity (Q) and to investigate the kinetics of Cr(VI) removal. Prior to the tests, the zeolites were washed with distilled water and dried at 80°C for at least 4 h. Batch and column tests were performed using both the Cr(VI)-bearing synthetic solution and the Cr(VI)-contaminated natural water.
To evaluate the effect of contact time on Cr(VI) removal, kinetic batch tests were performed using the synthetic solution with an initial Cr(VI) concentration of 29.2 mg L–1 (pH 7.6). For each run, 1 g of zeolite (NZ, BIZ or TIZ) was added to 100 mL of solution in polyethylene bottles and agitated at 120 rpm at room temperature. Aliquots were collected at t = 1, 3, 5, 7, 9, 24, 48, 72, 96 and 168 h. For dosage-dependent batch tests, Cr(VI) concentrations were determined after 24 and 168 h, selected on the basis of the kinetic test. In synthetic solution batch tests, variable amounts of zeolite (0.5, 1.0, 1.5, 2.0, 2.5 and 3.0 g) were added to 100 mL of the Cr(VI)-bearing solution; for natural contaminated water, 0.1, 0.2, 0.3, 0.4 and 0.5 g of zeolite were added to 100 mL of water. All tests were performed under agitation using an orbital shaker at 120 rpm at room temperature.
Additional batch tests with synthetic solutions were performed to evaluate the effect of pH on Cr(VI) removal. In these tests, 1.0 g of zeolite was added to Cr(VI)-containing solutions with pH values adjusted between 2.5 and 9.0. A similar procedure was applied to investigate the effect of EC, which was varied from 40 µS cm–1 (pure demineralized water with added Cr(VI)) to 600 µS cm–1 (tap water with added Cr(VI)). The determination of the final concentration of hexavalent chromium was carried out using a visible spectrophotometer (Iris HI801).
Synthetic solution column tests and natural Cr(VI)-contaminated water column tests were conducted using columns with an inner diameter of 10 mm and a height of 25 cm, filled with 1.0 g of modified zeolite. The system operated with a peristaltic pump, which pumped 0.3 L h–1 of the solution in a closed-cycle system.
The total Cr(VI) sorption (A, mg), the percentage of Cr(VI) removal (R, %) and the sorption capacity (Q, mg g–1) were calculated according to Equations 1–3, respectively:
 \begin{align}A = {\text{ }}({C_i}-{C_t}){\text{ }} \times V\qquad\end{align}
 \begin{align}{ }R{ } = { }\left( {{C_i}{ }-{ }{C_t}} \right){ }/{ }{C_i}{ } \times { }100\end{align}
 \begin{align}Q{ } = { }A{ }/{ }{W_{\text{Z}}}\qquad\qquad\quad\quad\end{align}
where Ci and Ct are the initial concentration and concentration of Cr(VI) (mg L–1) at time t, respectively, V is the volume (L) of Cr(VI) solution and W Z (g) is the weight of zeolite.
Adsorption isotherms
Adsorption isotherms (Langmuir and Freundlich models) were applied to the dataset of the batch tests, consisting of data from 168 h of contact between the synthetic solution and the zeolites. The Langmuir isotherm is described by Equation 4:
 \begin{equation}Q = \frac{{Q_{\text{max}} \times {\mathrm{K_L}} \times C_t}}{{1 + {\mathrm{K_L}} \times C_t}}\,\,\end{equation}
where Q max represents the maximum adsorption capacity (mg g–1) and KL is the Langmuir isotherm constant, which shows the binding affinity between the adsorbent and the adsorbate. The Freundlich isotherm is given by Equation 5:
 \begin{equation}Q = {\text{ }}{{\text{K}}_{\text{F}}} \times {C_t}^{1/n}\end{equation}
where KF is the Freundlich constant used to measure the adsorption capacity and 1/n is the adsorption intensity. The value of 1/n defines whether the adsorption process is either favourable (0.1 < 1/n < 0.5) or unfavourable (1/n > 2).
Cr isotope analysis
The 53Cr/52Cr ratio of Cr(VI) in water from batch experiments was measured by multicollector inductively coupled plasma mass spectrometry (MC-ICP-MS; AlS Scandinavia AB; Neptune PLUS, Thermo Scientific, Bremen, Germany) using a combination of internal standardization and external calibration (Pontér et al., Reference Pontér, Pallavicini, Engström, Baxter and Rodushkin2016). The measured 53Cr/52Cr ratios were expressed using the conventional δ notation referred to the NIST SRM 979 standard and as shown in Equation 6:
 \begin{equation}{{{x03B4}} ^{53}}{\text{Cr }} = {\text{ }}\left( {\left( {^{{\text{53}}}{\text{Cr}}{{\text{/}}^{{\text{52}}}}{\text{C}}{{\text{r}}_{{\text{sample}}}}{{\text{/}}^{{\text{53}}}}{\text{Cr}}{{\text{/}}^{{\text{52}}}}{\text{C}}{{\text{r}}_{{\text{SRM 979}}}}} \right){\text{ }}-{\text{ }}1} \right){\text{ }} \times {\text{ }}1000\end{equation}
The acceptance criterion is that δ53Cr for purified Cr does not differ from the value before purification by more than 1‰. Recovery after column chemistry should be better than 90%. The chromium isotope fractionation between the various Cr species allows detection of Cr reduction in aqueous environments (Li et al., Reference Li, Huang, Li, Tang, Liu and Hughes2022). The amount of Cr(VI) reduction to Cr(III) can be traced isotopically, as the δ53Cr value of the residual Cr(VI) in solution progressively increases following a Rayleigh-type function (Ellis et al., Reference Ellis, Johnson and Bullen2002; Kitchen et al., Reference Kitchen, Johnson, Bullen, Zhu and Raddatz2012).
Zeolite characterization
NZ, BIZ and TIZ were characterized by X-ray powder diffraction (XRPD), X-ray fluorescence (XRF) spectroscopy, scanning electron microscopy (SEM) and transmission electron microscopy (TEM) at the Dipartimento di Scienze della Terra of the Università di Pisa and at the Center for Instrument Sharing of the University of Pisa (CISUP). The BIZ and TIZ samples were analysed before and after sorption experiments in batches.
The XRPD data were collected on a Bruker D2 phaser diffractometer, equipped with a Lynxeye detector, operating at 30 kV and 10 mA and using Cu-Kα radiation (λ = 1.54184 Å). Identification of the crystalline phases was carried out with EVA-Bruker software (Bruker AXS, Karlsruhe, Germany), using the PDF2-2023 database (Gates-Rector & Blanton, Reference Gates-Rector and Blanton2019), and these results were further validated through Rietveld refinement of the XRPD traces (Bish & Post, Reference Bish and Post1993; Young, Reference Young1993), carried out with Topas-Academic v7 software (Coelho, Reference Coelho2018). XRF analysis was performed with a Niton™ XL3t XRF analyser on a few grams of loose and dried grains from the various zeolite samples.
A Hitachi tabletop 3030plus SEM device was used to visualize the external surfaces of loose zeolite grains and the internal cross-sections of grains embedded in resin and milled along a planar surface. An integrated energy-dispersive X-ray spectroscopy (EDS) device was used for elemental analysis and mapping to identify zones of interest for further detailed analysis. TEM analysis was performed using a JEOL JEM-F200 device working at 200 kV and equipped with a Schottky field emission gun source. TEM images were acquired with a Gatan RIO16 CMOS camera (4k × 4k). EDS point analysis and elemental mapping were performed with a JEOL SSD detector.
Nitrogen adsorption–desorption isotherms were obtained with a Gemini 2375 Series surface area analyser (Micromeritics). Samples were degassed for 4 h at 160°C under a continuous flow of nitrogen gas prior to analysis. The calculation of the specific surface area was carried out using the Brunauer–Emmett–Teller (BET) method. These measurements were conducted at the Dipartimento di Ingegneria Civile e Meccanica, Università degli Studi di Cassino e del Lazio Meridionale.
Results and discussion
Effect of contact time on Cr(VI) removal in synthetic batch tests
The temporal evolution of residual Cr(VI) concentrations in the presence of NZ, BIZ and TIZ is listed in Table 1. The synthetic solution had an initial Cr(VI) concentration of 29.2 mg L–1, a pH of 7.6 and an EC of 60 µS cm–1. NZ did not adsorb Cr(VI) throughout the experiment. This confirms that unmodified clinoptilolite has no significant affinity for chromate under the investigated conditions.
Evolution of residual Cr(VI) concentration (mg L–1) over time in the batch tests.

Table 1 Long description
The table reports residual hexavalent chromium concentration in milligrams per liter measured at multiple times from 0 to 168 hours for three zeolites: NZ, BIZ, and TIZ. All start at 29.2 mg per liter at time zero. NZ remains essentially unchanged across the test, staying around 28.7 to 29.1 mg per liter through 168 hours. BIZ shows a steady decline over time, reaching 21.3 mg per liter at 24 hours and 14.4 mg per liter at 168 hours, the lowest final value among the three. TIZ drops quickly early on, from 29.2 at time zero to 25.6 at 1 hour and 18.4 at 24 hours, then levels off near 17.2 to 17.4 mg per liter from 48 to 168 hours. By 168 hours, BIZ has the greatest overall reduction, TIZ has a moderate reduction with a plateau after about 48 hours, and NZ shows minimal change. The table provides residual concentrations only; it does not include variability, replication, or experimental conditions needed to judge statistical significance.
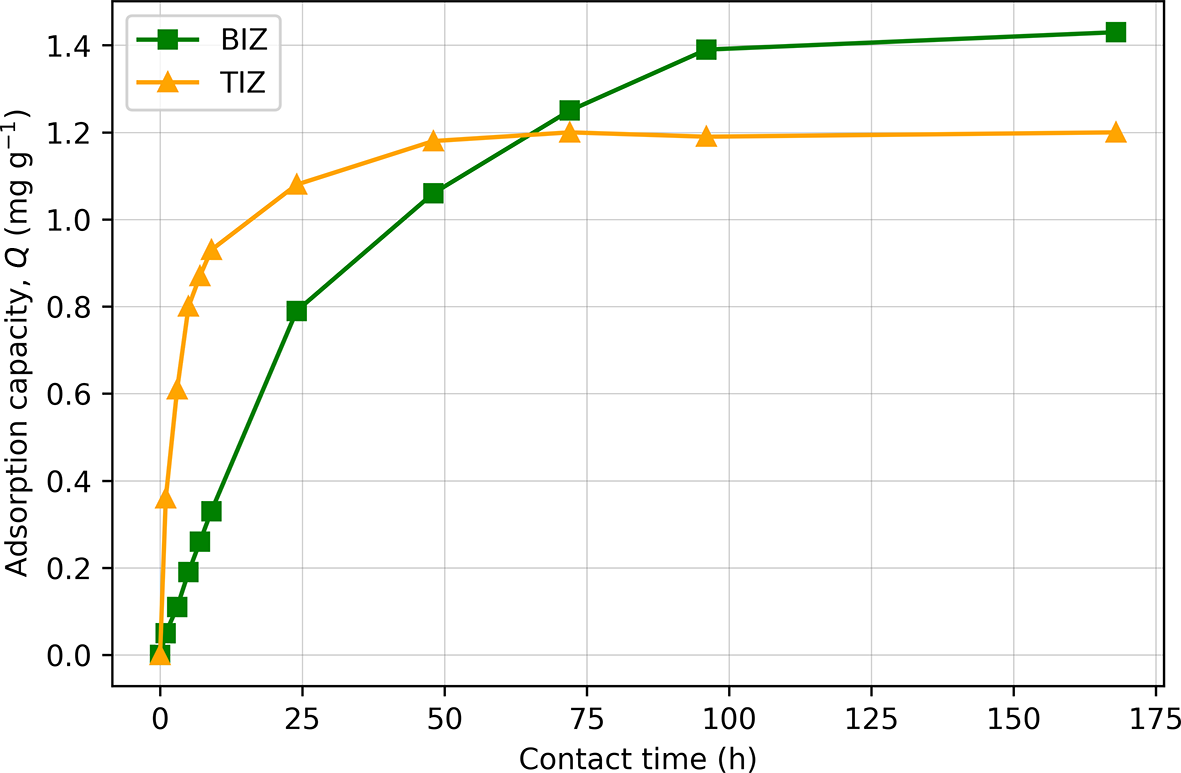
In contrast, both modified zeolites exhibited a progressive decrease in Cr(VI) concentration, although with markedly different kinetic behaviours. Figure 2 illustrates this difference by showing the evolution of adsorption capacity (Q) as a function of contact time.
Effect of contact time on adsorption capacity (Q) for BIZ and TIZ in the batch experiments. TIZ exhibits rapid Cr(VI) uptake and early saturation, whereas BIZ shows a slower but continuous increase in adsorption capacity.

BIZ displays a slower but continuous increase in adsorption capacity over the entire experimental duration, reaching a higher Q value (∼1.43 mg g–1) after 168 h. No further Cr(VI) removal was detected beyond this time, suggesting that equilibrium was eventually reached. This kinetic behaviour is consistent with the proposed removal mechanism. Extra-framework Fe2+ ions are progressively released into solution according to ion-exchange equilibrium. Once in solution, Fe2+ acts as a reducing agent, converting Cr(VI) to Cr(III) in a subsequent redox reaction. Once Fe2+ is consumed during reduction, the exchange equilibrium shifts to release additional Fe2+ from the zeolite matrix, and the process continues until the available pool of exchangeable Fe2+ is depleted.
In contrast, TIZ shows a rapid increase in adsorption capacity during the first hours, reaching near-equilibrium conditions between 24 and 48 h, with a maximum Q of 1.2 mg g–1. This behaviour is consistent with a fast, adsorption-controlled mechanism on Fe(III)-(oxy)hydroxide surface sites, as reported in kinetic studies describing Cr(VI) uptake by Fe(III) phases, which commonly follow pseudo-second-order adsorption kinetics (Yu & Zhang, Reference Yu and Zhang2014; Sultana et al., Reference Sultana, Naeem, Mahmood, Ud Din, Saeed, Khan and Ahmad2021).
Based on these kinetic trends, 24 h was selected as a representative short contact time, sufficient for TIZ to approach its near-saturation point (∼90% of its adsorption capacity), and consistent with contact times commonly adopted in many others batch adsorption studies, whereas 168 h was used to approximate equilibrium conditions for BIZ in batch experiments.
As stated previously, direct comparison of adsorption capacity values (Q) reported in the literature is not straightforward due to significant differences in experimental conditions. Rosa et al. (Reference Rosa, Boga, Cruz, Furquim and Shinzato2022) investigated an Fe(II)-modified zeolite and reported a Q value of ∼0.9 mg g–1, which is in agreement with the present results when considering that their experiments were conducted at a lower initial Cr(VI) concentration (18.5 mg L–1) and with a contact time of 24 h. Rosa et al. (Reference Rosa, Boga, Cruz, Furquim and Shinzato2022) reported the removal of nearly 100% of the available Cr(VI) from solution, suggesting that the actual adsorption capacity of the material may be higher than the reported value.
To the best of our knowledge, no comparable studies are available in the literature reporting batch adsorption experiments using Fe(III)-modified zeolites with synthetic solutions containing only Cr(VI), which limits the possibility of making direct comparisons.
Effect of zeolite dosage on Cr(VI) removal in synthetic batch tests
Batch experiments with increasing zeolite dosages were analysed to evaluate the influence of the amount of sorbent on Cr(VI) removal efficiency and adsorption capacity. The initial Cr(VI) concentration in the synthetic solution was 29.2 mg L–1 at pH 5.6. Increasing amounts of BIZ and TIZ (0.5–3.0 g 100 mL–1) were tested. NZ was also included, but, once again, regardless of the quantity of zeolite used, the final concentrations were comparable to the initial concentration. The results of the batch tests for BIZ and TIZ with synthetic solution after 24 and 168 h are listed in Tables 2 & 3, respectively.
Batch test results for the 24 h experiment with synthetic solution.

Table 2 Long description
The table reports 24-hour chromium six concentration remaining in solution, total sorbed mass, removal percentage, and sorption capacity for two materials, BIZ and TIZ, at zeolite doses from 0.5 to 3.0 g. For BIZ, the remaining concentration drops from 25.1 to 15.7 mg per liter as dose increases, while removal rises from 14.04 to 46.23 percent and sorbed mass increases from 0.41 to 1.35 mg. For TIZ, the remaining concentration drops more strongly from 24.35 to 8.90 mg per liter, with removal increasing from 16.61 to 69.52 percent and sorbed mass from 0.48 to 2.03 mg. At every dose, TIZ shows higher removal and higher sorbed mass than IZ; for example at 2.5 g, TIZ removes 65.07 percent versus 40.41 percent for BIZ. Sorption capacity generally decreases with increasing dose for both materials, from 0.82 to 0.45 mg per gram for BIZ and from 0.97 to 0.68 mg per gram for TIZ, indicating less uptake per gram at higher mass even as total uptake rises. The values reflect a single 24-hour endpoint and do not describe earlier kinetics or variability.
A = total Cr(VI) sorption; Ct = Cr(VI) concentration at 24 h; Q = sorption capacity; R = removal rate.
Batch test results for the 168 h experiment with synthetic solution.

Table 3 Long description
The table reports chromium performance after 168 hours for two zeolite types, BIZ and TIZ, across doses from 0.5 to 3.0 grams, listing final concentration, total sorbed mass, removal percent, and sorption capacity per gram. For both materials, higher zeolite dose lowers the final concentration and raises total sorbed mass and removal percent. BIZ improves from 20.1 mg per liter and 31.16 percent removal at 0.5 g to 3.25 mg per liter and 88.87 percent removal at 3.0 g, with sorbed mass rising from 0.91 to 2.59 mg. TIZ improves from 23.30 mg per liter and 20.21 percent removal at 0.5 g to 4.70 mg per liter and 83.90 percent removal at 3.0 g, with sorbed mass rising from 0.59 to 2.45 mg. At every dose, BIZ shows lower final concentration and higher removal percent than TIZ, for example at 2.5 g BIZ reaches 83.39 percent versus 78.42 percent for TIZ. Sorption capacity per gram decreases as dose increases for both materials, from 1.82 to 0.86 mg per gram for BIZ and from 1.18 to 0.82 mg per gram for TIZ. These results describe outcomes at a single time point and do not indicate how quickly equilibrium was reached or how performance might change under different starting conditions.
A = total Cr(VI) sorption; Ct = Cr(VI) concentration at 168 h; Q = sorption capacity; R = removal rate.
As expected, after 24 h TIZ exhibits a better efficiency for removing Cr(VI) from the synthetic solution compared to BIZ, with the difference increasing as dosage increases. With 0.5 g of zeolite, the removal efficiencies are 16.61% for TIZ and 14.04% for BIZ. When the zeolite dosage increases to 3.0 g, the removal efficiencies increase to 69.52% for TIZ and 46.23% for BIZ.
The trends of chromium removal are reversed by the end of the experiment at 168 h, when saturation is reached, with BIZ showing better performance in terms of Cr(VI) removal from the synthetic solution, as 0.5 g BIZ removed 31.16% of Cr(VI), with a Q value of 1.81, while the same amount of TIZ removed 20.21% of Cr(VI), with a Q value of 1.18. Both zeolites show similar trends until reaching the highest Cr(VI) removal percentages of 88.87% and 83.90% when using 3.0 g of BIZ and TIZ, respectively.
Isotopic analysis
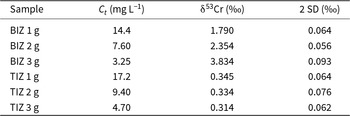
To δ53Cr values determined on some synthetic solutions used for the batch experiments are listed in Table 4.
Isotopic analysis from BIZ and TIZ after 168 h synthetic solution batch tests.

Table 4 Long description
The table reports chromium six concentration after 168 hours and the associated chromium isotope value for BIZ and TIZ at three mass loadings, with uncertainty given as two standard deviations. For BIZ, Ct decreases from 14.4 to 7.60 to 3.25 milligrams per liter as loading increases from 1 to 3 grams, while the isotope value increases from 1.790 to 2.354 to 3.834 per mil. For TIZ, Ct also decreases with higher loading, from 17.2 to 9.40 to 4.70 milligrams per liter, but the isotope value remains nearly constant at 0.345, 0.334, and 0.314 per mil. At comparable loadings, BIZ has lower Ct than TIZ and much higher isotope values, especially at 3 grams. Reported uncertainties are similar across rows, ranging from 0.056 to 0.093 per mil, so the strong upward shift in BIZ is larger than the stated uncertainty, whereas the small changes in TIZ are close to the uncertainty range. Values reflect conditions at the 168 hour endpoint and should not be interpreted as time trends within the test.
2 SD = standard deviation; δ53Cr = conventional δ-notation for the 53Cr/52Cr ratio of Cr(VI); Ct = Cr(VI) concentration at 168 h.
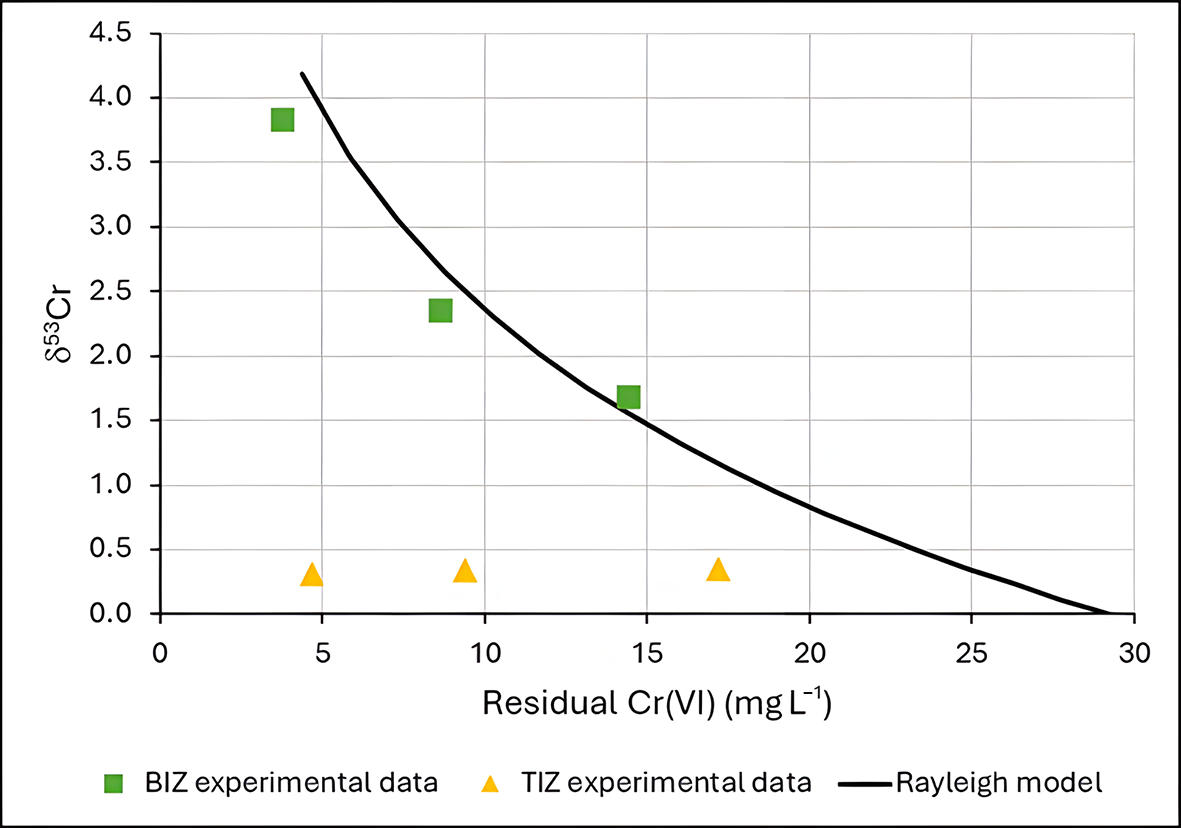
In general, Cr(VI) from both geogenic and anthropogenic sources is characterized by a δ53Cr of ∼0. Positive δ53Cr values are generally interpreted as a reduction of Cr(VI) to Cr(III). In the TIZ experiments the δ53Cr remains quite constant, indicating that no significant Cr(VI) reduction occurred. In contrast, the positive δ53Cr values obtained for the BIZ experiments provide evidence of Cr(VI) reduction. Furthermore, the correspondence of the experimental δ53Cr data and Ct is well fitted by a Rayleigh equation model (Fig. 3), indicating a fractionation factor (α) of 0.9978. This value is consistent with the isotopic fractionation expected for abiotic Cr(VI) reduction by Fe(II) (Kitchen et al., Reference Kitchen, Johnson, Bullen, Zhu and Raddatz2012; Li et al., Reference Li, Huang, Li, Tang, Liu and Hughes2022).
Rayleigh isotopic fractionation model and δ53Cr experimental data for BIZ and TIZ.

Thus, BIZ acts as a reactive medium for chromium reduction, with Fe(II) serving as the primary reducing agent. Similar conclusions have been proposed by Lv et al. (Reference Lv, Li, Jiang, Ackley, Fenske and Demarco2014), who related the extent of Cr(VI) removal to the amount of Fe(II) exchanged onto the zeolite grains. However, those interpretations were based on indirect correlations. In contrast, the present study provides direct evidence of the reduction mechanism through chromium isotope analysis, which confirms that Cr(VI) removal by BIZ involves a redox transformation.
Adsorption isotherms
Experimental data from synthetic solution batch tests with TIZ are better modelled by a Freundlich isotherm, with a coefficient of determination (R 2) of 0.98, while with a Langmuir isotherm R 2 is only 0.82 (Fig. 4). Therefore, TIZ probably behaves as a multilayer adsorbent of Cr(VI), and the sorption is probably heterogeneous on its surface. The Freundlich isotherm parameters obtained by fitting are KF = 0.61 and 1/n = 0.22.
Experimental data from TIZ and Langmuir and Freundlich isotherm models.

These results are in accord with Du et al. (Reference Du, Li, Liao, Hanson, Leick, Hoeppner and Jiang2012), who also reported that the Freundlich model provided a better description of the adsorption behaviour than the Langmuir model, obtaining R 2 values of 0.94 and 0.71, respectively.
Batch test with real contaminated water
The results of the batch test for the real water sample from a contaminated site are reported in Table 5. The Cr(VI) removal efficiency for TIZ is dramatically lower compared to the results from the synthetic solution batch experiments. Conversely, BIZs achieve a Cr(VI) removal efficiency of ∼98.1% at 0.5 g, which is higher than any value obtained in the batch experiments.
Batch test results for the 168 h experiments with real water.

Table 5 Long description
The table reports chromium six concentration after 168 hours, total sorbed mass, removal rate, and sorption capacity for two zeolites, BIZ and TIZ, tested at 0.1 to 0.5 g. For BIZ, increasing zeolite dose steadily lowers Ct from 1.46 to 0.04 milligrams per liter and raises removal from 31.78 to 98.13 percent. BIZ sorbed mass increases from 0.07 to 0.21 milligrams, while capacity declines from 0.68 to 0.42 milligrams per gram as dose increases. For TIZ, Ct changes only slightly from 2.06 to 1.92 milligrams per liter and removal remains low, rising from 3.74 to 10.28 percent. TIZ sorbed mass stays near 0.01 to 0.02 milligrams and capacity remains about 0.08 down to 0.04 milligrams per gram. Across all doses, BIZ consistently achieves much higher removal and lower final concentration than TIZ. Capacity values should be interpreted with dose effects in mind, since higher mass can reduce capacity per gram even when overall removal improves.
A = total Cr(VI) sorption; Ct = Cr(VI) concentration at 168 h; Q = sorption capacity; R = removal rate.
The difference in the efficiency of TIZ could be related to the main mechanism involved in this process. TIZ acts as a direct adsorption substrate that, in the presence of competing ions for the adsorption sites, does not perform as expected due to a stronger affinity for other anions. Suhartana et al. (Reference Suhartana and Azmiyawati2018) have demonstrated that Fe(III)-modified zeolite also directly adsorbs chloride and carbonate ions onto its surface. In addition, the main mechanism of BIZ is the reduction of Cr(VI) to Cr(III) catalysed by Fe(II) ions, which appears not to be affected by the presence of other ions in the solution.
The adsorption capacity values for TIZ obtained in this experiment are comparable to those reported by Du et al. (Reference Du, Li, Liao, Hanson, Leick, Hoeppner and Jiang2012) for Fe(III)-modified zeolite, who observed Q values ranging from 0.01 to 0.06 mg g–1 under high-ionic-strength conditions.
Influence of pH and EC
The effects of pH and EC in the batch experiments were examined with additional specific tests. A synthetic solution made with demineralized water and an initial Cr(VI) concentration of 18.5 mg L–1 was used, at pH 2.5–9.0. The results are reported in Table 6. BIZ shows more constant behaviour and consistently outperforms TIZ under all tested conditions. Both materials exhibit optimal removal under mildly acidic conditions (pH 5.0–6.5). TIZ shows a moderate decrease in efficiency under strongly acidic conditions and a pronounced decrease in efficiency under alkaline conditions, whereas BIZ is mainly affected only under alkaline conditions. These results demonstrate that pH has an effect on the efficiency of BIZ and TIZ for Cr(VI) removal but cannot explain the significant reduction in the performance of TIZ in the real-water batch test.
Batch test results from the synthetic solution with varying pH values.

Table 6 Long description
The table reports chromium six removal after 168 hours at six pH values for two materials, BIZ and TIZ, listing remaining concentration, total sorbed mass, removal percent, and sorption capacity. BIZ performs consistently better than TIZ at every pH, with lower remaining concentrations and higher removal, sorbed mass, and capacity. For BIZ, remaining concentration stays near 7.1 to 7.3 milligrams per liter from pH 2.5 to 6.5, then rises to 8.0 at pH 7.2 and 8.3 at pH 9.0; removal declines from about 61 percent at pH 2.5 to 5.2 to about 55 percent at pH 9.0. BIZ reaches its best results around pH 5.2, with about 1.14 milligrams sorbed, about 61.6 percent removal, and capacity about 1.14 milligrams per gram. TIZ shows a modest improvement from acidic to near neutral conditions, with remaining concentration decreasing from 12.3 at pH 2.5 to 11.4 at pH 6.5 and removal increasing from about 33.5 percent to about 38.4 percent, then performance worsens at higher pH, reaching 13.2 and about 28.6 percent removal at pH 9.0. The highest TIZ removal occurs at pH 6.5, with about 0.71 milligrams sorbed and capacity about 0.71 milligrams per gram. Values are specific to the stated contact time and test conditions, so differences across pH reflect these batch results rather than a universal ranking for other durations or concentrations.
A = total Cr(VI) sorption; Ct = Cr(VI) concentration at 168 h; Q = sorption capacity; R = removal rate.
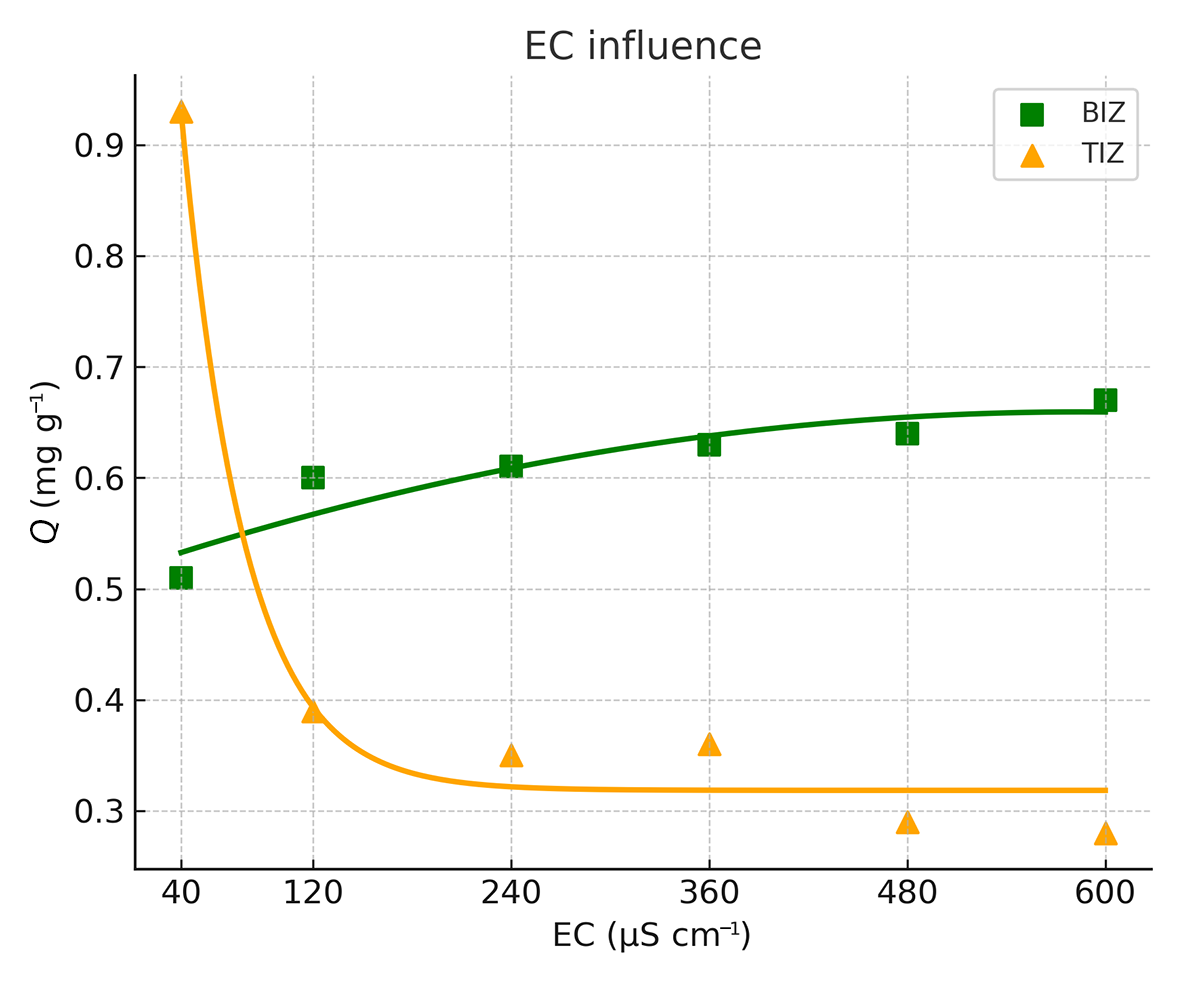
The batch test results from a 24 h experiment, carried out under different EC conditions (pH = 6.7; initial Cr(VI) concentration = 18.5 mg L–1), are summarized in Table 7 and illustrated in Fig. 5. TIZ performs very well when Cr(VI) is the only anion present in the solution (pure demineralized water with added Cr(VI) reagent; EC = 40 µS cm–1). However, when competing ions are present, its performance decreases rapidly. This indicates that TIZ has a stronger affinity for other major anions, which severely limits its effectiveness in complex water matrices.
Adsorption capacity (Q) of BIZ and TIZ in batch tests as a function of EC.

Batch test results from the synthetic solution with varying EC values.

Table 7 Long description
The table reports 24 hour Cr(VI) concentration remaining, total sorbed mass, removal percentage, and sorption capacity for two materials, BIZ and TIZ, across electrical conductivity from 40 to 600 microSiemens per centimeter. At 40, TIZ performs best, with Ct 8.7 milligrams per liter, A 0.98 milligrams, R 53.0 percent, and Q 0.98 milligrams per gram, compared with BIZ Ct 12.9, A 0.56, R 30.3 percent, and Q 0.56. As conductivity increases, BIZ shows a consistent improvement: Ct decreases from 12.9 to 11.8, while A and Q rise from 0.56 to 0.67 and removal increases from 30.3 to 36.2 percent. In contrast, TIZ performance declines after 40: Ct increases to about 14.6 to 15.7, A and Q drop from 0.98 to 0.28 to 0.39, and removal falls from 53.0 percent to about 15.1 to 21.1 percent. From 120 through 600, BIZ has higher removal and sorption capacity than TIZ at every conductivity level. Values are specific to the 24 hour endpoint and do not indicate earlier or longer term behavior.
A = total Cr(VI) sorption; Ct = Cr(VI) concentration at 24 h; Q = sorption capacity; R = removal rate.
However, BIZ exhibits the opposite trend, with its performance increasing as salinity increases. The main hypothesis to explain this behaviour is that a higher concentration of cations in solution improves the cation-exchange process. As more exchangeable cations become available, Fe2+ ions at extra-framework zeolite sites can be readily released, acting as reducing agents to convert Cr(VI) to Cr(III). In conditions with low cation availability, Fe2+ ions are also required to balance the negative charge of the zeolite framework, limiting their availability for redox reactions.
These results are consistent with those of Lv et al. (Reference Lv, Li, Jiang, Ackley, Fenske and Demarco2014), who studied Fe(II)-modified NZ and observed a ∼20% increase in Cr(VI) sorption as the ionic strength increased from 0.0001 mol L–1 of NaCl to 0.1 mol L–1 of NaCl in the contaminated solution.
Column tests
The column setup operated in a closed-loop configuration, meaning that the effluent from the column was recirculated back into the influent reservoir. At a flow rate of 0.3 L h–1, the 1 L solution passed through the column containing 1 g of modified zeolite approximately seven times during the experiment.
The results of the column experiments for the synthetic solution with an initial concentration of Cr(VI) of 2.26 mg L–1 are reported in Table 8, while the results of the column experiments with real water with an initial concentration of Cr(VI) of 2.14 mg L–1 are listed in Table 9.
TIZ and BIZ results from the column tests of the synthetic solution.

Table 8 Long description
The table reports column-test results over time for two materials, BIZ and TIZ, using Cr(VI) concentration at each time point, total amount sorbed, removal rate, and sorption capacity. From 3 to 24 hours, both materials show decreasing Cr(VI) concentration and increasing sorbed amount, removal rate, and capacity. TIZ consistently outperforms BIZ at every time point: at 3 hours TIZ has Ct 1.72 mg per liter and 23.89 percent removal versus BIZ Ct 1.92 mg per liter and 15.04 percent removal. By 12 hours, TIZ reaches 47.35 percent removal and 1.07 mg sorbed, while BIZ reaches 26.99 percent removal and 0.61 mg sorbed. At 24 hours, TIZ ends at Ct 1.17 mg per liter with 1.09 mg sorbed, 48.23 percent removal, and capacity 1.09 mg per gram; BIZ ends at Ct 1.60 mg per liter with 0.66 mg sorbed, 29.20 percent removal, and capacity 0.66 mg per gram. The largest gains occur early, with smaller improvements from 12 to 24 hours, suggesting performance is approaching a plateau under these test conditions. Interpretation should be limited to these specific column-test settings and time points, since starting concentration, flow conditions, and media mass are not provided here.
A = total Cr(VI) sorption; Ct = Cr(VI) concentration at time t; Q = sorption capacity; R = removal rate.
TIZ and BIZ results from the column tests of real water.

Table 9 Long description
The table reports chromium six concentration remaining in water over time and the associated sorbed amount, removal rate, and sorption capacity for two materials, BIZ and TIZ, measured at 3, 6, 9, 12, and 24 hours. For BIZ, the remaining concentration drops from 1.99 mg per liter at 3 hours to 1.41 mg per liter at 24 hours, while removal rises from 7.01 percent to 34.11 percent. BIZ sorbed amount increases from 0.15 mg to 0.73 mg, and capacity increases from 0.15 to 0.73 mg per g over the same period. For TIZ, the remaining concentration stays nearly constant around 2.08 to 2.12 mg per liter across all times. TIZ removal remains low, ranging from 0.93 percent at 3 hours to a maximum of 2.80 percent at 9 and 24 hours, with sorbed amount and capacity staying between 0.02 and 0.06. Overall, BIZ shows a clear time dependent improvement in removal and capacity, whereas TIZ shows minimal change and much lower performance. Interpretation should consider that results are limited to the tested conditions and time points shown.
A = total Cr(VI) sorption; Ct = Cr(VI) concentration at time t; Q = sorption capacity; R = removal rate.
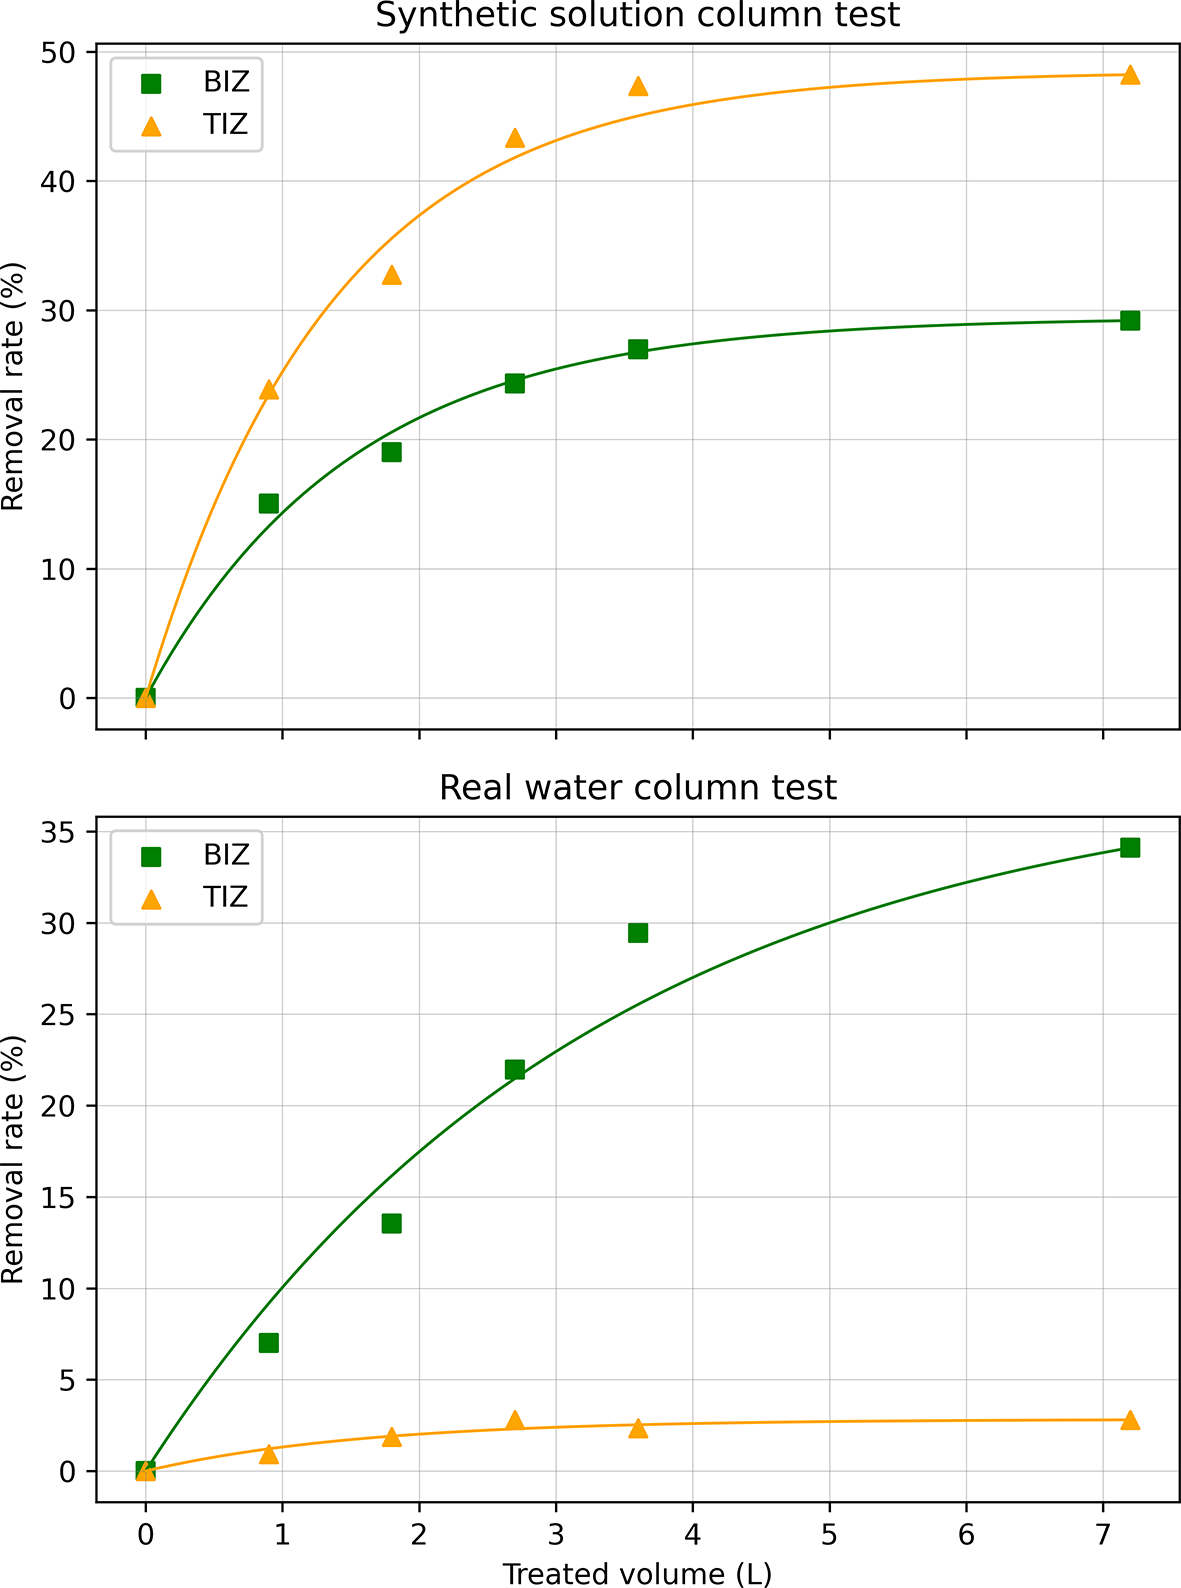
The column tests performed with a lower concentration of Cr(VI) using a synthetic solution, without other major anions, showed that TIZ has a higher adsorption capacity (Q = 1.09 mg g–1) and a faster kinetic removal rate compared to BIZ (Q = 0.66 mg g–1). However, in line with the batch tests, TIZ’s performance changes dramatically when the column tests are performed with real water. When applied to a complex real water with high salinity, TIZ removes only 2.80% of the initial Cr(VI) content (Q = 0.06 mg g–1), while BIZ is more efficient, achieving ∼34.11% Cr(VI) removal (Q = 0.73 mg g–1). These results corroborate previous experiments, demonstrating that the adsorption capacity of BIZ is higher with real water than with the synthetic solution. Figure 6 demonstrates the removal rate from each experiment as a function of the treated volume.
Removal efficiency (%) of Cr(VI) in bulk solution as a function of treated volume (L) during the column experiments. Top: synthetic Cr(VI) solution; bottom: real contaminated water.

Figure 6 Long description
The image A showing a line graph titled Synthetic solution column test. The horizontal axis label is Treated volume (L). The horizontal axis range is 0 to 7. The vertical axis label is Removal rate (%). The vertical axis range is 0 to 50. Two plotted series are shown with markers and smooth curves. One series has square markers and the other series has triangle markers. Square-marker points: (0, 0), (1, 15), (2, 20), (3, 25), (4, 27), (7, 30). Triangle-marker points: (0, 0), (1, 20), (2, 33), (3, 43), (4, 46), (7, 48). The image B showing a line graph titled Real water column test. The horizontal axis label is Treated volume (L). The horizontal axis range is 0 to 7. The vertical axis label is Removal rate (%). The vertical axis range is 0 to 35. Two plotted series are shown with markers and smooth curves. One series has square markers and the other series has triangle markers. Square-marker points: (0, 0), (1, 7), (2, 13), (3, 22), (4, 30), (7, 34). Triangle-marker points: (0, 0), (1, 1), (2, 2), (3, 2.5), (4, 2.8), (7, 3).
XRPD analysis
The XRPD traces of NZ, BIZ and TIZ essentially overlap, indicating that the samples are made up of the same mineral phases with essentially the same abundances (Fig. 7). The predominant mineral phase is clinoptilolite/heulandite, constituting ∼75 wt.% of the bulk sample. Minor phases are albitic plagioclase (∼15 wt.%), orthoclase (5 wt.%), muscovite and quartz (5 wt.% total).
(Top left) XRPD trace from the NZ sample; (top right) XRPD trace from the BIZ sample; (bottom left) XRPD trace from the TIZ sample; (bottom right) XRPD traces from NZ, BIZ and TIZ superimposed and normalized. A = albitic plagioclase; C = clinoptilolite; H = heulandite; M = muscovite; O = orthoclase Q = quartz.

Figure 7 Long description
The top left plot shows an X-ray powder diffraction trace for the NZ sample. The y-axis is labeled Counts, representing intensity in arbitrary units, ranging from 0 to 40000. The x-axis is labeled two theta in degrees, ranging from 0 to 35. Peaks are marked with letters: M, H, C, A, O and Q, indicating mineral phases. The top right plot shows the BIZ sample with similar axis labels and ranges. The bottom left plot shows the TIZ sample, also with similar axis labels and ranges. Each plot displays prominent peaks near two theta 10 and 20 degrees, with smaller peaks throughout. The bottom right plot overlays traces from NZ, BIZ and TIZ samples, showing close alignment of peaks, indicating similar phase composition. The legend identifies NZ, TIZ and BIZ traces. The consistent peak patterns across all samples suggest they share the same mineral phases, primarily clinoptilolite and heulandite, with minor phases of albitic plagioclase, orthoclase, muscovite and quartz.
BET analysis and nitrogen adsorption–desorption isotherms
The results for specific surface area and porosity are summarized in Table 10. The observed difference in BET specific surface area is mainly attributed to variations in the micropore area, which are also reflected in differences in micropore volume, while the external surface area is similar for both materials. This difference is attributed to the precipitation of iron(III) phases and other salts during the TIZ modification process previously discussed. These precipitates are not only visible on the external surface but also appear to partially occupy mesopores, fractures and structural defects within the material, contributing to the reduction of micropore area and volume (see Supplementary Material).
Results from the BET analysis.

Table 10 Long description
The table reports BET specific surface area, external surface area, micropore area, and micropore volume for two samples, BIZ and TIZ. BIZ has a higher BET specific surface area at 42.92 square meters per gram compared with 28.84 for TIZ. External surface area is similar between samples, with BIZ at 27.94 and TIZ at 26.13 square meters per gram. The main difference is in microporosity: BIZ has a micropore area of 14.97 square meters per gram versus 2.71 for TIZ. Micropore volume follows the same pattern, with BIZ at 0.006356 cubic centimeters per gram and TIZ at 0.000917. These results suggest BIZ contains substantially more microporous surface and pore volume, while both samples have comparable external surface area. Interpretation should consider that BET and micropore metrics depend on measurement conditions and analysis assumptions, which are not provided here.
Nitrogen adsorption–desorption isotherms are reported in Fig. 8. According to the Brunauer–Deming–Deming–Teller (BDDT) classification, both isotherms correspond to type IV behaviour, exhibiting a clear H4-type hysteresis loop in the desorption branch.
Nitrogen adsorption–desorption isotherms from (a) BIZ and (b) TIZ. STP = standard temperature and pressure.

XRF spectroscopy
XRF spectroscopy confirms the results obtained by the adsorption experiments (Table 11). The iron weight percentage increased in both BIZ (5.18 wt.%) and TIZ (4.28 wt.%) compared to NZ (1.08 wt.%). In the case of BIZ, a significant increase in sulfur and a decrease in potassium support the occurrence of reagent impregnation and cation exchange, respectively. For TIZ, chloride is present in the initial product. However, most chlorine was probably dissolved during the batch test, as indicated by a substantial decrease in chorine following the batch experiment. Both BIZ and TIZ, when saturated with Cr, show up to a 10-fold increase in Cr content compared to their initial concentrations.
XRF spectroscopy results (wt.%) of the materials used in the experiments.

Table 11 Long description
The table reports XRF elemental composition in weight percent for five materials: NZ, BIZ, BIZ after batch test, TIZ, and TIZ after batch test, across Al, Ca, Cl, Cr, Fe, K, Mg, S, and Si. Silicon is the dominant element in every sample, ranging from 26.0101 wt.% in TIZ to 29.3408 wt.% in NZ. Aluminum is fairly consistent near 5.7841 to 6.4680 wt.% across all materials. Chlorine differs strongly by sample and treatment: TIZ starts high at 4.2430 wt.% and drops to 0.4143 wt.% after the batch test, while BIZ rises from 0.0771 wt.% to 0.1962 wt.% after the batch test. Iron is low in NZ at 1.0840 wt.% but higher in BIZ and TIZ, with BIZ decreasing from 5.1777 wt.% to 4.0912 wt.% after the batch test and TIZ decreasing from 4.2789 wt.% to 3.9455 wt.% after the batch test. Magnesium and sulfur increase after the batch test for BIZ, from 1.6494 to 2.5593 wt.% for Mg and from 1.7610 to 2.0683 wt.% for S, and also increase for TIZ, from 1.9364 to 2.3978 wt.% for Mg and from 0.3951 to 0.5479 wt.% for S. Potassium increases after the batch test in both BIZ and TIZ, while calcium changes modestly, staying near about 2.1 to 2.9 wt.% across samples. These values reflect bulk composition by XRF and do not indicate chemical form or how elements are bound in the materials.
SEM macrostructural analysis and TEM microstructural analysis
Natural zeolite
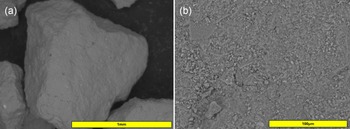
The NZ grains exhibit a polyhedral morphology, deviating significantly from a spherical geometry. Each face is characterized by an undulated topology, marked by continuous micro-scale elevations and depressions (Fig. 9a). At a higher magnification, the grain surfaces are highly irregular, with a variety of micro-grains attached to a more coherent solid matrix (Fig. 9b).
(a) NZ grain sample under SEM with a back-scattered electron (BSE) detector (100×). (b) NZ external surface details at 800× amplification (BSE detector).

Cross-section SEM images of grains embedded in resin reveal the internal structure of the material. Morphologically, the internal features broadly mirror the external surface, although with variable degrees of structural coherence. Certain domains appear relatively compact and homogeneous, while others display a granular texture, with visible macroporosity. Both zeolite domains appear chemically homogeneous under EDS analysis, with a chemistry that is broadly consistent with typical clinoptilolite–heulandite. However, grains of other mineral phases are heterogeneously distributed within the clinoptilolite grain, and especially in granular domains (Fig. 10a). At higher magnifications, the host phases show a broad size distribution, often being below 1 µm in size (Fig. 10b). EDS analyses suggest that most of the largest secondary grains are plagioclase or orthoclase.
(a) Resin-embedded NZ sample showing its internal structure. (b) 2500× magnification of the clinoptilolite matrix, highlighting its heterogeneity in density and coherence. An elongated plagioclase grain is visible on the left side of the image, with lighter contrast.

Bivalent iron zeolite
Morphologically, the BIZ grains do not differ significantly from their NZ counterparts (Fig. 11). However, their chemical composition shows notable differences. Iron and sulfur are present in high concentrations, indicating an excess of the modifying reagent FeSO4·7H2O. The method proposed by Liu et al. (Reference Liu, Li, Tan and Zhu2010) was not intended to produce a coating on the zeolite surface; however, at the applied reagent concentrations, impregnation of the reagent occurs, forming a surface layer that imparts the green colouration observed.
(a) BIZ grain under SEM. (b) 2000× magnification of BIZ’s external surface.

Nevertheless, the objective of increasing the Fe2+ content through cation exchange appears to have been successfully achieved. Within the grains, EDS analysis revealed no significant sulfur signal, while the iron concentration increased markedly compared to the atomic percentage in NZ, increasing from an average of 1.0 wt.% to values higher than 3.0 wt.%. This increase was accompanied by a pronounced decrease in the concentrations of other major cations, including Ca, Mg, K and Na.
This enrichment is characterized by a highly homogeneous spatial distribution in the internal structure of the entire zeolite. Figure 12 illustrates the spatial correlation between iron and other elements in zeolite fragments analysed by EDS in TEM, confirming that iron is uniformly incorporated into the structure and proving that effective cation exchange occurred.
TEM EDS maps from BIZ micro-grains. Top left = scanning TEM image; top left = silicon image; bottom left = calcium image; bottom right = iron image.

BIZ after batch tests
No visible evidence for the precipitation of a stable Cr(III) phase was observed by SEM or TEM. Nevertheless, XRF spectroscopy analysis revealed a significant increase in chromium content after the batch experiments. Unlike TIZ, chromium precipitates are not concentrated on the surface of BIZ grains. Given the widespread distribution of iron throughout the grains, it is reasonable to assume that the Cr-bearing phases are nanoparticles that are also dispersed within the grain structure. This broad distribution complicates the distinction between true chromium signals and background noise near the detection limits of the analytical method.
Trivalent iron zeolite
The external appearance of TIZ differs significantly from that of NZ. The modification affected not only its chemical composition but also its morphology. The new grains have significantly smoother edges and corners, and the overall grain shape is more rounded than polyhedral (Fig. 13a). At a higher magnification, it is possible to identify various phases covering the surface (Fig. 13b). Bright spots of fine iron oxide particles are frequently dispersed across the surface and vary in size (up to 10 µm). NaCl has also precipitated and is widely distributed throughout the sample.
(a) TIZ grain under SEM. (b) 4000× magnification of TIZ’s external surface. Small, bright particles are representative of iron oxide/hydroxide phases.

EDS analysis indicates that the external surface of TIZ grains is highly heterogeneous. The iron distribution varies considerably, and notable increases in chloride and sodium are also observed. No significant chromium concentrations were detected within the grains or in association with the iron phases. In contrast, the internal matrix of TIZ shows no substantial alteration relative to NZ, except in larger fractions connected to the external surface, confirming that the chemical modification is largely confined to the grain exterior.
EDS maps of the micro-grains also show a heterogeneous spatial distribution of iron at the nanoscale. Figure 14 illustrates the spatial distribution of elements in the microstructure of TIZ. In contrast to BIZ, iron in TIZ tends to concentrate in specific areas around the main grain.
TEM EDS maps from TIZ micro-grains. Top left = scanning TEM image; top right = silicon image; bottom left = calcium image; bottom right = iron image.

TIZ after batch tests
Samples of TIZ, after Cr(VI) adsorption, were carefully analysed. Chromium was not detected except in association with iron oxides/hydroxides on the TIZ surface. EDS analysis of the bright particles revealed an average of 53.24 at.% iron and 7.40 at.% chromium. The EDS elemental maps clearly show a strong spatial correlation between these two elements (Fig. 15). The size of the iron oxide/hydroxide crystals varies significantly. Microcrystals up to 10 µm are observable in the SEM images, while nanocrystals were identified through TEM images. These nanocrystals appear to exhibit greater chromium concentrations (up to 18.3 at.%) compared to the larger microcrystals.
TIZ after Cr(VI) adsorption. (Top left) SEM image with a back-scattered electron detector of the grain surface. (Top right) Silicon EDS map in red. (Bottom left) Tron EDS map in blue. (Bottom right) Chromium EDS map in green.

Conclusion
NZs are generally considered unsuitable for anion adsorption; however, chemical modification can substantially improve their performance with regards to removing contaminants such as Cr(VI). In this study, two different iron-modified zeolites – BIZ and TIZ – were comparatively evaluated to assess how various modification strategies influence chromium removal mechanisms and efficiency.
The Fe(II)-enrichment procedure used to produce BIZ proved effective at introducing iron to extra-framework zeolite sites through cation exchange, resulting in a homogeneous distribution of Fe(II) throughout the grains. However, some methodological adjustments are recommended to prevent excess reagents from impregnating the external surfaces of the grains. BIZ exhibits a higher adsorption capacity (Q), which increases in the presence of other cations and is optimal under mildly acidic conditions. This improved performance is probably linked to its mechanism of reducing Cr(VI) to Cr(III), as confirmed by the isotopic analysis. However, this reduction process in BIZ necessitates a longer contact time because it exhibits slower kinetics. This feature reduces its efficiency in column experiments with synthetic solutions.
In contrast, TIZ modification successfully generated iron oxide/hydroxide phases on the external surfaces of the zeolite grains, which acted as adsorption sites for chromate species. This material exhibits rapid Cr(VI) uptake and reaches adsorption equilibrium within shorter contact times. Following Cr(VI) adsorption, the direct spatial correlation between iron and chromium observed in the EDS maps strongly suggests that direct adsorption is the primary mechanism for removing the target contaminant. Adsorption is best described by the Freundlich isotherm, indicating heterogeneous multilayer sorption on Fe(III) surface phases. Nevertheless, a significant drawback of this material is its high sensitivity to competing anions, which severely limits its applicability in complex water matrices and reduces its effectiveness in the presence of multiple contaminants.
These differing characteristics observed between both modified zeolites do not designate one as inherently superior or inferior to the other; rather, they represent crucial aspects for considering their applicability in diverse scenarios. For instance, when addressing circumstances necessitating the rapid removal of Cr(VI), as can be encountered in industrial filtration systems, with limited contact times between pollutants and zeolites, TIZ emerges as the prime choice due to its rapid adsorption kinetics and efficiency over shorter exposure periods, so long as other competitor anions are not significantly present. Conversely, in contexts where the aim is to achieve a higher adsorption capacity and time constraints are not critical, such as remediating contaminated aquifers with permeable adsorption barriers, BIZ appears to be a more suitable candidate.
Competing interests
The authors declare none.