

I. INTRODUCTION
Pb(Mg1/3Nb2/3)O3–PbTiO3 (PMN–PT) and Pb(In1/2Nb1/2)O3–Pb(Mg1/3Nb2/3)O3–PbTiO3 (PIN–PMN–PT) crystals have been widely investigated because of their excellent electromechanical and piezoelectric properties.Reference Park and Shrout1–Reference Zhang, Randall and Shrout3 The higher temperature stability of the PIN–PMN–PT crystal makes it become an alternative to PMN–PT crystals.Reference Chen, Lam, Zhou, Yue, Yu, Wu, Qiu, Sun, Zhang and Luo4–Reference Lin, Li, Zhang, Xu and Yao6 In many applications, piezoelectric materials must be implemented under direct current (DC) bias to avoid depolarization. The working temperature is often restricted by a ferroelectric phase transition, which is usually affected by a DC bias. The working temperature of PIN–PMN–PT crystals under DC bias is about 30 °C higher than that of binary counterpart.Reference Zhang, Luo, Hackenberger and Shrout7 Hence, there is an urgent need to do research on the DC bias dependent phase transition characteristics of PIN–PMN–PT crystals.
The DC bias dependent phase transition behavior of PMN–PT single crystals has been systematically investigated.Reference Li, Xu, Yao and Cheng8–Reference Tu, Chien, Wang, Schmidt and Han11 The phase transition has close relationship with temperature, DC bias, chemical composition, and polarization state of single crystals. Intermediate phase stability is not only dependent on the direction but also on the strength of the DC bias. In the heating process (HP), the intermediate phases, such as M and O phases, will be induced by a DC bias applied on [011]- and [001]-oriented PMN–PT crystals with a composition near morphotropic phase boundary. However, these intermediate phases cannot be found in the [111]-oriented crystals under DC bias.Reference Li, Xu, Yao and Cheng8 As more ions occupy the B site (partial Mg2+ substituted by In3+), the phase transition characteristics of the PIN–PMN–PT crystal are more complicated.Reference Hyun Kim, Kojima and Ko12–Reference Schader, Rossetti, Luo and Webber17 Luo et al.Reference Luo, Wang, Wang, Ge, Li, Luo and Viehland13 found a C → T → MC phase transition sequence under DC bias during the cooling process in the [001]-oriented PIN–PMN–PT crystals. During the phase transition process, not only the C and T phases but also the T and MC phases were found to coexist. The O → T → C phase transition sequence was found by He et al.Reference He, Li, Luo, Zhang and Yan15 in 0.19PIN–0.45PMN–0.36PT single crystals during the HP. Diffuse phase transition characteristics of the [001]-oriented PIN–PMN–PT crystals (R phase) in unpoled and poled states were investigated by Kim et al.Reference Hyun Kim, Kojima and Ko12 The O → T → C phase transition sequence was found in [001]-oriented 0.19PIN–0.45PMN–0.36PT single crystals during the HP.Reference He, Li, Luo, Zhang and Yan15 The phase transition sequence of R → MA → T → C was found in the 0.25PIN–0.42PMN–0.33PT crystal with a DC bias applied along [001] direction in the HP.Reference Wang, Wang, Ge, Luo, Li, Viehland, Chen and Luo18
Although phase transition characteristics of the PIN–PMN–PT crystal have been investigated, the orientation dependent phase transition was not studied systematically. The phase transition behavior under DC bias has a close relationship with the direction of the bias field. The dielectric properties and phase transition characteristics of 0.24PIN–0.43PMN–0.33PT crystals with a DC bias applied along the [111] direction during the HP were studied by the current authors.Reference Wan, Li, Ma, Li, Xu, Fan and Yao14 It was found that the micro–macro domain transition temperature of the [111]-oriented 0.24PIN–0.43PMN–0.33PT crystals decreases with increasing bias field strength. A R → O → T → C phase transition sequence was found under the applied DC bias during the HP. The transition temperatures of the R to O phase and O to T phase will be affected by bias field strength, and therefore, the temperature range where the stable O phase exists can be influenced by a DC bias. Thus, it is significant to investigate orientation and DC bias dependence of the phase transition characteristics of PIN–PMN–PT crystals. In this paper, the dielectric permittivity and loss of [011]- and [001]-oriented 0.24PIN–0.43PMN–0.33PT crystals under a bias field are investigated over a broad temperature range from −100 to 250 °C. The dielectric and phase transition characteristics are also compared with the [111]-oriented 0.24PIN–0.43PMN–0.33PT crystals. The orientation and DC bias dependent phase transition characteristics of 0.24PIN–0.43PMN–0.33PT crystals are obtained, which is beneficial to better understand the phase transition characteristics of the ternary PIN–PMN–PT single crystal.
II. EXPERIMENTAL PROCEDURE
The PIN–PMN–PT crystal with nominal composition 0.25PIN–0.44PMN–0.31PT was grown along [011] direction through the modified vertical Bridgman method.Reference Wang, Xu, Li and Chen19 Reagent grade PbO, MgO, In2O3, Nb2O5, and TiO2 powders were used as raw materials. The single crystals were grown in platinum crucibles. The highest temperature during growth was 1400 °C in the furnace. The temperature gradient was about 30–50 °C/cm in the solid–liquid interface. After soaking about 24 h, the crucible was pulled down at the rate of 0.3–0.5 mm/h. After finishing the growth process, the furnace was cooled at a rate of 100 oC/h. The specimens used in the dielectric measurement were selected from the middle of the crystal boule, and their chemical composition was determined to be 0.24PIN–0.43PMN–0.33PT by electron probe micro-analysis.Reference Wan, Li, Chen, Li, Xu, Fan and Yao20 The specimens were oriented along [001] and [011] direction, respectively, through the three-dimensional rotation orientation method.Reference Li, Jin, Xu and Guo21 The specimen size was 5.0 × 5.0 × 0.5 mm2 with 5.0 × 5.0 mm2 plane perpendicular to [011] and [001] directions, respectively. Silver paste was coated on the large face (5.0 × 5.0 mm2) of the specimen and fired at 600 °C for 20 min before measuring dielectric properties. The dielectric permittivity and loss were measured by using a LCR meter (HP 4284A, Hewlett- Packard Co., Cupertino, California), which was connected with a temperature chamber (Delta 9023, Delta Design Inc., San Diego, California) and a bias voltage power source (PS350/5000V-25W). The dielectric property measurements were performed in the HP, where a constant DC bias was applied on the samples. The specimens were annealed at 400 °C for 2 h before dielectric measurement.
III. RESULTS AND DISCUSSION
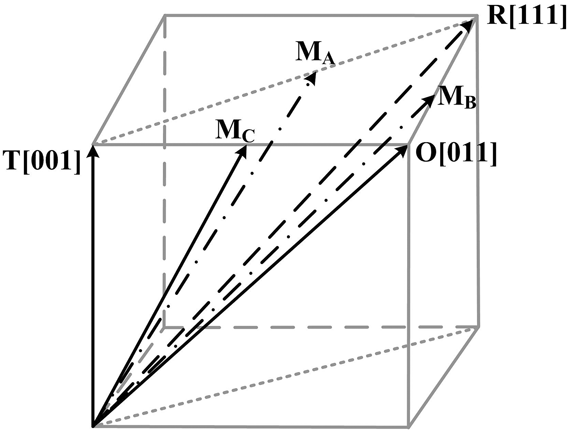
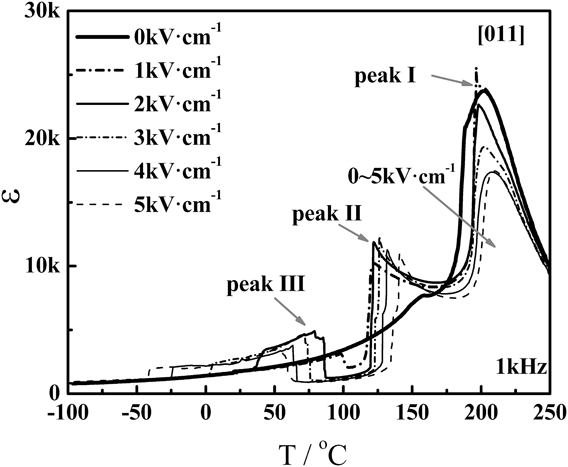
Dielectric permittivity (ε, 0.1–100 kHz) and loss (tan δ, 1 kHz) of 0.24PIN–0.43PMN–0.33PT crystal with DC bias (0–5 kV/cm) applied along [011] direction are shown in Figs. 1(a)–1(f). Before applying the bias field, three dielectric anomalies marked as peak II, peak A, and peak I are found around 155 °C, 188 °C, and 200 °C, respectively, as shown in Fig. 1(a). These peaks correspond to R → T, T → C phase transition and ferroelectric relaxor process, respectively.Reference Li, Xu, Yao and Cheng8 The phase transition sequence under zero DC bias is R → T → C during the HP. When the DC bias strength increases up to 1 kV/cm, peak II is divided into two peaks: peak III and peak II, as shown in Fig. 1(b). Peak III shifts in the direction of lower temperature and peak II shifts in the opposite direction with further increase of DC bias. Between the two peaks, the dielectric permittivity evidently drops to about 1200. Generally, the dielectric permittivity along the direction of spontaneous polarization is confirmed to be the smallest in all crystallographic directions. As the spontaneous polarization direction of the O phase is along the [011] direction, the dielectric permittivity of the O phase should be the smallest along the [011] direction. Therefore, it can be inferred that the O phase may be induced between peak III and peak II. As the DC bias strength further increases to 2 kV/cm, the dielectric permittivity shoulders and the loss double peaks corresponding to peak III and peak II are found in Fig. 1(c). For the 0.70PMN–0.30PT crystal with DC bias applied along the [011] direction during the HP, the intermediate monoclinic phase MB was found in the R → O phase transition.Reference Viehland and Li22 From the directions of spontaneous polarization Ps of R, M, O, and T phase shown in Fig. 2, the transition sequences of R → MB → O and O → MC → T, which corresponds to peak III and peak II, respectively, can be inferred. Thus, the transition sequence of R → MB → O → MC → T → C for the PIN–PMN–0.33PT crystal with DC bias applied along the [011] direction during the HP was determined. Another dielectric abnormality, which was considered to be related to the micro–macro domain transition, can be found around 33 °C (marked as Tf). The dielectric and frequency dispersion characteristics near Tf differ significantly from those of the 0.24PIN–0.43PMN–0.33PT crystal with DC bias applied along the [111] direction.Reference Wan, Li, Ma, Li, Xu, Fan and Yao14 When the temperature is over Tf, the dielectric permittivity increases from ∼2100 to ∼3600. Meanwhile, the frequency dispersion degree of dielectric permittivity decreases. However, for the [111]-oriented 0.24PIN–0.43PMN–0.33PT crystal, as the temperature rises above Tf, the dielectric permittivity suddenly decreases and the dielectric frequency dispersion disappears.Reference Wan, Li, Ma, Li, Xu, Fan and Yao14 As the DC bias further increases to 3 kV/cm, the Tf rapidly reduces to around 4 °C, as shown in Fig. 1(d). Moreover, it is found that the temperature range where the O phase stably exists is expanded to nearly 47 °C. As the DC bias continues to increase, the dielectric permittivity shoulder and loss double peaks, which correspond to peak III and peak II, respectively, still exist, as shown in Figs. 1(d)–1(f). Meanwhile, the micro–macro domain transition temperature Tf also shifts to lower temperature.
Temperature dependence of the dielectric permittivity at 0.1, 1, 10, and 100 kHz and loss at 1 kHz for the [011]-oriented 0.24PIN–0.43PMN–0.33PT single crystal during the HP under the different DC biases: (a) 0 kV/cm, (b) 1 kV/cm, (c) 2 kV/cm, (d) 3 kV/cm, (e) 4 kV/cm, and (f) 5 kV/cm.

Spontaneous polarization of R, M, O, and T phases of the PIN–PMN–PT crystal.

Peak I shown in Fig. 1 is related to the ferroelectric to paraelectric phase transition, which conforms to typical ferroelectric phenomenological theory. The weak dielectric frequency dispersion of peak I indicates the coexistence of ferroelectric relaxor process and T → C phase transition. The relaxor ferroelectric phase can be transformed to a normal ferroelectric phase with an applied DC bias.Reference Xi, Zhili and Cross23 Consequently, the ferroelectric relaxor process is depressed by the DC bias and the corresponding peak I becomes sharper, as shown in Figs. 1(b) and 1(c). However, as the DC bias increases over 3 kV/cm, peak I apparently changes. Peak I becomes less sharp and moves to a higher temperature. In addition, the value of εmax decreases, as shown in Figs. 1(d)–1(f). It can be concluded that the depressed εmax in the T → C phase transition process may be caused by high DC bias.
To clearly illustrate the temperature and bias field dependent phase transition characteristics of the [011]-oriented 0.24PIN–0.43PMN–0.33PT crystal, the dielectric permittivities (1 kHz) under different bias field strengths during the HP are plotted in Fig. 3. With the increase of the DC bias, the transition temperatures Tf,  ${{\rm{T}}_{{\rm{R}} - {{\rm{M}}_{\rm{B}}}}}$, and
 ${{\rm{T}}_{{{\rm{M}}_{\rm{B}}} - {\rm{O}}}}$ corresponding to micro to macro domain, R to MB phase and MB to O phase, respectively, all move to lower temperatures. However, the transition temperatures
 ${{\rm{T}}_{{\rm{O}} - {{\rm{M}}_{\rm{C}}}}}$,
 ${{\rm{T}}_{{{\rm{M}}_{\rm{C}}} - {\rm{T}}}}$, and TT–C corresponding to O to MC phase, MC to T phase, and T to C phase, respectively, all shift in the opposite direction. In the 0.24PIN–0.43PMN–0.33PT crystal oriented along the [011] direction, DC bias can induce a micro–macro domain transition and intermediate phase MC in the O → T phase transition process, and it is much more complex than the situation in a 0.68PMN–0.32PT crystal.Reference Li, Xu, Yao and Cheng8 In a 0.68PMN–0.32PT crystal oriented along the [011] direction, the dielectric permittivity shows a broad shoulder with a diffused transition characteristic of O to T phase. However, for the [011]-oriented 0.24PIN–0.43PMN–0.33PT crystal, the dielectric permittivity peak corresponding to a transition process of O to T phase is sharper. Moreover, a shoulder emerges several degrees below the O → T phase transition temperature. The polarization rotational path of the MC phase, plotted in Fig. 2, is confined in the (010) plane. Generally, the free energies of O, MC, and T phases are similar at the morphotropic phase boundary. Thus, in a broad temperature range, these ferroelectric phases can co-exist in the 0.24PIN–0.43PMN–0.33PT crystal, where the intermediate phase MC exists in the transition process of O to T phase. Therefore, the transition processes of O to MC phase and MC to T phase show diffused characteristics, which overlap in the 0.68PMN–0.32PT crystal with MPB composition.
Temperature dependent dielectric permittivity at 1 kHz for the [011]-oriented 0.24PIN–0.43PMN–0.33PT crystal under the different DC biases.

The dielectric characteristics of the 0.24PIN–0.43PMN–0.33PT crystal with an applied DC bias along the [001] direction and field strength from 0 kV/cm to 5 kV/cm during the HP are presented in Figs. 4(a)–4(f). Under zero DC bias, only one broad dielectric peak I appears near 200 °C in the measured temperature range, as shown in Fig. 4(a). The weak frequency dependent dielectric peak is corresponding to the transition process from T to C phase. At the same time, this peak is depressed by increasing frequency. With increasing DC bias to 1 kV/cm, another dielectric peak II, corresponding to R → T phase, appears near 110 °C. Peak I is found to be sharper, as shown in Fig. 4(b). When the bias field strength increases to 2 kV/cm, peak I shifts to higher temperature around 198 °C and peak II shifts to a lower temperature near 95 °C, as shown in Fig. 4(c). The temperature range between peak I and peak II is expanded due to the stability of the T phase strengthened by the DC bias. At a lower temperature near 43 °C, an obvious dielectric anomaly at Tf is found, which is similar to that of [011]-oriented counterpart. With increasing temperature over 43 °C, dielectric permittivity increases and its related frequency dispersion is weakened. The dielectric anomaly is obviously different from that along the [111]-oriented crystals counterpart, in which the dielectric permittivity drops suddenly, and at the same time, dielectric dispersion disappears.Reference Wan, Li, Ma, Li, Xu, Fan and Yao14 It is believed that the abnormality in the dielectric permittivity near Tf has a close relationship with the direction of the bias field. In the 0.23PIN–0.52PMN–0.25PT crystal, the similar dielectric properties near Tf are found.Reference Wan, Li, Ma, Li, Xu, Fan and Yao14 As the direction of the spontaneous polarization of polar micro regions is along the [111] direction,Reference Li, Xu, Yao and Cheng8 therefore, it can be deduced that the 0.24PIN–0.43PMN–0.33PT single crystal is in the microdomain state at lower temperature. The microdomain state will be transformed into macrodomain state under DC bias field. During the transformation process, the number of domain walls and the degree of dielectric dispersion change. With the further increase of the DC bias, peak I continuously shifts to higher temperature, while peak II and Tf move in the opposite direction, as shown in Figs. 4(d)–4(f). As the bias field strength rises up to 4 kV/cm, the frequency dispersion of dielectric properties is enhanced slightly with increasing temperature over Tf (∼ −10 °C). Peak I shifts to higher temperature around 210 °C when the bias field strength increases to 5 kV/cm, while the peak II and Tf shift toward lower temperature about 90 °C and −30 °C, respectively, as shown in Fig. 4(f).
Temperature dependent dielectric permittivity at 0.1–100 kHz and loss at 1 kHz for the [001]-oriented 0.24PIN–0.43PMN–0.33PT crystal under the different DC biases’ field strength of (a) 0 kV/cm, (b) 1 kV/cm, (c) 2 kV/cm, (d) 3 kV/cm, (e) 4 kV/cm, and (f) 5 kV/cm.

It is generally believed that in R phase relaxor-PT crystals, the dipoles are arbitrarily oriented along one of the eight polarization [111] directions of the pseudocubic phase. The engineered domain configuration 4R, with 4 equivalent polarization orientations along the [111] direction, can be induced by DC bias along the [001] direction. Another engineered domain configuration 2R, with 2 equivalent polarization orientations along the [111] direction, can be obtained by DC bias along the [011] direction. The engineered monodomain configuration 1R can be obtained by applying a DC bias along the [111] direction. Under a DC bias of 5 kV/cm and temperature above Tf, the dielectric permittivity with 4R domain structure is more than 2500, about 5 times bigger than that with R monodomain structure, and the value with 2R domain structure is more than 2000, which lies in between the above values. Also, due to 180° domain wall motion above Tf, the [111] oriented single crystals with an R monodomain structure shows the minimum dielectric loss in [001]-, [011]-, and [111]-oriented crystals.Reference Zhang, Sherlock, Meyer and Shrout24
Compared with PMN–PT crystals, the partial substitution of Mg2+ by In3+ in the PIN–PMN–PT crystal will make the ions distribution more disordered. Therefore, at lower temperature, the polar nanoregions with polar vectors arbitrarily aligned along eight equivalent polar axes may convert to microdomains.Reference Xi, Zhili and Cross23,Reference Cheng, Zhang and Yao25 The randomly oriented microdomains will transform to the engineered 2R and 4R macrodomain configurations with a multidomain state as a bias field is applied on [011] and [001] oriented samples at lower temperature. The reconstruction of the macrodomains is supposed to be accelerated by the DC bias. Therefore, it can be concluded that strong dielectric frequency dispersion may exist at lower temperature, and the micro–macro domain transition may be induced by the DC bias.
Figure 5 shows the temperature dependent dielectric permittivity at 1 kHz for the 0.24PIN–0.43PMN–0.33PT crystal with DC bias applied along the [001] direction. With increasing DC bias, TT–C shifts to the higher temperature, while TR–T shifts to the opposite direction. The dielectric permittivity of the T phase decreases sharply as DC bias rises from 0 kV/cm to 1 kV/cm. Generally, the spontaneous polarization of the T phase is along the [001] direction; therefore, the DC bias along [001] direction will make the T phase more stable. The temperature range where the T phase is stable can be enlarged by the further increase of the DC bias. The DC bias along the [001] direction will induce the T phase with the monodomain state, in which polarization rotation is free and the dielectric permittivity decreases with increasing DC bias. It is also found that Tf shifts to the lower temperature. In addition, peak II tends to become wider, indicating more than one phase transition process (R → T) existed. Based on the phase transition sequence of R → MA → MC → T in the 0.70PMN–0.30PT crystal with electric field applied along the [001] direction,Reference Bai, Wang, Li, Viehland, Gehring, Xu and Shirane26 it can be inferred that the intermediate phase in the transition process of R to T phase may be a monoclinic phase M (MA or MC).
Temperature dependent dielectric permittivity at 1 kHz for the [001]-oriented 0.24PIN–0.43PMN–0.33PT single crystal under the DC bias (0–5 kV/cm) during the HP.

The dielectric permittivity of poled 0.24PIN–0.43PMN–0.33PT crystals (polarization conditions: 10 kV/cm, 10 min, room temperature) along [001] and [011] directions increases to about 5000 and 3500 (1 kHz, room temperature), respectively,Reference Wan, Li, Chen, Li, Xu, Fan and Yao20 which is larger than those in the unpoled state with value about 1700 (1 kHz, room temperature). The piezoelectric constant d 33 is about 1500 pC/N and 1000 pC/N, respectively. As the poling field is applied to the [001] and [011] directions, the engineered domain structure with “4R” and “2R” will be constructed, and, at the same time, the intermediate phases will make the domain wall movement and polarization rotation easier; therefore, the dielectric and piezoelectric properties can be enhanced. From the temperature-dependent dielectric permittivity of poled crystals,Reference Wan, Li, Chen, Li, Xu, Fan and Yao20 the phase transition processes R → T → C and R → O → T → C can be seen in [001]- and [011]-oriented crystals, respectively, which are slightly different from those with constant DC bias applied on the crystals during the whole dielectric measurements where the intermediate phase such as MC and MB can be clearly seen. The micro–macro domain transition process at Tf is also not found in the poled crystals. The intermediate phase and the micro–macro domain transition process are sensitive to the electric field strength, crystal orientation, temperature, and the poling method.
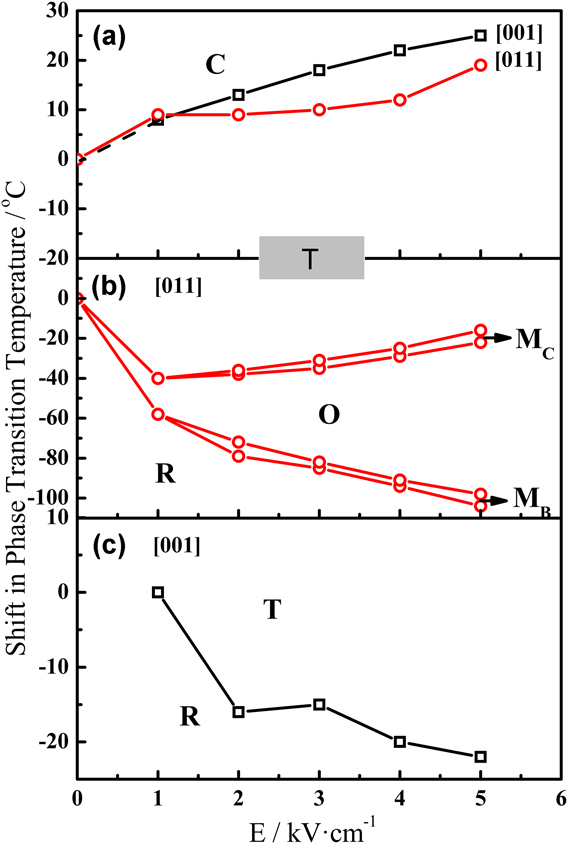
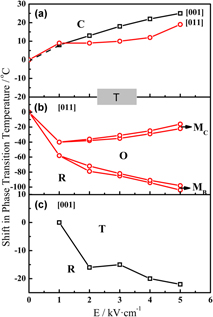
Based on the temperature and DC bias dependence of phase transition behavior of the 0.24PIN–0.43PMN–0.33PT crystal with different orientations, the ‘temperature-bias’ phase diagram was established. The ‘temperature-bias’ phase diagram of the 0.24PIN–0.43PMN–0.33PT crystal with DC bias applied along the [011] direction is plotted in Figs. 6(a) and 6(b). As the DC bias field strength is below 1 kV/cm, TT–C shifts to the higher temperature with the field strength. As the bias field strength rises to 1–3 kV/cm, TT–C is nearly constant. As the DC bias rises over 3 kV/cm, TT–C increases with increasing bias field strength. The intermediate phases in the R → T phase transition are MB, O, and MC. The temperature range of MB and MC phases is relatively narrow within 3–5 °C. With the increase of the DC bias, the O phase stability regime is gradually expanded, and  ${{\rm{T}}_{{\rm{O}} - {{\rm{M}}_{\rm{C}}}}}$ and
 ${{\rm{T}}_{{{\rm{M}}_{\rm{C}}} - {\rm{T}}}}$ slowly shift to higher temperature with the moving rate about 5 °C kV/cm. Conversely,
 ${{\rm{T}}_{{\rm{R}} - {{\rm{M}}_{\rm{B}}}}}$ and
 ${{\rm{T}}_{{{\rm{M}}_{\rm{B}}} - {\rm{O}}}}$ shift to lower temperature, and the moving rate was about 10 °C kV/cm.
Temperature-bias phase diagram of the 0.24PIN–0.43PMN–0.33PT crystal oriented along [011] and [001] directions with the phase transition of (a) T → C, (b) R → MB → O → MC → T, and (c) R → T.

Figures 6(a) and 6(c) show the ‘temperature-bias’ phase diagram of the 0.24PIN–0.43PMN–0.33PT crystal with DC bias applied along the [001] direction. TT–C increases and TR–T decreases with the increase of bias field strength. The temperature range where the T phase is stable will be enlarged by the bias field applied along the spontaneous polarization direction of the T phase. However, as the DC bias is applied along spontaneous polarization of the R phase, the temperature range where the R phase is stable can be enlarged, and then the TR–T rises with increasing DC bias.Reference Wan, Li, Ma, Li, Xu, Fan and Yao14 Unlike the [011]-oriented 0.25PIN–0.42PMN–0.33PT single crystal, the intermediate MB/MC and O phases are not found in the transition process of R to T phase for crystals with bias field applied along [001] and [111] directionsReference Wan, Li, Ma, Li, Xu, Fan and Yao14 during the HP.
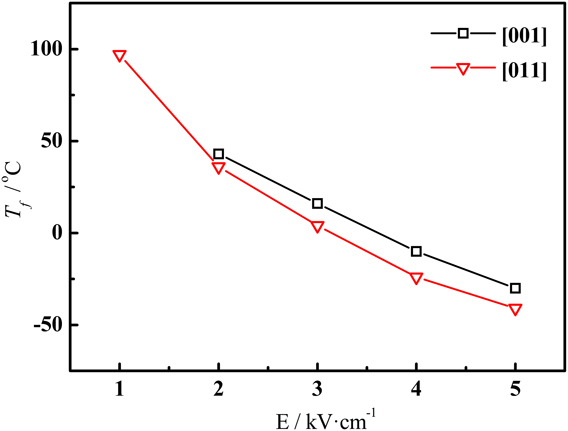
The transition temperature Tf of the 0.24PIN–0.43PMN–0.33PT crystal with [001] and [011] orientations both decreases quickly with DC bias, as shown in Fig. 7. Based on orientation and strength of the DC bias, dielectric properties at Tf are similar to the 0.23PIN–0.52PMN–0.25PT crystal with R phase far away from the morphotropic phase boundary.Reference Wan, Li, Ma, Li, Xu, Fan and Yao14 Tf of the 0.24PIN–0.43PMN–0.33PT crystal is higher than that of the 0.23PIN–0.52PMN–0.25PT crystal with low PT content under the same DC bias strength, except for the [111]-oriented crystal under bias strength of 2 kV/cm.Reference Wan, Li, Ma, Li, Xu, Fan and Yao14
DC bias dependent transition temperature of the micro to macro domain for the [011]- and [001]-oriented 0.24PIN–0.43PMN–0.33PT crystals.

IV. CONCLUSIONS
Temperature and DC bias dependent phase transition characteristics of 0.24PIN–0.42PMN–0.33PT crystals with bias field applied along [011] and [001] directions are studied using dielectric measurements. The phase transition behavior is also compared with that of the [111]-oriented crystal. The phase transition sequence of R → T → C is found in [111]- and [001]-oriented crystals. The phase transition behavior of [011]-oriented crystals is more complicated with the sequence of R → MB → O → MC → T → C. The intermediate phase MB, O, and MC are only found in the [011]-oriented crystal. The dielectric behavior of 0.24PIN–0.43PMN–0.33PT crystals is more complex compared with that of PMN–PT crystals. The transition temperature Tf of micro to macro domains is sensitive to strength and direction of bias field and decreases quickly with an increase in bias field. The dielectric behavior of 0.24PIN–0.43PMN–0.33PT single crystals at Tf along [111], [011], and [001] directions is apparently different. The engineered domains with structure R, 2R, and 4R could be induced above Tf by a DC bias along the [111], [011], and [001] directions, respectively. Finally, the DC bias electric field-temperature phase diagram of 0.24PIN–0.43PMN–0.33PT crystals was established.
ACKNOWLEDGMENTS
This work was funded by the International Science & Technology Cooperation Program of China (Grant No. 2014DFR51240), National Basic Research Program of China (973 Program, No. 2015CB654602), and National Natural Science Foundation of China (NSFC) (Grant Nos. 51761145024 and 61627812). This work was also funded by Scientific Research Fund of the Department of Education of Shaanxi Province, China (No. 15JK1526).