Implications
Genomic selection is rapidly adopted in breeding programs around the world. It relies on genotyping a reference population with known phenotypes and genotyping selection candidates. The latter is costly if the number of selection candidates is large. Costs can be reduced by genotyping them with a lower-density single nucleotide polymorphism (SNP) panel and impute them to commonly used 50k SNP panels. In this review paper, we show that the accuracy of this imputation step should be measured as the correlation between true and imputed genotypes, to infer the impact of using imputed v. measured genotypes on accuracy of subsequent genomic selection.
Introduction
Genomic selection (GS) is rapidly changing breeding programs around the world. Application of GS requires having dense genotypes on selection candidates and on a reference population (RP) of preferably at least a few thousand animals with known phenotype. As a result, thousands of animals may need to be genotyped per year, resulting in high genotyping costs for breeding programs. These costs may be lowered considerably by using a combination of high and low-density single nucleotide polymorphism (SNP) panels, where animals genotyped with the low-density SNP panel are imputed up to high density (Goddard, Reference Goddard2008; Habier et al., Reference Habier, Fernando and Dekkers2009). Large numbers of individuals can then be genotyped at relatively low cost, which allows for instance to cost-effectively screen large numbers of potential selection candidates to increase selection intensity (e.g. Huang et al., Reference Huang, Hickey, Cleveland and Maltecca2012a). Imputation of low density to 50k SNP panels, is common practice in genomic breeding programs for dairy cattle (Wiggans et al., Reference Wiggans, Cooper, VanRaden, Olson and Tooker2012), pigs (e.g. Huang et al., Reference Huang, Hickey, Cleveland and Maltecca2012a) and poultry (e.g. Fulton, Reference Fulton2012), and has been investigated for sheep (Hayes et al., Reference Hayes, Bowman, Daetwyler, Kijas and van der Werf2012). At the same time, imputation from 50k to SNP panels with even higher density (e.g. Hozé et al., Reference Hozé, Fouilloux, Venot, Guillaume, Dassonneville, Fritz, Ducrocq, Phocas, Boichard and Croiseau2013; Pausch et al., Reference Pausch, Aigner, Emmerling, Edel, Gotz and Fries2013; Pryce et al., Reference Pryce, Johnston, Hayes, Sahana, Weigel, McParland, Spurlock, Krattenmacher, Spelman, Wall and Calus2014), or to whole genome sequence (van Binsbergen et al., Reference van Binsbergen, Bink, Calus, van Eeuwijk, Hayes, Hulsegge and Veerkamp2014) is under investigation.
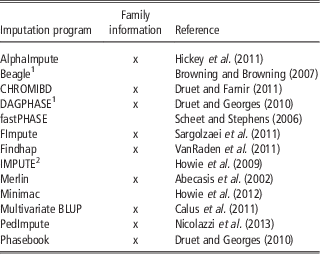
Many different imputation methods have been applied in livestock, and several studies have compared different imputation methods (e.g. Johnston et al., Reference Johnston, Kistemaker and Sullivan2011; Khatkar et al., Reference Khatkar, Moser, Hayes and Raadsma2012; Mulder et al., Reference Mulder, Calus, Druet and Schrooten2012). Some methods fully rely on LD, whereas others use family information in addition (for an overview of methods used; see Table 1). It should be noted that most of the programs that use pedigree information, such as FImpute, are also often applied without using pedigree and therefore relying fully on LD in those cases. Performance of imputation methods is generally evaluated as follows. A subset of the individuals genotyped with the targeted high-density panel are selected into a validation data subset. In this validation subset, genotypes of loci that are not included on the panel with lower density, are masked. The remaining individuals with high-density genotypes are used as a RP in the imputation step. In the imputation step, the masked genotypes in the validation data are imputed. Genotypes may be imputed with discrete values, for instance by using the most likely genotype. Alternatively, probabilities for each genotype can be used to calculate predicted genotypes on a continuous scale, hereafter referred to as gene dosage, and often shortened as simply dosage or sometimes called gene content. Correctness of imputation is generally calculated for each imputed SNP by comparing the masked true genotypes to imputed genotypes across animals. In literature, several different ways to compare true and imputed genotypes have been reported. In some studies the percentage of incorrectly imputed alleles or genotypes is reported, and termed allelic or genotype imputation error rate (e.g. Zhang and Druet, Reference Zhang and Druet2010). Other studies report the percentage of correctly imputed genotypes, and call this imputation accuracy (Weigel et al., Reference Weigel, Van Tassell, O’Connell, VanRaden and Wiggans2010a), while also the (squared) correlation between true and imputed genotypes is often called imputation accuracy (Druet et al., Reference Druet, Schrooten and de Roos2010; Calus et al., Reference Calus, Veerkamp and Mulder2011; Mulder et al., Reference Mulder, Calus, Druet and Schrooten2012). Other measures that have been developed or suggested include the imputation quality score (Lin et al., Reference Lin, Hartz, Zhang, Saccone, Wang, Tischfield, Edenberg, Kramer, Goate, Bierut and Rice2010) and those that are derived internally in imputation algorithms. The imputation packages MaCH and Beagle compute a measure that attempts to predict the imputation R 2 value based on the posterior distribution of the Gibbs sampler, without having any information of the true genotypes. Little is known about the usefulness of the different measures to evaluate correctness of imputation although it was suggested that the correlation between true and imputed genotypes is independent from the allele frequency at the imputed locus, and may therefore be a measure with more desirable properties than allelic imputation error rates (Browning and Browning, Reference Browning and Browning2009; Hickey et al., Reference Hickey, Crossa, Babu and de los Campos2012).
Different imputation programs that have been applied for imputation of genotypes in livestock

1 Genotype information of parents can optionally be used explicitly.
2 Is part of PHASEBOOK.
The objective of this paper is to review different measures of correctness of imputation, and to evaluate their utility considering that the imputed genotypes will be used for genomic prediction. This paper is organized as follows. We start with comparing correctness of imputation measures, more specific the correlation between imputed and true genotypes v. the (allelic and genotypic) imputation error rate. Thereafter, factors affecting imputation accuracy are discussed, and the link between correctness of imputation of an individuals’ genotypes and its accuracy of subsequent genomic predictions is evaluated. Finally, computation of individual-specific imputation accuracy, as opposed to locus-specific imputation accuracy, is discussed. Evaluation of the properties of measures of correctness of imputation is performed both analytically and empirically using examples. Recommendations are given as to which measures are preferred in the context of genomic prediction. Results of previous studies are reviewed throughout the paper.
Imputation accuracy v. imputation error rate
Throughout the remainder of the paper, we will use the term ‘imputation accuracy’ for the Pearson correlation coefficient between true and imputed genotypes. As indicated before, other authors have used this term to denote rates of correctly imputed alleles or genotypes. We prefer to use this term solely for the correlation between true and imputed genotypes, because this definition is in line with the definition of the accuracy of breeding values, which is commonly used in the context of animal breeding.
Imputation error rate is computed per locus as the percentage (or proportion) of alleles or genotypes that is imputed incorrectly. A closely related measure is the percentage of correctly imputed alleles or genotypes, which can simply be calculated as 100% minus the imputation error rate. The error rate measured at the level of alleles is approximately half the error rate measured at the level of genotypes, as explained in detail in Supplementary Material S1.
The difference between the allele imputation error rate (AIER) and the imputation accuracy can be evaluated as follows. Consider a situation where genotypes are imputed for one locus across multiple individuals, based on population allele frequencies, where p
i
and 1−p
i
are the frequencies of respectively alleles one and two at locus i. As the measures are computed per locus across animals, the considered imputation error rates and accuracies are termed to be locus specific. When imputing is based on population allele frequencies, an allele at locus i is imputed as allele 1 with probability p
i
and as allele two with probability (1−p
i
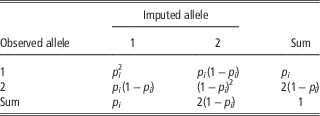
). In Table 2, we give for each allele the probability that this allele was imputed as allele one or two. The proportion of correctly imputed alleles is the sum of the diagonal values in Table 2, which after rearrangement is
 $$2p_{i}^{2} {\minus}2p_{i} {\plus}1$$
. Using this formula, the proportion of correctly imputed alleles depends directly on p
i
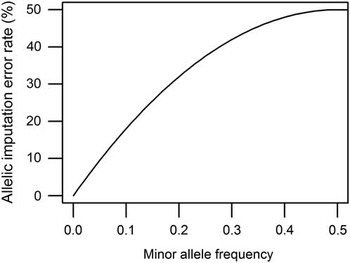
, and so does the AIER, as shown in Figure 1. This dependence is such that the AIER of loci with a low minor allele frequency (MAF) is expected to be low. An arbitrary adjustment to the AIER or genotype imputation error rate has been proposed (Hayes et al., Reference Hayes, Bowman, Daetwyler, Kijas and van der Werf2012; Badke et al., Reference Badke, Bates, Ernst, Schwab, Fix, Van Tassell and Steibel2013) that removes the dependency on MAF. This adjustment corrects for the proportion of genotypes or alleles that is expected to be imputed correctly by chance.
Allele imputation error rate as function of the allele frequency of one of the alleles, considering that imputation is based on the population allele frequencies.

Proportion of alleles 1 and 2 that are imputed as 1 or 2 based on allele frequencies
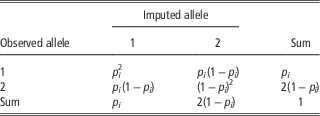
Computation of imputation accuracy as the correlation between true and imputed alleles requires the variance of the true and imputed alleles, and the covariance between true and imputed alleles. The covariance between true and imputed alleles is calculated from the following general formula to calculate the covariance between two variables x and y:
 $${{\sum \left( {xy} \right){\minus}{{\sum \displaystyle{x}}\sum \displaystyle{y} \over \displaystyle{n}} \over {n{\minus}1}}$$
The expectation of this covariance between true (y) and imputed alleles (x), considering imputation based on population allele frequencies, can be derived using the expectations in Table 2 multiplied with the number of individuals in the validation data (n), yielding:
 $$\eqalign{ {\scale90%{{n(1{\times}1{\times}p_{i}^{2} {\plus}1{\times}2{\times}p_{i} (1{\minus}p_{i} ){\plus}2{\times}1{\times}p_{i} (1{\minus}p_{i} ))}}\over{\scale90%{n{\minus}1}}}\cr \,\plus {\scale90%n\scale90%{(2{\times}2{\times}(1{\minus}p_{i} )^{2} )}{\minus}{\displaystyle{\scale90%{(n(1{\times}p_{i} {\plus}2{\times}(1{\minus}p_{i} )))^{2}}} \over {\displaystyle \scale90%n}} \over {\scale90%{n{\minus}1}}} \cr ={\scale90%{n(p_{i}^{2} {\plus}4p_{i} (1{\minus}p_{i} ){\plus}4(1{\minus}p_{i} )^{2} ){\minus}n(p_{i} {\plus}2(1{\minus}p_{i} ))^{2} } \over {\scale90%{n{\minus}1}}} \cr ={\scale90%{n(p_{i} {\plus}2(1{\minus}p_{i} ))^{2} {\minus}n(p_{i} {\plus}2(1{\minus}p_{i} ))^{2} } \over {\scale90%{n{\minus}1}}}=0$$
This shows that imputation based on population allele frequencies results in a covariance between true and imputed alleles, that is always equal to zero, and therefore the imputation accuracy is also equal to zero. An alternative derivation, based on genotypes instead of alleles, is shown in Supplementary Material S2.
The above demonstrates that the imputation accuracy has an expected value of zero when imputation is only based on allele frequencies, and therefore does not depend on MAF, while the imputation error rate is clearly affected by MAF (Figure 1) (Hickey et al., Reference Hickey, Crossa, Babu and de los Campos2012). This shows that imputation accuracy and AIER are different measures for correctness of imputation, and using either of the two might lead to different inferences. Note that correctness of imputation based on population allele frequencies can be regarded as the lower bound for the expectation of more sophisticated imputation methods.
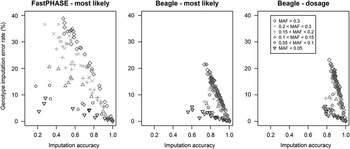
To further illustrate the above findings, and to demonstrate that these patterns are indeed observed after imputation using sophisticated imputation software, we empirically evaluated the relationship between locus-specific imputation accuracies and AIER at different levels of MAF for a simulated data set. Details of the simulated data were described in Calus et al. (Reference Calus, Veerkamp and Mulder2011). The simulated data consisted of two replicates of one chromosome each with a total of 36 loci on the low-density panel and 177 imputed loci, with distances of ~0.1 cm between loci and an average r 2 value of 0.31 between the loci (i.e. the ‘dense’ scenario in Calus et al., Reference Calus, Veerkamp and Mulder2011). We here used three sets of imputed genotypes, for which imputation accuracies and AIER were calculated for each imputed locus. The first set was obtained using the most likely genotypes imputed by fastPHASE (Scheet and Stephens, Reference Scheet and Stephens2006). The second and third set were obtained using Beagle (Browning and Browning, Reference Browning and Browning2007), either containing the most likely genotypes or the gene dosage.
For each set of imputed genotypes, the calculated genotype imputation error rates are plotted against the imputation accuracy in Figure 2. This figure shows that the relationship between imputation error rate and accuracy depends on the MAF. At high MAF, there is a much stronger, almost linear relationship between imputation error rate and imputation accuracy than at low MAF. Regressing both the imputation error rates and imputation accuracies on the MAF (Table 3) confirmed that the imputation error rate has a strong relationship with the MAF while imputation accuracy has virtually no relationship with MAF.
Genotype imputation error rate v. imputation accuracy, using the most likely genotype imputed by FastPHASE or Beagle, or the imputed gene dosage imputed by Beagle.

Intercept, slope and R 2 value of regressions of imputation accuracy and error rate on minor allele frequency

Several studies have shown that imputation accuracy tends to increase with higher MAF, suggesting that imputation of SNP with low MAF is more difficult, while imputation error rates in fact increase with higher MAF, suggesting that imputation of SNP with low MAF is easier (Brøndum et al., Reference Brøndum, Ma, Lund and Su2012; Hickey et al., Reference Hickey, Crossa, Babu and de los Campos2012; Ma et al., Reference Ma, Brøndum, Zhang, Lund and Su2013). This apparent paradox is a result of the dependency of AIER on the MAF. The observed increase in AIER with higher MAF in those studies agrees with our regression coefficients in Table 3, while the observed increase in imputation accuracy with increased MAF was not observed in our regression coefficients. The most likely explanation for this difference in results is that for a given MAF, the variation in observed imputation accuracies is much greater than for imputation error rates, because imputation accuracies have no relationship with MAF. This is also what the R 2 values of our regressions suggest (Table 3). As imputation accuracy gives more credit to correctly imputing a rare allele compared with a common allele, while AIER does exactly the opposite, we conclude, in agreement with the suggestions of Hickey et al. (Reference Hickey, Crossa, Babu and de los Campos2012) and Mulder et al. (Reference Mulder, Calus, Druet and Schrooten2012), that the imputation accuracy is preferred as a measure of correctness of imputation over the percentage of (in)correctly imputed alleles or genotypes. It is worthwhile noting that this conclusion is even more important for imputation of sequence data that has a much greater proportion of loci with low MAF than SNP data.
Factors affecting imputation accuracy
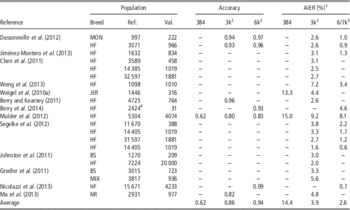
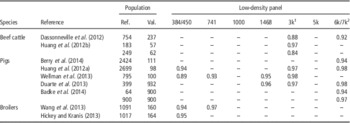
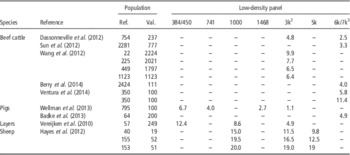
Several studies have investigated imputation accuracy and AIER. We have summarized published results for dairy cattle data in Table 4 and for beef cattle, pigs, layers, broilers and sheep in Tables 5 (imputation accuracy) and 6 (AIER). Whenever results of multiple imputation methods on the same data were reported, average results across those imputation methods are reported in Tables 4 to 6 (for a more detailed overview with results for different imputation accuracy methods, see Supplementary Tables 1 and 2, respectively). Imputation accuracy from low density to 50k was reported to be in the range of 0.58 to 0.98, while reported allelic imputation error rates ranged from 2.1% to 40.0%.
Overview of imputation accuracies and allele imputation error rate for imputation of 50k genotypes in dairy cattle

MON=Montbéliarde; HF=Holstein; JER=Jersey; BS=Brown Swiss; MIX=is a combined data set containing Simmental, Swiss Fleckvieh and Holstein; NR=Nordic Red.
When multiple imputation methods were used on the same data, then average results are presented.
1 Allele imputation error rate (AIER) is computed as half the genotype imputation error rate for studies that provided the latter measure.
2 This is the Bovine3K (Illumina Inc., San Diego, CA), or an in silico 3k panel designed within the study (Weigel et al., Reference Weigel, Van Tassell, O’Connell, VanRaden and Wiggans2010a; Mulder et al., Reference Mulder, Calus, Druet and Schrooten2012). Dassoneville et al. (Reference Dassonneville, Fritz, Ducrocq and Boichard2012) used both the Bovine3K and in silico panel.
3 This is the BovineLD with 6909 single nucleotide polymorphisms (Illumina Inc.), or an in silico 6k panel designed within the study (Dassonneville et al., Reference Dassonneville, Fritz, Ducrocq and Boichard2012; Mulder et al., Reference Mulder, Calus, Druet and Schrooten2012).
4 This is a multibreed reference population (including: 195, 140, 526, 189, 688, 506 and 180 bulls for Aberdeen Angus, Belgian Blue, Charolais, Hereford, Holstein-Friesian, Limousin and Simmental, respectively).
Overview of imputation accuracies for imputation of 50k genotypes in livestock species other than dairy cattle

When multiple imputation methods were used on the same data, or when the same data was used to impute equally sized groups of animals from different breeds, then average results are presented.
1 This is the Bovine3K (Illumina Inc.) (Dassonneville et al., Reference Dassonneville, Fritz, Ducrocq and Boichard2012; Huang et al., Reference Huang, Hickey, Cleveland and Maltecca2012a, Reference Huang, Maltecca, Cassady, Alexander, Snelling and MacNeil2012b), or an in silico 3k panel for all other studies.
2 This is the BovineLD with 6909 single nucleotide polymorphisms (SNPs) (Illumina Inc.) (Huang et al., Reference Huang, Hickey, Cleveland and Maltecca2012a), the GeneSeek Genomic Profiler (containing 10k SNPs of which 6890 were retained for analysis; Badke et al., Reference Badke, Bates, Ernst, Fix and Steibel2014), or an in silico 6k panel for all other studies.
Overview of allele imputation error rateFootnote 1 for imputation of 50k genotypes in livestock species other than dairy cattle

When multiple imputation methods were used on the same data, or when the same data was used to impute equally sized groups of animals from different breeds, then average results are presented.
1 Allele imputation error rate is computed as half the genotype imputation error rate for studies that provided the latter measure.
2 This is the Bovine3K (Illumina Inc.) (Dassonneville et al., Reference Dassonneville, Fritz, Ducrocq and Boichard2012; Wang et al., Reference Wang, Habier, Peiris, Wolc, Kranis, Watson, Avendano, Garrick, Fernando, Lamont and Dekkers2012), or an in silico 3k panel for all other studies.
3 This is the BovineLD with 6909 single nucleotide polymorphisms (SNPs) (Illumina Inc.) (Sun et al., Reference Sun, Wu, Weigel, Rosa, Bauck, Woodward, Schnabel, Taylor and Gianola2012; Ventura et al., Reference Ventura, Lu, Schenkel, Wang, Li and Miller2014), the GeneSeek Genomic Profiler (containing 10k SNPs of which 6890 were retained for analysis; Badke et al., Reference Badke, Bates, Ernst, Schwab, Fix, Van Tassell and Steibel2013), or an in silico 6k panel for all other studies.
Several factors have been reported to affect imputation accuracy. The most important factor in livestock is the number of genotyped immediate ancestors (Hickey et al., Reference Hickey, Kinghorn, Tier, Wilson, Dunstan and van der Werf2011; Huang et al., Reference Huang, Hickey, Cleveland and Maltecca2012a). When there are no or few immediate ancestors with genotypes, the total number of animals at the imputed density becomes important, that is, having too few animals with genotypes at the imputed SNP density yields poor imputation results (Hayes et al., Reference Hayes, Bowman, Daetwyler, Kijas and van der Werf2012; Wang et al., Reference Wang, Woodward, Bauck and Rekaya2012). Conversely, the impact of having only a small number of animals available at the imputed SNP density on imputation accuracy may be limited if those animals are close relatives, for example, immediate ancestors, of the imputed individuals (Duarte et al., Reference Duarte, Bates, Ernst, Raney, Cantet and Steibel2013). Other factors include the SNP density on the low and high panel (Mulder et al., Reference Mulder, Calus, Druet and Schrooten2012), the MAF of the imputed SNP (van Binsbergen et al., Reference van Binsbergen, Bink, Calus, van Eeuwijk, Hayes, Hulsegge and Veerkamp2014) and whether imputed SNP are located at the end of a chromosome or not (Badke et al., Reference Badke, Bates, Ernst, Schwab, Fix, Van Tassell and Steibel2013; Cleveland and Hickey, Reference Cleveland and Hickey2013; Wellmann et al., Reference Wellmann, Preuß, Tholen, Heinkel, Wimmers and Bennewitz2013). These factors contribute to the probability that the correct haplotypes are identified and to the LD between imputed SNP and SNP on the low-density panel (Pei et al., Reference Pei, Li, Zhang, Papasian and Deng2008). For very low-density SNP panels (e.g. 384 SNP), the impact of the LD between imputed SNP and SNP on the low-density panel can also be reduced considerably if the animals genotyped at the imputed density are close relatives of the imputed individuals (Hickey and Kranis, Reference Hickey and Kranis2013; Wang et al., Reference Wang, Habier, Peiris, Wolc, Kranis, Watson, Avendano, Garrick, Fernando, Lamont and Dekkers2013; Wellmann et al., Reference Wellmann, Preuß, Tholen, Heinkel, Wimmers and Bennewitz2013).
When imputing using software that does not explicitly utilise pedigree information, other important factors affecting imputation accuracy include the number of individuals with genotypes at the imputed density (Zhang and Druet, Reference Zhang and Druet2010), and the relationship between imputed individuals and individuals genotyped at high density (Hickey et al., Reference Hickey, Crossa, Babu and de los Campos2012). Most of these factors interact with each other. For instance, imputation accuracy increases when the density of the low-density panel increases (Berry et al., Reference Berry, McClure and Mullen2014), which implies that the required number of genotyped individuals at the high density to reach a certain level of imputation accuracy decreases when the density of the SNP at the low-density panel increases. Another example is that when pedigree information is not explicitly used the increase in the number of haplotypes in the reference panel tends to especially increase the imputation accuracy of SNPs that are in low MAF (Badke et al., Reference Badke, Bates, Ernst, Schwab, Fix, Van Tassell and Steibel2013).
The impact of relationships of the imputed animal with the RP on its imputation accuracy can also be derived theoretically from the characteristics of an imputation model as demonstrated in Supplementary Material S3. This demonstrates that if there is a large variation in the relationships of imputed animals with the RP, imputed genotypes come from a mixture of distributions. To avoid this affecting the imputation accuracy computed as a Pearson correlation, it is advisable to compute imputation accuracy within classes of animals that have comparable relationships with the RP. Such classes could, for instance, be having one parent in the RP, having two parents in the RP, having one grandparent in the RP, etc. Alternatively, animals can be grouped by a score representing the expected proportion of the genome inherited from reference individuals (Zhang and Druet, Reference Zhang and Druet2010), also termed ‘traceability’ (Mulder et al., Reference Mulder, Calus, Druet and Schrooten2012). This measure has a much stronger relationship with imputation accuracy than, for example, the average relatedness of imputed animals with the RP (Berry and Kearney, Reference Berry and Kearney2011).
Some imputation procedures (e.g. probabilistic Hidden Markov models such as MaCH, Beagle, Impute2 or mixtures of probabilistic and heuristic such as AlphaImpute) compute and use a probability for each of the possible genotypes on a locus. These genotype probabilities can be used to impute the genotype with the highest probability, that is, the most likely genotype. Alternatively, the genotype probabilities can be used to weigh each of the genotypes, to calculate a predicted gene dosage. When the genotypes are imputed using a BLUP model (Gengler et al., Reference Gengler, Mayeres and Szydlowski2007), genotypes are predicted as gene dosages. Given that these predicted gene dosages are BLUP estimates implies that they are unbiased (in the BLUP sense), whereas most likely genotypes are not. This can also more generally be derived from standard statistical theory (Aulchenko et al., Reference Aulchenko, Struchalin and van Duijn2010). In addition, it has been shown that imputation accuracies computed based on gene dosages are higher than based on the most likely genotypes, while the AIER tends to be higher when using dosages (Mulder et al., Reference Mulder, Calus, Druet and Schrooten2012). Several studies have shown that use of predicted gene dosages in subsequent genomic prediction leads to higher accuracies and lower bias of the obtained genomic breeding values compared with when using the most likely genotypes (Berry and Kearney, Reference Berry and Kearney2011; Mulder et al., Reference Mulder, Calus, Druet and Schrooten2012; Pimentel et al., Reference Pimentel, Wensch-Dorendorf, Konig and Swalve2013; Wang et al., Reference Wang, Habier, Peiris, Wolc, Kranis, Watson, Avendano, Garrick, Fernando, Lamont and Dekkers2013). Based on these observations, using predicted gene dosages appears to give superior results compared with using most likely genotypes. Collapsing dosage into the most likely genotype essentially throws information away and is in most cases not necessary given that statistical methods to predict genomic breeding values generally can deal with probabilistic data.
The observed increase in accuracy of direct genomic values (DGV), due to using predicted gene dosage instead of most likely genotypes, was reported to be higher for animals that had a low imputation accuracy, for instance because they had no (grand)parents available in the 50k reference data (Berry and Kearney, Reference Berry and Kearney2011). This increase in DGV reliability corresponded well with the increase in the imputation accuracy, while the allelic error rates actually showed the opposite (Mulder et al., Reference Mulder, Calus, Druet and Schrooten2012).
Imputation accuracy and accuracy of subsequent genomic prediction
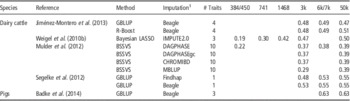
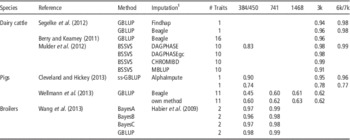
Several studies have computed DGV based on imputed genotypes, and compared those to the DGV obtained using true 50k genotypes. Those studies report either the reliability of the DGV based on true and imputed 50k genotypes (Table 7), or the correlation between the DGV based on true and imputed 50k genotypes (Table 8) or both. The latter measure directly illustrates the loss in genetic gain due to using imputed instead of true 50k genotypes information (Cleveland and Hickey, Reference Cleveland and Hickey2013), just like the imputation accuracy, that is expected to be linearly related to the DGV accuracy (Mulder et al., Reference Mulder, Calus, Druet and Schrooten2012). Most studies that reported reliabilities were based on dairy cattle (Table 7), illustrating that the concept of reliability of individual breeding values is especially important in dairy cattle breeding. Most studies on pigs and poultry reported the correlation between the DGV based on true and imputed 50k genotypes (Table 8). The correlation between the DGV based on true and imputed 50k genotypes was ~0.96 in most studies, indicating only a minor loss in genetic gain due to using imputed genotypes, as also reported by Cleveland and Hickey (Reference Cleveland and Hickey2013).
Reported reliabilities based on imputed genotypes and observed 50k genotypes from several studies

GBLUP=genomic BLUP; MBLUP=multivariate BLUP.
1 Imputation methods.
Reported correlation between genomic breeding values based on imputed genotypes and observed 50k genotypes from several studies

GBLUP=genomic BLUP; MBLUP=multivariate BLUP.
1 Imputation methods.
In terms of within breed genomic prediction, use of imputed 50k genotypes typically yields 85% to almost 100% of the reliability obtained with a 50k panel in dairy cattle, provided that the low-density panel contains at least 3k genotypes (Table 7). Other studies in dairy cattle have shown that further imputation to 777k SNPs yielded at most a limited further increase in reliability of genomic breeding values for within breed genomic prediction (Erbe et al., Reference Erbe, Hayes, Matukumalli, Goswami, Bowman, Reich, Mason and Goddard2012; Su et al., Reference Su, Brøndum, Ma, Guldbrandtsen, Aamand and Lund2012; VanRaden et al., Reference VanRaden, Null, Sargolzaei, Wiggans, Tooker, Cole, Sonstegard, Connor, Winters, van Kaam, Valentini, Van Doormaal, Faust and Doak2013). Thus, imputation is especially valuable for GS to reduce genotyping cost, by imputing low density up to commonly used 50k SNP panels.
Individual-specific imputation accuracy
When the goal is to use imputed genotypes for genomic prediction, then it is desirable that imputation accuracy reflects the accuracy of the subsequent genomic predictions, relative to the scenario where an individuals’ genotypes are known without uncertainty. This means that imputation accuracy needs to be assessed per individual, that is, across loci for a single individual, rather than locus specific, that is, across individuals for a single locus. It is worthwhile noting that almost all studies that are reviewed here, did not report imputation accuracies per individual. Mulder et al. (Reference Mulder, Calus, Druet and Schrooten2012) did report individual imputation accuracies, and observed that individual-specific imputation accuracies computed as the correlation between true and imputed genotypes across loci appear to be overestimated, since the average of those individual accuracies is higher than the average of the locus-specific accuracies. This was also observed by Bouwman et al. (Reference Bouwman, Hickey, Calus and Veerkamp2014) and Van Binsbergen et al. (2014). Mulder et al. (Reference Mulder, Calus, Druet and Schrooten2012) suggested to overcome this by subtracting the mean genotype per locus, both from the true and imputed genotype. Bouwman et al. (Reference Bouwman, Hickey, Calus and Veerkamp2014) showed that this adjustment of the genotypes indeed yields considerably lower individual imputation accuracies. The desired characteristics of true and imputed genotypes when computing individual-specific imputation accuracies, follows directly from its definition. The (individual specific) imputation accuracy, as defined in this article, is computed as the Pearson correlation coefficient between imputed and true genotypes. The Pearson correlation coefficient assumes that two variables for which the correlation is computed are bivariate normal distributed. When computing individual-specific imputation accuracies, this implies that at each locus for both true and imputed genotypes the mean and the variance need to be standardized, for example, such that adjusted genotypes at each locus follow the same distribution (see Supplementary Material S4 for a more detailed explanation). It should be noted that such adjustment gives more weight to errors at loci with a low MAF, in a similar way as standardizing genotypes in genomic prediction gives more weight to loci with low MAF (VanRaden, Reference VanRaden2008). Thus, centring and scaling of genotypes leads to an individual imputation accuracy that rewards correct imputation of genotypes at low MAF loci where genotypes are hard to impute, while it gives less credit to correctly imputing genotypes at easy to impute loci with high MAF.
To demonstrate the impact of (not) centring and scaling true and imputed genotypes on the realized imputation accuracy, a ‘golden standard’ measure for imputation accuracy is needed. The DGV accuracy (r DGV) is linearly related to the imputation accuracy (r imp), as: r DGV=r imp×r SNP, where r SNP is the accuracy of the estimated SNP effects (Mulder et al., Reference Mulder, Calus, Druet and Schrooten2012). Note that this formula is very similar to the formula presented by Goddard (Reference Goddard2009) to compute the accuracy of a genomic breeding value, with the only difference that r imp in our formula replaces r(T, T m ) in Goddard’s formula, that represents the (average) linkage disequilibrium between markers and QTL. Thus, if we can create a situation in which we know r SNP and we can compute r DGV based on imputed genotypes that are in one scenario centred and scaled and not in another scenario, then we can easily compute for both scenarios the value r imp both from the formula above and by computing the correlation between true and imputed genotypes. If both values for r imp are similar in one of both scenarios, then this indicates that the genotypes were treated properly in that particular scenario. Using simulations, we can easily create data with known true SNP effects where r SNP=1, and therefore following the above described formula, E(r imp)=r DGV. This estimate of r imp will be used as a golden standard. In turn, r DGV can also be computed as the correlation between the simulated and predicted DGV. In this sense, it is a measure across animals, so it is important to have a ‘homogeneous’ group of animals that are expected to have similar values for r imp.
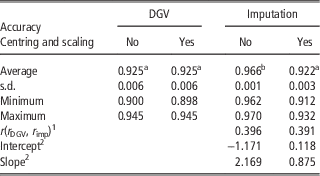
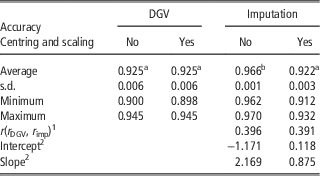
To apply the procedure as outlined above, we performed some straightforward simulations. The simulated data contained genotypes for a single chromosome. The last generation of animals had genotypes for 20 loci, while the two preceding generations, that included the parents of the last generation, had genotypes for all 2000 loci. The simulation was replicated 10 times using AlphaDrop (Hickey and Gorjanc, Reference Hickey and Gorjanc2012). A description of the simulations is given in Supplementary Material S5. The genotypes of the animals of the last generation were imputed using AlphaImpute (Hickey et al., Reference Hickey, Kinghorn, Tier, Wilson, Dunstan and van der Werf2011). On this simulated data, for each animal with imputed genotypes, the predicted DGV was calculated using imputed genotypes on the 0 to 2 scale. In addition, simulated and imputed genotypes were centred and scaled per locus. Within each of the 10 replicates, the DGV accuracy and the individual-specific imputation accuracy, before and after scaling the genotypes, was calculated for 10 000 bootstrapping samples, to obtain proper estimates of the standard errors of the computed accuracies. Thereafter, within each replicate across bootstrapping samples the DGV accuracies were regressed on the individual-specific imputation accuracies. The correlation between DGV accuracies and individual-specific imputation accuracies had a value of only 0.39 to 0.40, indicating that the accuracy of predicting the DGV accuracy with the individual-specific imputation accuracy was low, regardless whether genotypes were scaled and centred or not (Table 9). The regression coefficients, however, clearly indicated that computing imputation accuracy as correlation without scaling and centring the genotypes is a very biased predictor of the DGV accuracy (intercept=−1.171 and slope=2.169), while after scaling and centring the genotypes it is an almost unbiased predictor (intercept=0.118 and slope=0.875). This is also shown by the averages of the estimated imputation accuracies measured as a correlation between true and imputed genotypes. This average imputation accuracy was very close to the ‘golden standard’ imputation accuracy (E(r imp)=r DGV), when centring and scaling was applied, while it was significantly inflated by ~0.04 if genotypes were not centred and scaled (Table 9). These results indeed confirm that individual-specific imputation accuracies should be computed from genotypes that are centred and scaled.
Summary statistics of comparing DGV and imputation accuracy, based on a simulation where the single nucleotide polymorphism effects were assumed to be known without error
DGV=direct genomic values.
In all, two scenarios were considered, where genotypes were either defined on the original 0, 1, 2 scale or centred and scaled.
a,b Values with different superscripts indicate significant differences at P<0.05.
1 The correlation between DGV accuracy (r DGV) and individual-specific imputation accuracy (r imp).
2 Intercept and slope of regressing the DGV accuracy on the individual-specific imputation accuracy.
Concluding remarks
Imputation of high density, using true genotypes from a lower-density panel, has received a lot of attention in livestock genetics research in recent years, because it can reduce genotyping costs considerably while generally only a minor loss in genetic gain is expected because of imputation inaccuracy. Across this body of literature, several important messages can be extracted. First of all, imputation accuracy, measured as the correlation between true and imputed genotypes, is preferred over measures that count the number of correct or erroneously imputed alleles or genotypes. This follows readily from the observations that (1) imputation based solely on allele frequency quite naturally leads to an imputation accuracy of zero while the resulting imputation error rate depends on the MAF of the locus; and (2) that imputation accuracy is more sensitive to errors at loci with increasingly lower MAF, while imputation error rate actually shows the opposite relationship. The latter feature may be even more important in the near future, when imputation may be primarily targeting whole genome sequence data that holds relatively much more low MAF loci, compared with currently used SNP panels.
When imputation accuracy is assessed as a predictor for the accuracy of subsequent genomic prediction, we recommend that: (1) individual-specific imputation accuracies should be used that are computed after centring and scaling both true and imputed genotypes; and (2) imputation of gene dosage is preferred over imputation of the most likely genotype, as this increases accuracy and reduces bias of the imputed genotypes and the subsequent genomic predictions. Measuring imputation performance correctly will be increasingly important in the future when many of the imputation tasks will involve sequence data. Sequence data has a much greater proportion of loci with low MAF than SNP data and therefore metrics that depend on MAF will give very misleading results.
Acknowledgement
The authors acknowledge financial support from the Dutch Ministry of Economic Affairs, Agriculture, and Innovation (Public–private partnership ‘Breed4Food’ codes KB-12-006.03-004-ASG-LR and KB-12-006.03-005-ASG-LR).