


Numbers should matter when it comes to determining who gets what in a legislature. Democracy, at its most basic, demands full and fair representation, and political actors push constantly to maximize their share of seats. The greatest compromises at the U.S. constitutional convention all revolved around this question, with delegates seeking representational advantages for their state or section. In more recent times, advocates for descriptive representation contend that, as members of underrepresented groups, more women or African Americans in a legislature are always preferable to fewer, though supporters of substantive representation suggest that this is true only if the numbers of all legislators promoting the group's interests are not diminished (Canon Reference Canon1999; Grose Reference Grose2011; Kanthak and Krause 2012; Swers Reference Swers2002; Swain Reference Swain1995; Tate Reference Tate2003). “Critical mass theory” explicitly argues that women will have a greater impact on legislative outcomes when their numbers grow (Childs and Krook Reference Childs and Krook2008). And, in comparative contexts, Gamson's Law holds that “parties forming a coalition government would each get a share of portfolios proportional to the seats that each contributed to the coalition” (Carroll and Cox Reference Carroll and Cox2007, 300; also Gamson Reference Gamson1961). The largest legislative blocs, in short, should have an outsized influence on decision making.
In the realm of state politics, scholars and reformers alike have long assumed that gaining more seats in a legislature would be the solution to the historical frustrations of big cities. Until the Supreme Court rulings of the 1960s mandating legislative districts of equal size, malapportionment was routinely cited as a leading explanation for the difficulties cities faced in promoting their legislative agendas. More legislative seats, everyone understood, translated to greater influence in the legislative process: the proposition has been axiomatic. “Traditionally, State governments have been unsympathetic arenas for cities,” Weir (Reference Weir1996, 24) argued. “Rural interests, vastly overrepresented in State legislatures, have usually dominated the political process.” With big-city delegations artificially reduced in size, malapportionment exaggerated rural influence in state legislatures, enhancing the ability of rural legislators to block urban initiatives (Ansolabehere and Snyder Reference Ansolabehere and Snyder2008; Baker Reference Baker1960, 93–94; Banfield and Wilson Reference Banfield and Wilson1963, 69–70; Weir, Wolman, and Swanstrom Reference Weir, Wolman and Swanstrom2005, 734; Wells Reference Wells1939, 111). The end of malapportionment, ironically, coincided with declining city populations. Weir, Wolman, and Swanstrom (Reference Weir, Wolman and Swanstrom2005) examine the challenges facing cities in recent years in the legislative process. “Since the 1960s,” they contend, “the political influence of cities in state legislatures has eroded as cities have lost population and representation” (734). Malapportionment has come and gone, but the conviction remains unchallenged that larger legislative delegations should strengthen a city's voice at the state level.
If size has its advantages, that news has not traveled to New York, Chicago, or Los Angeles. For more than a century's time, leaders of the nation's great cities have rarely celebrated their ability to secure necessary legislation in their state capitals, even though they have often sent very large delegations to those capitals. On the contrary, the great narrative in urban politics has been a story of unremitting hostility: despite the great number of legislative seats held by big cities, the rural hinterland has routinely risen up and frustrated urban initiatives and interfered with urban governance (Baker Reference Baker1960; Banfield and Wilson Reference Banfield and Wilson1963; Beard Reference Beard1912; Desmond Reference Desmond1955; Weir Reference Weir1996; Wells Reference Wells1939; Wiebe Reference Wiebe1967). We seek to unravel the paradox that, in the affairs of big cities and American states, there is no strength in numbers.
In this article, we examine the link between size and power by focusing on “district bills” to assess the challenges facing big cities in state legislatures. When cities have complained about legislative interference in their affairs—when Boston's residents chafed at the fact that their police commissioner was appointed by the governor (Shefter Reference Shefter1970, 1), when “St. Louis was subjected to virtually annual charter revisions by the Missouri legislature” (Griffith Reference Griffith1974, 212)—the evidence has always come in the form of district bills. Sometimes called “special legislation,” district bills are legislation targeted to a specific locality (or small set of localities). Because cities lack the powers to legislate in many areas on their own behalf (Frug Reference Frug1999), they require positive legislation at the state level to pursue a wide range of initiatives. As we discuss elsewhere (Gamm and Kousser Reference Gamm and Kousser2010), district bills include all bills that relate to a specific, identifiable place—including counties, towns, villages, cities, school districts, parks, airports, highways, churches, businesses, water districts, and local institutions. Only rarely (in 9% of cases) do these bills involve a transfer of funds to the local level. District bills do not include the major state health and welfare policies that disproportionately benefit urban dwellers. Almost always, district bills traffic not in funds or major programs but in authority, granting the locality the ability to conduct its business as its leaders and representatives define that business. One bill in our dataset, for example, authorized the city of New York to make loans to members of its teachers’ retirement system (1981 N.Y. S. 4408), whereas another made it a crime to possess the “green hide” of a raccoon or mink in Red River County, Texas (1941 Texas H. 794).
Examining passage rates of big-city district bills relative to district bills from other places, we find that big-city bills fail at very high rates. Indeed, as we show later, the biggest delegations have the highest failure rates. Why is this the case, when having more seats leads to more power in so many other political realms? We proceed to analyze reasons that big-city bills might face unusually steep obstacles to passage even when these cities control large blocs of seats in state legislatures. In the analysis, we consider an array of explanations: urban–rural hostility, partisan divisions, malapportionment, racial or ethnic differences, even the sheer number of bills emanating from big-city representatives. Although animus against immigrants seems to explain some of the challenges faced by big-city bills—we find that cities with high numbers of immigrants (relative to their states) have low passage rates, though we cannot prove that these low rates are due to anti-immigrant bias—no factor proves more important than the large sizes of urban delegations. It is not partisanship or rural hostility that explains the high failure rate of big-city bills; neither of these variables has explanatory power. Rather, it is the cities with the largest legislative delegations that face the greatest hurdles to passing their bills. Size proves a hindrance, we demonstrate, because a large delegation is more likely to be internally divided than a smaller delegation, muddling cues for others in the chamber. At least in the realm of district legislation, ending malapportionment and increasing delegation sizes appear to have harmed rather than helped the interests of big cities.
HOSTILITY, DEFERENCE, AND THE STRUGGLE TO PASS BIG-CITY BILLS
Great cities have consistently complained of difficulties in advancing their interests at the state level. Observers through the years have offered numerous examples as well as a straightforward explanation of the problem: hostility. In the telling, rural, suburban, exurban, upstate, and downstate legislators have joined forces throughout history to block bills sought by large cities and to pass legislation antagonistic to the interests of the metropolis. As George Washington Plunkitt declared in 1905 (quoted in Riordon Reference Riordon and McDonald1994, 59, 60),
New York City is pie for the hayseeds. . . . Did you ever go up to Albany from this city with a delegation that wanted anything from the Legislature? No? Well, don't. The hayseeds who run all the committees will look at you as if you were a child that didn't know what it wanted, and will tell you in so many words to go home and be good and the Legislature will give you whatever it thinks is good for you.
In 2008, more than a century after Plunkitt's grievance, David Gantt, a Rochester legislator, used his power as committee chairman to block legislation allowing New York City to install additional cameras to identify cars violating basic traffic rules. When asked why he would not allow a bill that was favored overwhelmingly by the city's delegation to come to the floor, Gantt responded cryptically, “That's for me to know and you to find out” (“Mr. Gantt Says No” 2008). In its editorial, the New York Times condemned the obstacles that the city faces in the state legislature when it seeks bills on its own behalf, observing that “it makes no sense for one upstate legislator to strangle progress—and safety—in New York City.”
That state legislatures are hostile arenas for city interests is a deeply rooted belief, grounded in the fact, as Frug (Reference Frug1999) points out, that all localities are dependent on the state for authority to pursue a wide range of goals. Whereas small-town representatives have rarely faced obstacles in pursuing their agendas, delegates from large cities have viewed the capitol as enemy territory. According to this narrative, rural and suburban legislators interfere in urban affairs over the objections of big cities, and they regularly kill bills sought by urban legislators, stifling a city's self-defined priorities (Baker Reference Baker1960; Beard Reference Beard1912; Desmond Reference Desmond1955; Wells Reference Wells1939; Wiebe Reference Wiebe1967). The legislative “veto” over urban preferences looms large in the literature and in day-to-day criticisms. “Not only do legislatures interfere with the fundamental rights and pettiest details of city affairs,” Beard (Reference Beard1912, 32) noted; “their consent is required for some of the most insignificant undertakings on the part of municipal governments.” As Desmond observed in 1955 (296), “States strangle local initiative.”
A competing body of research, however, has uncovered little evidence of sinister conspiracies driven by rural, suburban, and outstate legislators. According to Derge (Reference Derge1958, 1065), “The traditional belief in bitter conflict between metropolitan and non-metropolitan areas in the state legislature must be rejected for Illinois and Missouri,” the two states he examined. In fact, bills affecting big cities have typically been introduced in the legislature by big-city representatives, as Shefter (Reference Shefter1970), Teaford (Reference Teaford1984), Allard, Burns, and Gamm (Reference Allard, Burns and Gamm1998) and Burns et al. (Reference Burns, Evans, Gamm and McConnaughy2009) note, and legislators have tended to treat one another's district bills with deference. “State legislatures have routinely deferred to local governments,” Allard, Burns, and Gamm (Reference Allard, Burns and Gamm1998, 294) found, reporting that nearly all of the bills governing Detroit and Boston were introduced by state legislators from these cities.
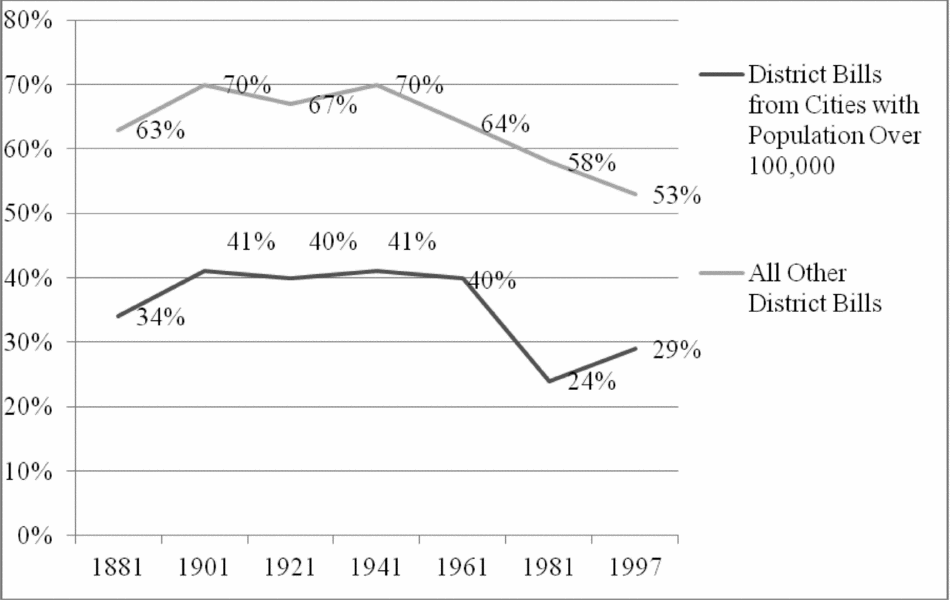
But this emphasis on deference and on the ability of big-city delegations to exercise agenda control has neglected a persistent, complementary truth, uncovered on a large scale for the first time in this research project: big-city bills fare much worse in state legislatures than bills from other cities and towns across the state. Figure 1, based on data we collected from 13 states for the period 1880–2000, illustrates our basic finding. The figure examines passage rates for bills introduced into the lower house of the state legislature, with data collected at 20-year intervals. (We see an identical pattern when we look at the number of bills that pass both houses and are signed into law by the governor; we provide a parallel figure in the Online Appendix Figure A1.) Every bill in our database is a district bill: each affects a specific locality and is introduced in the legislature by someone from that place. Over time, there is a large, stable gap in passage rates between big-city bills—defined here as district bills introduced by legislators from cities of at least 100,000 people—and bills from smaller places. Year after year, while most bills affecting smaller districts pass, most big-city bills fail.
Comparing Passage Rates of Big-City vs. Other District Bills, over Time
Notes: The data for this figure are drawn directly from the legislative journals of Alabama, California, Illinois, Massachusetts, Michigan, Minnesota, Montana, Nebraska, New York, Texas, Vermont, Virginia, and Washington.

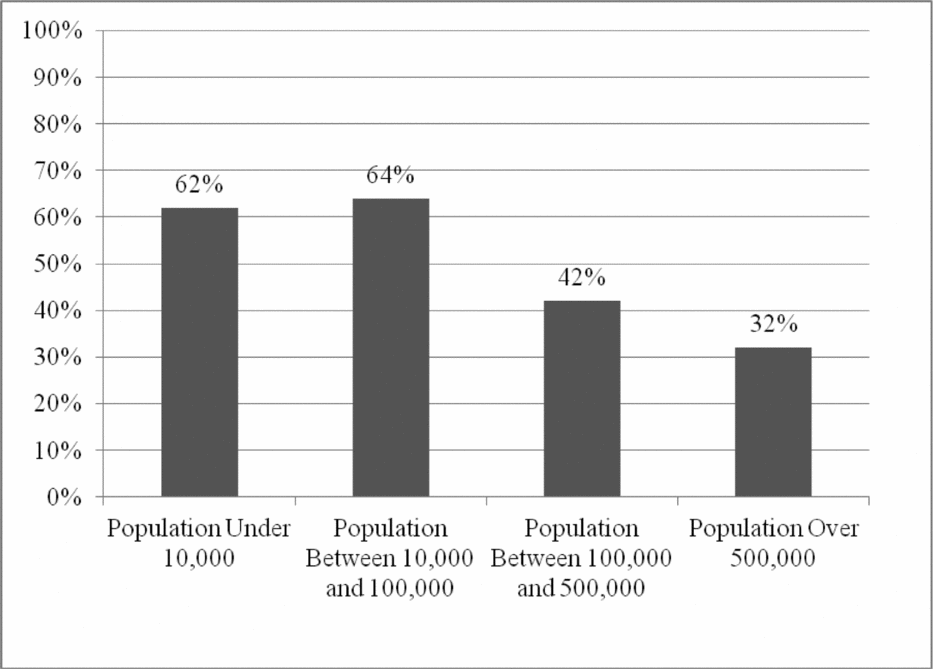
If deference has characterized state legislative action, then documenting and explaining this failure rate are crucial to understanding why state legislatures have long been seen as hostile arenas for big cities. Derge (Reference Derge1958), Teaford (Reference Teaford1984), Allard, Burns, and Gamm (Reference Allard, Burns and Gamm1998), and Burns et al. (Reference Burns, Evans, Gamm and McConnaughy2009), who focus on patterns of deference, do not mention the high failure rate of big-city bills in their analyses.Footnote 1 In fact, we are aware of no previous study that documents and explains this failure rate. Our data, however, show that, as state legislators seek to advance their district's agenda at the state level, those from the biggest places enter the race handicapped. Figure 2 draws on the same data as Figure 1, but aggregates the data by the size of the locality, without regard to time period. The figure displays data for four types of places—localities with fewer than 10,000 people, those with populations of 10,000 to 100,000 people, those with populations of 100,000 to 500,000 people, and cities of at least 500,000. The pattern confirms the centrality of city size to legislative success. Larger cities struggle to pass bills, when smaller places do not. The burdens of size grow dramatically when cities reach at least 100,000 in population and increase even more for cities with populations over 500,000. Historically, district bills from a small or medium-sized city have been twice as likely to pass as bills from cities as large as Chicago or New York. Later in the article, we show that this finding is not spurious; it cannot be explained away by differences in bill content or bill authorship, or by a crude bias against the single largest city in a state. Large cities do face special burdens in state legislatures, as scholars and urban leaders have contended since the nineteenth century, and the burdens grow with city size.
Passage Rates of District Bills, by City Population
BARRIERS TO THE SUCCESS OF BIG-CITY BILLS
Representatives from towns, villages, suburbs, exurbs, and even mid-sized cities expect, as a matter of routine, that their district bills will become law in large numbers. So why is the story different when we look at large cities? We offer five possible explanations. The first of these theories is grounded in the dynamics of the legislature itself, where habits of deference are facilitated when a local delegation is unified and where unity is best achieved when the delegation is small. The theory is that the high failure rates of big-city bills are due to fractiousness within that city's own large delegation, not to animosity from others in the state. Three other theories, and the hypotheses that flow from them, measure rural and suburban hostility in straightforward fashion: hostility against cities with large populations, against cities with many immigrants or African American residents, and against cities whose dominant political party differs from that of the rest of the state. Finally, we consider the possibility that the large number of big-city bills may explain their relatively low passage rates.
The City Has a Large Legislative Delegation
Perhaps big cities lost as much as they gained in the apportionment revolution of the 1960s. Indeed, the discrepancy in passage rates has grown with time. As Figure 1 shows, passage rates for big-city bills were lower in 1981 and 1997 than in any previous year in the study, and in 1981 passage rates were more than twice as high for bills affecting other places in the state than for those affecting big cities. The increased representation of metropolitan interests in state legislatures—while empowering city residents on an array of statewide issues and resulting in fairer transfers of wealth to cities and suburbs—may have harmed big-city delegations seeking passage of district bills.
Large delegations have more difficulty speaking with a single voice than do small, compact delegations. “In the case of a small city represented by a single legislator in each house, what passes for the will of the entire house is actually the will of the particular member,” according to McGoldrick (Reference McGoldrick1933, 2). “His party colleagues stand ready not only to accept his judgment as to all matters relating solely to his district but to enact it into law.” The observation that there are costs to increasing a delegation's size fits with patterns seen in congressional studies, including Kanthak and Krause's (2012) work on the representation of minority interests. Voting “cues” (Kingdon Reference Kingdon1973) presumably assume special importance in state legislatures, as Burns et al. (Reference Burns, Evans, Gamm and McConnaughy2009) argue, especially on low-information matters such as district bills. Legislators habitually support the district bills of their colleagues, but deference becomes impossible when the city's own legislators are at odds. According to this theory, size itself leads to division—and division can fatally undermine efforts to persuade others in the legislature to support a district bill. Disagreement within a delegation may come from a simple lack of coordination among the members themselves, from true conflict over policy or along party lines, or from the difficulty of distinguishing bills affecting small parts of a city from those dealing with the city as a whole.
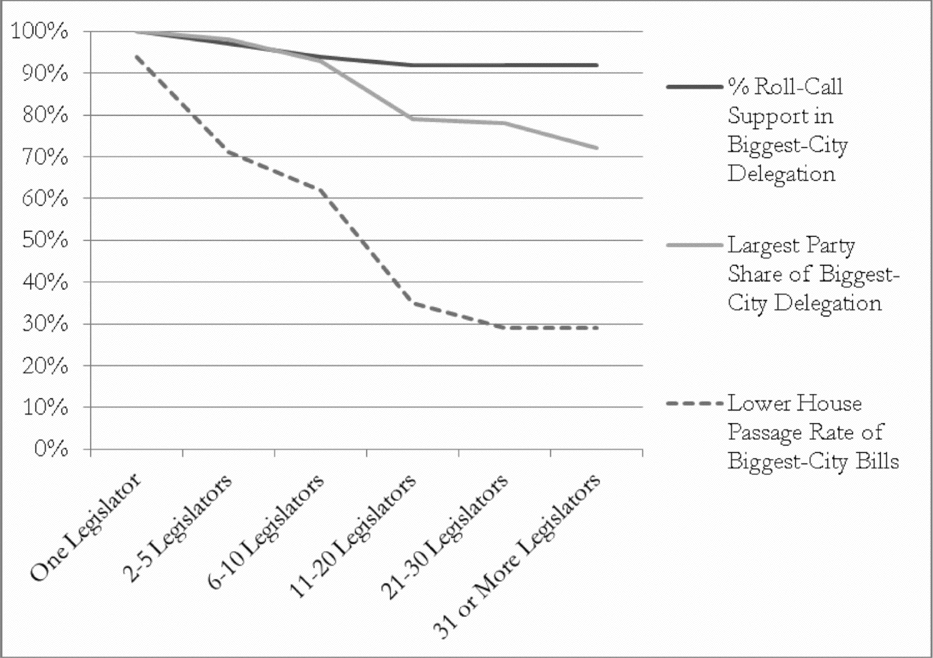
Larger delegations, our data show, are more likely to be internally divided, and their bills are less likely to pass. Drawing on data we present in the next section, we considered two measures of delegation cohesion—party unity and roll-call votes. By both measures, as Figure 3 demonstrates, delegations grow more divided as they grow larger in size. One-person delegations are, of course, perfectly united on roll calls and in party identification. These measures of cohesion trend downward as delegations grow, falling sharply once there are at least 11 legislators in the delegation. The largest delegations are most sharply divided along party lines. Roll-call data, too, suggest greater division as delegation size grows. While the typical bill has passed or failed without a roll-call vote, and while most roll-call votes have been unanimous, delegation unity on roll calls corrodes steadily as delegation size becomes larger. As Figure 3 shows, not only do delegations become more divided as they grow in size but passage rates also fall dramatically. The changes in passage rates are smooth and consistent across each step of increasing delegation size—from 95% for bills introduced by one-person delegations to 29% for bills introduced by the largest delegations. Looking only at the roll-call votes, we find that division in the delegation predicts higher levels of opposition in the whole chamber (with a statistically significant correlation of 0.58). When a delegation divides, the entire floor is more likely to divide. But we need to look beyond roll-call analysis: the vast majority of bills fail because they never come to the floor for a vote, and the great majority that come to a vote pass, most of them unanimously, without roll calls. Because we predict that the effect of shifting from a one-person delegation to a two-person delegation will have a much greater impact on the unity and visibility of the group than the shift from a 51-person to a 52-person delegation, we use the natural log of delegation size in our regression models to test this hypothesis.
H1. As the size of the city's delegation in the legislature (logged) increases, passage rates of that city's district bills will fall, ceteris paribus.
Delegation Size Leads to Delegation Division and then to Defeat
Notes: Roll-call analysis based on 163 bills that came up for a roll-call vote; all other analyses based on the full sample of 747 district bills from the biggest city in each state. The “Largest Party Share of Biggest-City Delegation” reports the share of seats in the city's legislative delegation that is held by the largest faction in that delegation (either the Republican Party, the Democratic Party, or a third party).
The City Is Big and Threatening
City size alone may be sufficient to explain why big-city bills fail at high rates. Especially in states dominated by a very large city, “a bipolarization of attitudes may tend to develop,” V. O. Key (Reference Key1956, 230) wrote in American State Politics. “The outstate has its anxieties about metropolitan domination.” Sitting in the rural hinterland of a state—or in the suburban fringe or in another smaller city—legislators might look at the concentration of population and resources in the big city with jealousy and concern. Some cities easily dominated all other places in their states. San Francisco, for example, was home to 27% of all Californians in 1880, and a majority of all New Yorkers (7.5 million people, or 55% of the state) lived in New York City in 1940. Meanwhile, in other states, even their largest cities were tiny. Walla Walla, Washington, had a population of 3,588 in 1880, and Burlington, Vermont, had a population of 11,365 that year; even in 2000, Burlington's population was only 38,889. We drew on U.S. Census Bureau data reported in Gibson and Jung (Reference Gibson and Jung2005) for cities and in Haines (Reference Haines, Carter, Gartner, Haines, Olmstead, Sutch and Wright2006, 1-180–1-365) for states to compute each city's percentage of the state population, and expect that as it rises, legislative support for its bills will fall.
H2. When a city comprises a larger percentage of the state's population, passage rates of that city's district bills will fall, ceteris paribus.
The City Is Alien and Different
Many studies demonstrate the propensity of individuals to favor members of their own ethnic, racial, or tribal group and to discriminate against outsiders (Bernhard, Fischbacher, and Fehr Reference Bernhard, Fischbacher and Fehr2006; Choi and Bowles Reference Choi and Bowles2007; Duggan Reference Duggan2006; Habyarimana et al. Reference Habyarimana, Humphreys, Posner and Weinstein2007; Kristof Reference Kristof2008; Putnam Reference Putnam2007). Trust and cooperation, this scholarship suggests, flourish more in homogeneous than heterogeneous environments. In many states, the populations of big cities look different from those in the rest of the state, not just larger—an emphasis of classic studies of the urban machine such as Bryce (Reference Bryce1891) and Banfield and Wilson (Reference Banfield and Wilson1963)—and we hypothesize that this difference brings distinctive policy demands and may even breed hostility from outstate representatives.
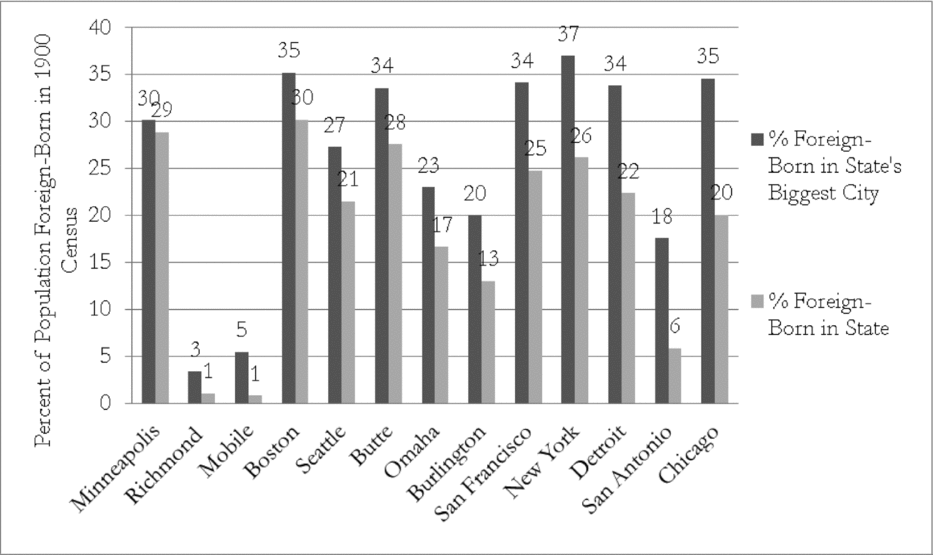
We measured this difference, first, by calculating the number of foreign-born people in each city relative to their proportion in the rest of the state. We gleaned data on nativity directly from statewide census volumes for each of the years under study. The demographic divergence between states and their leading cities could be great: foreign-born whites made up 30% of Chicago's white population in 1920, but just 11% of the rest of the state's white population, whereas modern-day Birmingham, like the rest of Alabama, is barely more than 1% foreign born. Figure 4 displays the demographic distances between metropolitan populations and states in 1900, arraying states by the size of the gap between the state and the big city in their foreign-born populations. This gap is small—and, we predict, big-city passage rates should be relatively high—in low-immigrant states with low-immigrant cities, such as Virginia (Richmond) and Alabama (Mobile), as well as in uniformly high-immigrant states such as Minnesota (Minneapolis) and Massachusetts (Boston). By contrast, far more residents of Chicago and San Antonio were foreign born than the residents of Illinois and Texas, respectively. We expect that this demographic divide makes the jobs of legislators from those cities especially difficult. Thus we hypothesize that the differences in nativity—between the relative numbers of foreign-born and native-born residents in the big city and the rest of the state—will result in lower passage rates for big-city bills, because we expect difference to lead to animosity.Footnote 2
Foreign-Born Population Percentages in Biggest Cities and in States, 1900
To test another form of demographic difference, we calculated the number of African Americans in each city, again in proportion to the rest of the state. Although race is more salient than country of birth in defining difference in American society, we recognize that a simple count of numbers does not necessarily indicate political power. African Americans were disfranchised in the South for most of the period of our study, and their numbers in most northern cities were relatively small. Through the 1970s, the cities in our sample with the largest black populations were all located in the South—which was not a region where big-city representatives could be expected to represent black interests or, at least as important, be regarded by fellow legislators as tribunes for black interests. In incorporating African American urban populations in our model, we consider the possibility that African American populations matter only in the North and in the post-1965 South and even the possibility that only after 1965 do they matter politically in state legislatures anywhere. Separately, we identify every city in our sample with an African American mayor to test the hypothesis that bills from these cities might face greater hurdles to passage.
H3. As the proportion of foreign-born individuals in a city's population grows relative to that in the rest of the state's population, passage rates of that city's district bills will fall, ceteris paribus.
H4. As the proportion of African Americans in a city's population grows relative to that in the rest of the state's population, or in a city with an African American mayor, passage rates of that city's district bills will fall, ceteris paribus.
The City Is Harmed by Party Differences
Perhaps partisan disagreements disrupt the system of logrolls that characterizes the general treatment of district bills. Party tensions could emerge when the city's delegation is itself divided along party lines. They can also occur when the party controlling the city opposes the party controlling the rest of the state (McGoldrick Reference McGoldrick1933, 2). New York City, a Democratic metropolis, often confronted a hostile Republican state legislature, as Teaford (Reference Teaford1984, 95) and Bridges (Reference Bridges1984, 135) show, and Democrats in Chicago (Steiner and Gove Reference Steiner and Gove1960, 54) and Boston (Erie Reference Erie1988, 204) also faced antagonism from Republicans hailing from other parts of the state. Partisan differences can be vast. In 1941, when 88% of Boston's delegation was Democratic, 69% of the rest of the Massachusetts lower house was Republican. We expect that party differences—measured either at the individual or the aggregate level—will depress passage rates of big-city bills.
H5. City bills introduced by a member of the legislative majority party will pass at higher rates than bills with a minority party author, ceteris paribus.
H6. As majority party control of a city increases relative to the partisan legislative majority, passage rates of that city's district bills will rise, ceteris paribus.
The City Introduces Too Many Bills
Perhaps the high failure rates of big-city bills are a function not of hostility but instead of the logistical challenges of managing a large body of legislation. In many cases, the largest cities make the greatest demands on the legislature, and the proliferation of bills from a great metropolis may itself be sufficient to undermine norms of deference to local legislation. Rather than seeking approval for a handful of targeted district bills, representatives from the big city may find their energies spread among many different priorities. At least at the extremes, in state legislatures with unusually high and low numbers of bills to consider, passage rates are negatively correlated with workload (Squire and Moncrief Reference Squire and Moncrief2010, 164). In some states, the number of big-city bills is immense—in 1981 the New York legislature considered 612 bills from New York City—whereas in other states the burden is much smaller. There were just 21 Detroit bills in the 1941 Michigan session and 5 Omaha bills in the 1961 Nebraska session. The great variance among cities on this dimension allows us to test the proposition that the number of big-city bills is negatively correlated with passage rates.
H7. As the number of a city's bills increases, passage rates will fall, ceteris paribus.
OUR DATA: TRACKING BILLS THROUGH THE LEGISLATURE
We draw in this article on an original sample of 1,736 district bills from cities large and small to show that big-city bills fail at higher rates than bills from smaller places—that the scale of a place affects legislative success. These 1,736 bills come from our complete database of 165,284 bills, which includes all bills introduced into the legislatures of 13 states—Alabama, California, Illinois, Massachusetts, Michigan, Minnesota, Montana, Nebraska, New York, Texas, Vermont, Virginia, and Washington—at 20-year intervals, beginning in 1881 and extending throughout the twentieth century. In selecting states, we sought to maximize variation along a variety of dimensions, while assembling a sample that was representative of all 50 states.Footnote 3 We intentionally overrepresented states with big cities, given the focus of this project, but we otherwise worked to include states from every region of the country and to study states that vary, historically and at present, on measures of urbanization, industrialization, legislative professionalism, careerism, and party structure.
Our data collection effort began by working with a team of other scholars and research assistants to study the subjects of all of the bills introduced in these sessions. (For a discussion of this process and levels of intercoder reliability, see Gamm and Kousser Reference Gamm and Kousser2010, 158–61, 166–67.) From each of the 91 sessions, we tracked the full legislative historiesFootnote 4 of 50 bills—40 chosen randomly from all bills introduced dealing with local affairs and 10 additional bills (unless fewer than that number existed) dealing with the state's biggest city. Among the 40 bills selected from each session, most were not district bills: they affected all counties or towns in the state, not a specific county or town.
The 1,736 bills we analyze in the first empirical section of this article represent only the district bills in our database. By definition, these bills refer to a particular place in the state—perhaps a county, a city, a village, an area near a particular church or school, a judicial district, a business, even an individual with an address—and they were introduced by a member of the lower house representing that area. Omnibus appropriations bills do not appear in this database, but appropriations bills affecting a specific district are included alongside all other district bills. By presenting a model of passage rates for these 1,736 bills, our first empirical section explores the impact of a city's size on passage rates, controlling for a host of other factors that might account for the differing levels of legislative success by large and small cities.
Of the 1,736 bills, we identified 747 that focus on the largest city in each state, and in the second part of our empirical analysis we draw on these 747 bills to evaluate our competing theories for why failure rates are related to city size. These cities differ dramatically in size and character, ranging from New York and Detroit to Omaha and Great Falls. Included among these 747 bills are bills naming an area dominated by the state's biggest city—such as counties (Chicago's Cook County), authorities and commissions (Boston's Metropolitan Park Commission), and geographic areas (Seattle's Puget Sound)—as well as institutions located in the city, such as UCLA or a corner barber shop in Richmond. After tying each district bill to a locality, we then collected comprehensive information on the localities themselves and on the people representing them in the state legislature.
Almost all the data we analyzed came from original sources. We relied for our data on archives, legislative journals, and newspapers. To identify legislators as rural, urban, or suburban, we studied census records and state-specific sources to reconstruct metropolitan areas for each year in our study. In metropolitan areas, we coded the large cities as “urban” and the remaining places as “suburban”; in the remainder of each state, medium-sized and large cities were “urban” and other places “rural.” (Given that legislative districts were difficult to reconstruct and often encompassed a range of localities, we coded each legislator as rural, urban, or suburban according to the location of his or her home address.) After discovering serious inconsistencies in published records of session frequency and length, we collected all these data ourselves directly from legislative journals.
ANALYSIS: OUR MODELS AND FINDINGS
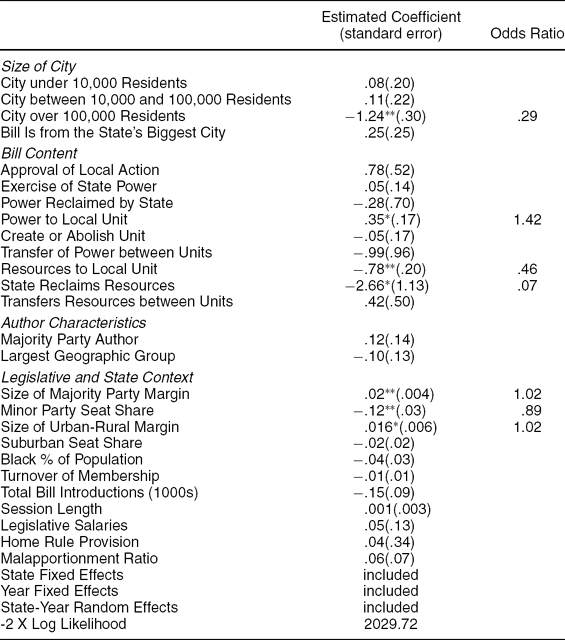
Using our dataset of 1,736 district bills drawn from jurisdictions large and small, we begin this section by exploring the argument that district bills from big cities fail at higher rates than other district bills. In essence, our multivariate analysis takes a skeptical look at the performance gap identified in Figure 1 to see if it truly reflects a bias against big cities or if it can be explained away by other differences between these two types of bills. As the results in Table 1 will show, bills from larger cities indeed fare worse in state legislatures. Next, we seek to explain why big-city bills lose so often by turning to an analysis of the 747 bills on which we have collected richer data. We test Hypotheses 1–7 using these bills, finding strong support for the conjectures that cities with larger legislative delegations or more foreign populations fare most poorly in state capitols.
Explaining Probability of House Passage, All District Bills
Notes: N = 1736. Table entries are estimated coefficients and (standard errors) from models with random coefficients for each legislative session, estimated using GLLAMM in Stata 11.0. * = p < .05 and ** = p < .01 in two-tailed tests.
Do Big-City District Bills Really Fail at Higher Rates?
Although Figure 1 shows that bills from larger cities fare worse than those from smaller places, this apparent effect might be driven not by size but by other consequential differences between district bills from large and small cities. It might reflect a simple reaction against bills emanating from a state's largest city, no matter whether it was a major metropolis or not. Second, it could be driven by variation in the content of legislation. Finally, big-city bills may lose more often if they are more likely to be authored by members of the minority party or geographic faction in a statehouse. We outline each of these three alternative explanations of the pattern shown in Figure 1 and propose empirical measures (shown in boldface) to capture the causal factors they identify. Our multivariate model, which draws on our full set of 1,736 district bills, allows us to control for those factors and to hold constant other variables in order to isolate the impact of a city's population.
The first alternative explanation that we consider is that the poor performance of bills from big cities could be explained by a crude bias against the biggest city in each state. The city that looms the largest in a statehouse may stir resentment, even if it is relatively small in a national context. We take this into account by including in our analysis a dummy variable indicating that a bill comes from a state's largest city in a given session. Importantly, this variable does not perfectly correlate with city population. After all, in some states, such as Vermont and Montana, even the largest city is little more than a small town. By contrast, San Francisco (from 1921 onward), Los Angeles (before 1921), Dallas, St. Paul, and Buffalo are very large cities that do not rank as the largest in their state. This creates a divergence that allows us to distinguish between the effects of being a state's biggest city and a pure population effect.
Second, big-city bills may differ in some qualitative way from bills affecting smaller cities and towns. The needs of large cities are different not only in scale but also in substance from those of other places. Until recent decades, every large city supported large manufacturing centers and depended on a complex web of rail lines, ports, and power supplies to allow these industries to flourish. Large cities have also attracted great concentrations of people, requiring water and sewage lines on a scale unknown to the ordinary city or town in a state, as well as sophisticated systems of mass transit. Perhaps, then, big cities have historically sought bills that were substantively different from those sought by other localities, and perhaps this difference in bill content explains the high failure rate of bills from the biggest cities. To test this hypothesis, we analyze the content of bills introduced into the various state legislatures, distinguishing the bills from the biggest cities from all other district bills. The Online Appendix Table A1 lays out the categories that we developed to categorize each bill's content. We constructed 17 categories, read descriptions of each bill, and then identified its bill content according to one of these categories. As Online Appendix Figure A2 shows, we discovered marked similarities between the full set of district bills and the subsample of bills from the biggest cities. Therefore the poor performance of cities in these legislatures does not appear to be a product of differences in the substance of these bills, because there is little difference on average between the types of bills emanating from large and small cities. Still, to account for the impact that bill content might have on any individual piece of legislation, we include indicators for these content categories in our multivariate analysis.
The third alternative explanation we consider is that bills from the biggest cities fail because their representatives are distinctive in some fashion. Here we explore two possibilities: that the big-city representative introducing the bill is in the minority party or in the minority geographic faction. Whereas in the next section of this article, we analyze the impact of minority status on legislative success using our smaller sample of bills, in this section we consider the impact of this same factor in our full dataset of 1,736 district bills. Our strong prior assumption is that members of the majority party will give deference to each other's district bills, because they have little to gain by taking away the electoral tools of their co-partisans. By contrast, if they block district bills authored by members of the minority party, they could secure an electoral benefit for their party's challengers for these seats. If this logic prevails, majority status will lead to higher passage rates. Historically, many states have been fractured more by geographic differences than by partisan splits, so we also look at geographic factions to test the possibility that the identity of the person introducing the bill explains success or failure. Because geography creates a salient division within many legislatures, we expect that members of the largest geographic faction—urban, suburban, or rural—will discriminate against district bills introduced by their rivals for the same reason that the majority party might wish to block the minority. To test these two hypotheses, we used party rosters and information on district geography gleaned from an array of archival sources to code the introducer's party (and faction), determine which party (and faction) controlled the lower house of the legislature, and then identify whether the introducer is in the majority or minority party (and faction).
Our multivariate models include other characteristics of the states and sessions in which these district bills were introduced. Prior research (Gamm and Kousser Reference Gamm and Kousser2008) explores the causal linkages between these factors and the fate of all types of district bills in greater depth; here, we treat them as controls to be held constant. Chief among these are measures of the homogeneity of the legislature in partisan and geographic terms, and of the state in racial terms. Our analysis of all district bills found that they pass at sharply higher rates as the majority party's margin of control grows, with deference prevailing in one-party legislatures but collapsing when the parties are divided evenly. We also found that increases in the share of seats held by minor parties—another mark of division—lower passage rates. We use our partisan categorization of individual legislators to construct these aggregate measures. We also use our geographic coding of legislators to include the share of seats held by suburban members.Footnote 5 We draw on Census Bureau figures to measure the percentage of the state population that is African American in each year, because many state studies have found that diversity leads to more conservative policy outputs (Grogan Reference Grogan1994; Kronebusch Reference Kronebusch1993; Plotnick and Winters Reference Plotnick and Winters1985). To test the hypothesis that patterns of mutual deference collapse when legislative time horizons are shortened—an idea suggested by Axelrod and Hamilton's (Reference Axelrod and Hamilton1981) finding that cooperation in prisoner's dilemma games can be achieved when play is repeated—we include the level of legislative turnover (taken from Burns et al. Reference Burns, Evans, Gamm and McConnaughy2008, Table 1a) in our models. We control for the total number of bills introduced in a session, gathered from legislative archives, to account for the possibility that legislators forced to deal with many bills in a session will have less time to scrutinize each of them and be more likely to pass them all. We also control for the length of a legislative session, measured in legislative days using the archival sources first documented in the appendix to Gamm and Kousser (Reference Gamm and Kousser2007), as well as legislative salaries as measured in proportion to state per capita incomes in Burns et al. (Reference Burns, Evans, Gamm and McConnaughy2008, Table 4), expecting that more professional legislatures may have the time to pass more district bills of all types. Finally, we control both for whether or not a state grants broad home rule powers to its cities (Krane, Rigos, and Hill Reference Krane, Rigos and Hill2000) and for the level of malapportionment, measured by the ratio of the least populous counties’ voting power in the legislature divided by the power held by a state's biggest counties, averaged across a state's two houses in 1910 and calculated by David and Eisenberg (Reference David and Eisenberg1961, 15). Our expectations are that cities granted home rule will only come to the legislature with their more complex problems, and thus fare worse than cities without home rule, and that malapportionment should hurt big cities.
Table 1 reports the results of a logit model on our full sample of 1,736 district bills predicting whether a bill passes out of the lower house or fails at any prior point in the process. (In Online Appendix Table A2, we report very similar results from a parallel model explaining whether each bill became law.) Because the explanatory variables are measured at different levels—a bill's authorship, its content, and city size at the level of an individual bill; the legislature's party structure and other characteristics at the level of a legislative session—we use multilevel modeling techniques to acknowledge this data structure explicitly. Each bill is nested within the environment of a legislative session and is subject to the same subtle and unmeasured forces that affect other bills in the same session. We thus include random effects for the 87 sessions that we analyze here,Footnote 6 as well as state and year fixed effects to recognize the other hierarchies and potential for autocorrelation in our dataset, and estimate the model using the GLLAMM program (Rabe-Hesketh, Skrondal, and Pickles Reference Rabe–Hesketh, Skrondal and Pickles2004) in Stata 11.0.
The results of this estimation show that the performance gap between legislation from big and small cities, which is so clear in Figure 1, remains strong and significant when we hold constant three alternative explanations of this gap, along with variables capturing the systematic and idiosyncratic features of legislative sessions. Leaving the 513 bills from counties and other localities as the reference category, we look at how bills from cities of different sizes—whether or not they happen to be the biggest city in a state—fare. Bills from cities with populations less than 10,000 or between 10,000 and 100,000 residents do just as well as district bills from counties, the insignificant coefficients show. But bills from cities with more than 100,000 residents do much worse.Footnote 7 The coefficient on this category is negative and significant at the 99% confidence level. One way to get a sense of the substantive scale of this effect is to calculate an odds ratio, which reports the factor by which a one-unit increase in an independent variable either boosts or lowers the legislation's chances of passage.Footnote 8 The odds ratio for the City over 100,000 Residents indicator variable is 0.29, showing that bills from any city of this size are less than a third as likely to pass as bills from small cities or counties, all else equal. Perhaps paradoxically, but confirming the contention of a long literature in urban politics, major metropolises really do lose more often in state capitols when it comes to district bills.
Other results of our model reveal additional intriguing patterns. The insignificant coefficient on our indicator that a bill is from the state's biggest city shows that, for cities of a given size, a predominant position in a state poses no additional penalty. Bills from Burlington, the largest city in Vermont, do just as well as bills from other small cities, and bills from Houston (Texas's biggest city in the modern era) do no worse than bills from its rival city of Dallas. It is population size itself that matters. Using our measures of the policy areas addressed by each piece of legislation shows that some aspects of bill content matter. Bills giving power to a locality pass at higher rates, whereas bills sending resources either down to the city or county or back up to the state pass much less often. Still, because bills from the biggest cities propose the same sorts of policies contained in other district bills—as Online Appendix Figure A2 shows—holding constant the content of these bills does not explain away the big-city effect.
Neither does controlling for who introduces them. Surprisingly, district bills authored by a member of the legislature's majority party do no better than bills with a minority-party author.Footnote 9 Although one might expect the party cue to be powerful, this finding shows that the rule of universalism applies to district legislation in the states much as it does to district spending in the U.S. Congress (Fenno Reference Fenno1966; Ferejohn Reference Ferejohn1974; Schattschneider Reference Schattschneider1935). Similarly, bills authored by a member of the state's largest geographic group do no better, on average, than bills that come from other geographic factions, an additional form of universalism. Looking at the other control variables, we see that, consistent with earlier work on a more limited sample of district bills (Gamm and Kousser Reference Gamm and Kousser2008), district legislation is more likely to win when one party or geographic faction (urban, rural, or suburban) dominates a house, but lose more often when the percentage of seats held by minor parties rises. Other factors, such as the suburban seat share, the racial diversity of a state's population, legislative professionalism, membership turnover, home rule, and malapportionment, do not seem to matter. The primary lesson of this analysis is that the gap in performance between big-city bills and other district legislation displayed in Figure 1 persists, even with a myriad of controls in place.
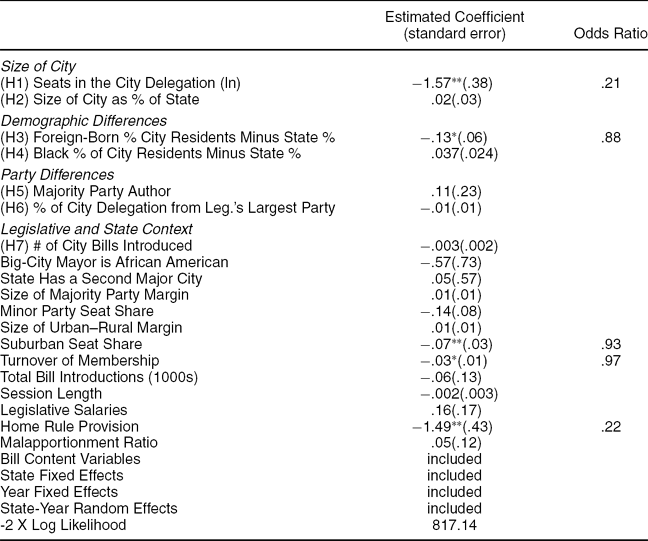
Explaining Probability of House Passage, Subsample with Richer Data
Notes: N = 747. Table entries are estimated coefficients and (standard errors) from models with random coefficients for each legislative session, estimated using GLLAMM in Stata 11.0. * = p < .05 and ** = p < .01 in two-tailed tests. This model includes all of the bill content categories shown in Table 1, but we do not report coefficients for the sake of clear exposition.
Why Do Big-City Bills Fail So Often?
Now that we have shown that district bills from cities with larger populations fare worse—and that there is nothing distinctive about the largest city in a state—we ask why big-city bills fail at these high rates, drawing on our subsample of 747 bills. This sample provides the wide variation in population size, levels of representation in the statehouse, demographics, and partisan control that we need to test Hypotheses H1–H7. To perform this analysis, we estimate the same sorts of multilevel models of house passage that we did in the prior section and report a parallel model predicting whether a bill became law in Online Appendix Table A2. Again, the model includes state and year fixed effects, session-level random effects,Footnote 10 measures of bill content, and a host of substantive control variables.
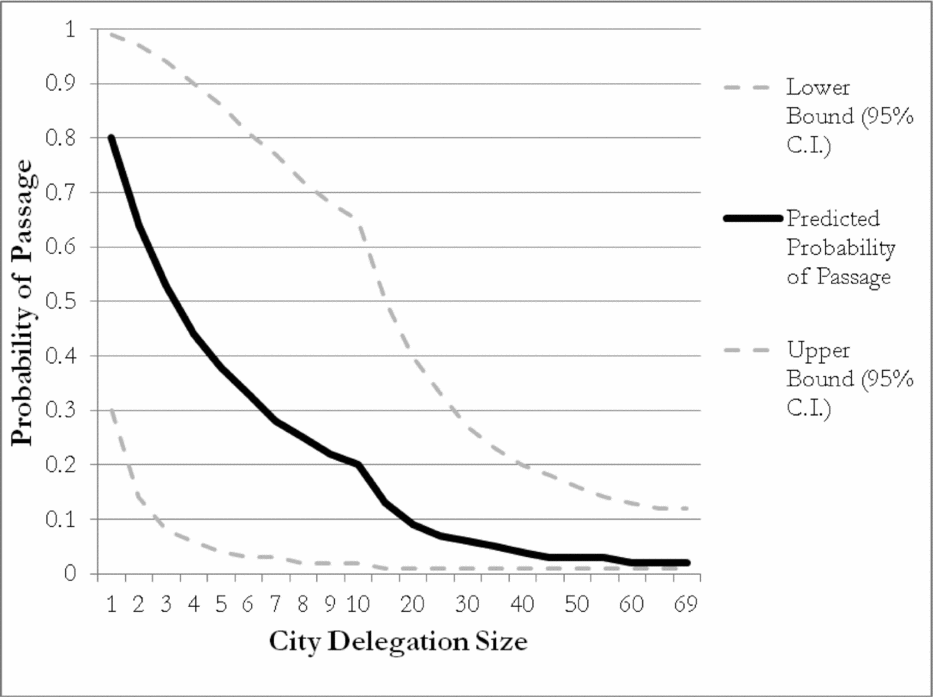
The results reported in Table 2 present a clear explanation of why district bills from cities such as New York, Chicago, and Detroit fare so poorly: legislation from a city is more likely to lose when that city's legislative delegation is large and when the city houses many more immigrants than the state. The first result strongly confirms Hypothesis H1. The first row in the table reports a negative coefficient on the (logged) delegation size that is significant at the 99% confidence level. It is not driven by an outlier; this finding is robust to the exclusion of any of the cities in our dataset. One way to get a sense of the magnitude of this effect is to see how increases in the size of a city delegation change the predicted probability of a district bill's passage in a typical session.Footnote 11Figure 5 presents these effects graphically, across the full range of variation in delegation sizes in our sample. It shows that when only one legislator represents a city, a typical district bill is likely to pass 80% of the time. Yet when the delegation size increases to two members, allowing the possibility of internal disagreement, the predicted probability of passage declines sharply to 64%, and then falls again to 53% with a delegation size of three. Passage rates continue to drop off as delegation size increases all the way to its maximum value in our data (the 69 house members representing Chicago in 1961). Yet the declines are steepest moving from one legislator to a handful, holding all other factors equal.
Substantive Impact of City Delegation Size on Passage Rates, Using the Subsample with Richer Data
Our multivariate finding is buttressed by a look at the impact of the reapportionment revolution on a state-by-state basis. Reapportionment brought an exogenous shift in delegation size, holding population largely constant, and all of the cities that saw their delegation sizes jump between 1960 and 1980 also saw their legislative success plummet over that time period.Footnote 12
What logic drives this result? We show in Figure 3 that bigger delegations create more opportunity for internal division and that internal division leads to legislative defeat. The tight link between delegation size and passage rates buttresses that argument. It also suggests an answer to the puzzle of why, even after the reapportionment revolution, bills from big cities continue to lose more often than other district bills. Although the elimination of malapportionment gave big cities and other urban areas greater representation, it also saddled them with more representatives and thus increased the chances that their delegations might be internally divided. Bigger delegations may have been more likely to split on city bills than in the past, when only one or a handful of legislators represented the area, which may explain why their district bills fared so poorly in the 1981 and 1997 sessions.
Delegation size appears to be the main avenue through which large populations hurt big-city bills. We find no support for Hypothesis H2. Controlling for delegation size, cities that make up a larger share of the state's population do no worse than cities that are relatively smaller. We also include a dummy variable indicating that the state had a rival big city in that era, coded as 1 if the state's second-largest city was both (1) among the nation's 100 largest cities in the prior census and (2) at least half the size of the state's biggest city. This variable's impact also falls well short of significance, showing that Houston is not harmed by the presence of Dallas or Minneapolis by St. Paul. Rivalries over population size alone do not appear to drive the failure of big-city bills; it is delegation size that creates weakness in numbers.
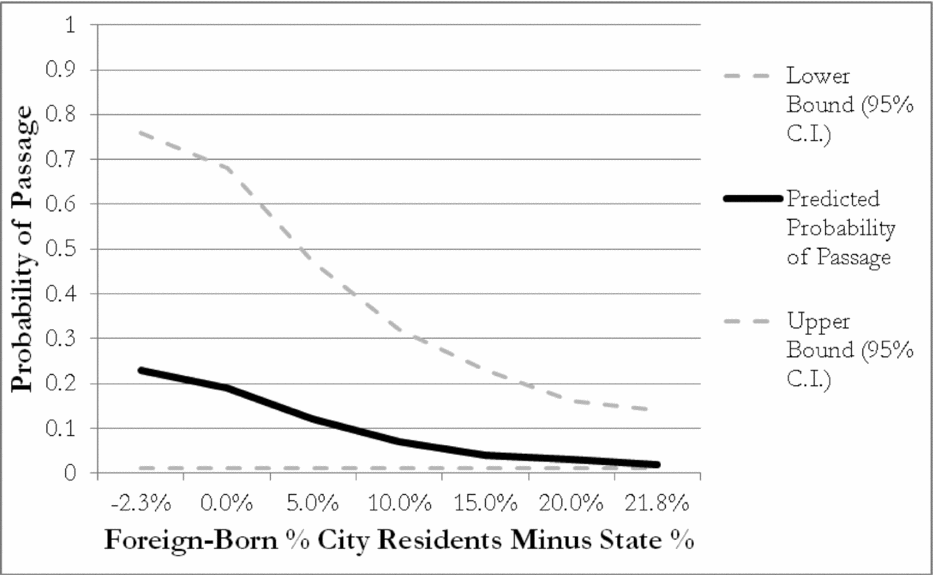
Hypotheses 3 and 4 posit that demographic differences galvanize hostility to cities: the larger the difference between the populations of a state's biggest city and the state itself, either in immigration patterns or in race, the greater the hostility. We find evidence that district bills lose at higher rates when they emerge from cities with more foreign-born residents relative to the state. This effect is statistically significant and substantively strong. Figure 6 displays its magnitude, again holding all other explanatory variables constant at their mean (for continuous) or median (for dichotomous) values. It shows that a bill from a city that had a smaller proportion of immigrants in its population than the state—as was the case in Minnesota in 1881, where the difference in proportions was 2.3 percentage points—would pass 23% of the time. By contrast, in the situation where the city is much more immigrant-rich than the state—as in Illinois in 1881, where there was a 21.8 percentage point difference between Chicago's immigrant proportion and the state's—our model produces a predicted probability of passage of only 2%. (Each of these baseline probabilities of passage is relatively low because we hold the city's delegation size constant at its mean value, which is 19 in our sample, thus predicting low passage rates regardless of demographic factors.) This variable helps explain why bills from cities such as New York and Chicago, hubs of immigration relative to the rest of their states, fare more poorly than bills from cities such as Richmond and Minneapolis, which are microcosms of their states.
Substantive Impact of Foreign-Born Population on Passage Rates, Using the Subsample with Richer Data
A parallel measure of racial difference, however, exerts no such effect, yielding a coefficient that is far from statistically significant. We also sought to capture racial prejudice by coding a variable indicating that the city had an African American mayor, but this factor is similarly insignificant (and even when we remove the mayoral variable from our model, the measure of racial demographic difference still falls well short of significance). In models not reported here, we probed for other potential impacts of race or ethnicity,Footnote 13 but found no evidence that it was an important obstacle to big-city success in our sample over this time period. In addition to testing for an effect of differences between city and state black populations, we (separately) tested for the impact of racial diversity in the city and in the state. We also tested each effect in constrained contexts—after the civil rights era (our 1981 and 1997 sessions) or in the subset of our cases where blacks had effective suffrage (in the South after the civil rights era and in other regions in all years). In none of these models was any measure of black population statistically significant.
Hypotheses 5 and 6 also yield null findings. The presence of partisan divides between metropolitan delegations and the legislature as a whole does not seem to lead to district bill defeats. This is the case whether partisan difference is measured at the individual or the aggregate level. Just as we saw in our analysis of all district bills, legislation from the biggest city authored by majority party members does not pass at significantly higher rates than bills introduced by minority party legislators. Neither do bills emerging from cities with delegations controlled by the same party that controls the legislature. States appear to practice universalism in this sphere, just as they do in distributive politics at the federal level. Finally, we see no evidence in favor of Hypothesis 7: the fates of individual district bills are not affected by the aggregate number of bills introduced by a city delegation.
Overall, the major lessons of this analysis are that cities lose in the statehouse when their residents appear foreign to other state legislators and when their delegations are too large to speak with a unanimous voice. Although we lack a direct measure of ethnic animus, nativism may be relevant to understanding the lower passage rates of big-city bills. But other measures of hostility—party divisions, bills introduced by members of the minority political party, large African American populations, many rural legislators—have no effect on passage rates. Large numbers of observers have pointed to partisan divides between big cities and their states, and many others have focused on rural–urban cleavages, but the evidence we present in this article leads us to reject both sets of explanations. Instead we embrace the finding that deference, rather than antagonism, characterizes the treatment of district bills. That big-city bills fail in such large numbers is due, above all, to large delegation sizes. Division within big-city delegations is the central variable explaining low passage rates.
DISCUSSION
Our research began with a paradox: there is strength in numbers in many political realms, with more representation leading to a greater share of goods, but a long literature in American politics has found that this pattern is reversed when it comes to big cities. We show that larger cities in fact do much worse than smaller ones in a critical area of state politics, passing the district legislation needed to govern localities. The bigger the city, the more often the district bills authored by its legislative delegation lose, a finding that is not an artifact of the content of these bills or the party affiliation of their author. Over more than a century's time, the passage rates of district bills from cities with more than 100,000 residents lag 24% to 34% behind the success rates of district bills overall, a pattern that remains strong in a multivariate analysis of 1,736 bills.
We explain this paradox by examining a subsample of 747 bills from each state's largest city, which as a group vary widely in their populations, political representation, and demographics. We find that scale exerts its most dramatic effect through the size of big-city delegations. Larger delegations are more likely to be divided along partisan lines and to split over roll-call votes on their own district bills. Following Kingdon's (Reference Kingdon1973) logic, it appears that legislators from the rest of the state follow the cues of the big-city delegation and split when its members divide, often dooming bills. The larger a city's delegation grows, the worse the prospects of its district bills become, providing an explanation of why the reapportionment revolution did not solve the problems of big-city legislation. The other factor that harms large cities is the demographic difference between their populations and the rest of the state. A sharper demographic divide between a city and the state in immigrant population percentages hurts the prospects of city legislation. We do not find a parallel effect of racial divides, but this may be because blacks were either absent from large cities or effectively disfranchised in much of this time period and thus not strongly associated with big-city legislators.
It is important to note that our focus on the treatment of district bills does not tell the full story of how cities are treated in statehouses; cities can win or lose in other arenas of state politics. When it comes to grants that states make to local governments, Ansolabehere and Snyder (Reference Ansolabehere and Snyder2008) show that urban centers lost out on public spending before the reapportionment revolution but that the one-person, one-vote decisions largely removed this inequity. Of equal or greater import might be policies such as state welfare and health care spending that disproportionately benefit urban populations in many states, or state spending on projects and services directed to local areas (such as roads, ports, bridges, unemployment offices, and even universities). Larger cities may have more sway than small towns over these consequential decisions, and future research could draw important lessons by studying the geographic distribution of state budgets to chart who gets what, when, and how from statehouses.
Other work remains to be done. Race could matter more today than in our largely historical dataset, and we are gathering another round of recent data to further explore this dynamic. The new wave of immigration from Latin America and Asian nations could drive another wedge of demographic difference between cities and states based on ethnicity that deserves further exploration. Rodden's work (Reference Rodden2012) on the industrial roots of urban liberalism and its interaction with electoral institutions also suggests new avenues for research in states, with their variance in levels of industrialization as well as the existence of multimember legislative districts.
Still, this article demonstrates—for the first time in a systematic, data-driven study—that big-city lawmakers get less of what they want in state legislatures, when it comes to bills governing their own districts. There is no strength in numbers. Delegation size brings division and conflict, as do demographic differences between city residents and those in the rest of the state. This explains why the reapportionment revolution did not increase the power of big cities in this realm and why metropolitan growth, especially if it is driven by immigration, can leave big cities particularly disadvantaged in statehouses. When it comes to passing district bills sought by American cities, increasing representation is no solution at all.
Supplementary materials
To view supplementary material for this article, please visit http://dx.doi.org/10.1017/S0003055413000397




Comments
No Comments have been published for this article.