One of the more striking propositions to emerge in the literature on voters and governments is McDonald and Budge's hypothesis that government policy in democratic systems generally reflects the left–right stance of the median voter.Footnote 1 What makes this ‘median mandate’ hypothesis so noteworthy is that it differs fundamentally from the more common understanding of mandate politics, which sees electoral victory conferring mandates on governments to govern according to their own preferences.Footnote 2 Electoral competition may present distinct policy alternatives to the electorate, but what prevails, according to the median mandate hypothesis, is governance by the middle.
McDonald and Budge's rejection of the ‘government mandate’ interpretation is based on evidence that it does not describe how contemporary democracy actually works. By their calculations, the preconditions for a government mandate – a majority government based on an electoral majority – have been present less than half the time in the twenty-one post-war democracies they examined.Footnote 3 Most of the cases that meet these criteria, moreover, possess a ‘fatal flaw’: they are coalition governments that were put together only after elections had been held. In contrast, McDonald and Budge find that the match between government policy and the left–right voter median in these countries is virtually one-to-one.Footnote 4
McDonald and Budge regard this as a highly satisfactory outcome from a democratic standpoint. This conclusion is based on the privileged status held by the median voter position in one-dimensional policy spaces (no other position is majority-preferred to it), and the evidence they have amassed that the policy spaces in these countries appear dominated by a single left–right dimension.Footnote 5 But how does it come about that government policy aligns with this position? In McDonald and Budge's view, it is not because parties converge towards the median in an attempt to maximize their votes, as Downs famously anticipated in two-party electoral contests.Footnote 6 In fact, they demonstrate that parties in the systems they examine carve out and maintain distinct left–right positions.Footnote 7 Nor is it because governments promise one thing (a programme distinct from others) but intentionally implement another (the median); the relationship cited above measures government positions from the electoral manifestos (platforms) of the parties that compose them, not from what they do in office.Footnote 8 Rather, the answer for McDonald and Budge is that the middle can, and does, move. Specifically, their evidence indicates that shifts in government position respond, in an essentially one-to-one sense, with shifts in the parliamentary median, which in turn respond one-to-one with shifts in the voter median.Footnote 9 Thus, if a government of the left replaces a government of the right (or vice versa), it is because the voter median has moved decidedly in that direction.
This property, which McDonald and Budge call ‘responsiveness’, is key to the median mandate interpretation.Footnote 10 But can responsiveness be one-to-one? There are two main concerns here. Given that governments of the left and the right do replace each other at times, it would seem to imply a rather high degree of motility in what many observers would take to be a rather fundamental orientation: voters’ left–right positioning. What is more perplexing is that, even if the left–right median were to prove sufficiently labile, it is difficult to see how it could be the foundation for their finding. This is because their measurement strategy would probably have prevented one-to-one responsiveness from emerging in the analysis.
What drives this perverse conclusion is the use of the left–right positions of the various parties in each legislature to construct both variables. These position estimates figure in the measurement of a government's policy position because it is operationalized as the weighted mean of the positions of its member-parties, with their respective legislative seat shares constituting the weights. Their involvement in the measurement of median voter positions stems from McDonald and Budge's reliance on the Kim–Fording method of estimating voter medians,Footnote 11 which assumes that the left–right position of each party in an election can be taken to represent the mean left–right position of the voters who voted for it. Using this assumption, it produces what is essentially an estimate of the middle of the party system, weighting each party's position by its vote share.
For one-to-one responsiveness to hold in these circumstances, a shift in the weighted mean position of government parties needs to correspond, roughly speaking, with a shift in the weighted middle of the entire party system. It is easy to see that this could happen if governments are formed around the middle, i.e. when the government consists of (a) a single party located at or near the (weighted) centre of the party system, or (b) a coalition that combines and balances left-of-centre and right-of-centre parties, taking their respective sizes into account. But it becomes much more improbable if governments tend to be more ‘partisan’, that is, distinctly left-wing or right-wing.
The problem is that governance by means of centrist coalitions does not seem to be the rule in Western Europe. Granted, it is characteristic of polarized pluralist systems such as the Italian ‘first republic’ (1948–92), and one can also find examples of a single centrist party or a ‘grand coalition’ taking office, as in Germany in 2005 and Austria in 2006. But polarized pluralism and grand coalitions are exceptional. It is much more common to find governments that are clearly to the left or right of the party system centre, since political competition in many countries pits distinct left-wing and right-wing alternatives against each other and one side usually wins. Casual observation indicates that, of the twenty-one countries McDonald and Budge studied, only Switzerland, Luxembourg, Italy before 1992, and possibly Belgium resort frequently to government by the centre.Footnote 12
The fact that McDonald and Budge nonetheless find one-to-one responsiveness naturally raises the suspicion, at least among those of a more sceptical bent, that something must be wrong with their measurement or testing procedures. As noted above, an obvious suspect is the indirect estimation of median voter positions from the party positions and vote shares. Rather than attempting to put this (or any other) aspect of McDonald and Budge's methodology under the microscope, however, this article re-examines the government–citizen relationship using another method of estimating the median, one that does not assume that voters change their left–right position whenever they change their vote choice. This method derives the median from responses to national survey questions that ask respondents to locate themselves on a left–right scale.
Measuring medians in this way also has its potential drawbacks. As McDonald and Budge observe,Footnote 13 national surveys that include the left–right self-placement item are a good deal less abundant than the Comparative Manifestos Project (CMP) data, which they use to estimate party positions. In addition, McDonald and Budge believe that the apparent tendency for respondents to place themselves relative to their own systems, rather than in relation to some cross-nationally valid standard, renders them inappropriate for cross-national comparison.
There is no doubt that survey data containing the left–right self-placement item are less abundant than the CMP data, but are far from being rare. The Eurobarometer series of surveys, for example, has measured left–right opinion in member-countries of the European Community/Union across a period of more than three decades. A series of this length and breadth can yield not only a considerable number of cases for analysis but also a sufficient time span to study more fully the dynamics of the relationship. In addition, it opens the door to a consideration of the prospect that the relationship differs considerably from one country to the next, thus addressing both measurement non-equivalence – such as any tendency on the part of respondents to centre their self-placements on their own systems – and relationship non-equivalence or heterogeneity as well. All in all, there would seem to be little to lose, and perhaps much to be gained, by re-examining the linkage between citizen opinion and government policy using survey-based estimates of the former.
I have undertaken this re-examination, utilizing both the Eurobarometer and European Election Studies series of surveys. The purpose is not just to re-test the median mandate hypothesis with different data, but to gain a fuller understanding of the ways in which, and the extent to which, median opinion may influence what governments subsequently set out to do. The analysis allows for the possibility that measurement may not be equivalent across countries and surveys, that the data may contain significant dynamic effects, and that different countries may exhibit different relationships between median opinion and government policy. Ultimately, the analyses show that there generally is a linkage between the two variables, but it is seldom the one advanced in the median mandate hypothesis.
Data and measurement
As noted above, the Eurobarometer series of public opinion surveys provides a basis for calculating left–right medians in a substantial number of countries over an extended period of time. These datasets have now been combined into the Mannheim Eurobarometer Trend File 1970–2002 (EB),Footnote 14 which facilitates the task considerably. In addition, the series of surveys conducted under the auspices of the European Electoral Studies (EES)Footnote 15 can be used to extend the measurement of key variables to 2004 in most of these countries. Together, the EB and EES surveys provide up to seventy-seven readings of left–right positions over a 31-year period (1973–2004), depending on how long the country has been in the European Community/Union.
The one caveat to this abundance is that the question asking respondents for their vote choice in the last election is somewhat less pervasive, appearing consistently only from 1989. Its role in the present context would be to allow voters to be identified so that a voter median can be calculated. McDonald and Budge regard its more limited availability as a significant impediment,Footnote 16 but it is far from clear that this is the case. If governments were motivated to follow a median mandate, it seems unlikely that they would take only voter opinion into account, rather than the views of all citizens. After all, some of the abstainers in the last election might be voters in the next, and vice versa. Whether governments even have the capacity to distinguish between the median positions of the two overlapping groups also seems doubtful. It is perhaps for these reasons that Golder and Stramski's exploration of the various ways in which congruence between government policy and public opinion might be conceptualized invariably refers to citizens, not voters.Footnote 17 Other studies of congruence, such as those by Huber and Powell,Footnote 18 have used the citizen median rather than the voter median, and since it expands the number of cases considerably, that is the course that will be followed here.
In estimating a citizen median from a given survey, there would be little point in simply taking the median response to the left–right self-placement item; since both survey series accept only integer responses, the result is likely to be a rather uninformative ‘5’ or ‘6’ in all cases. There is, however, a method for producing a more precise estimate for the median when responses are grouped into discrete categories. Kim and Fording used this method to estimate the voter median from party positions and vote shares, but it may also be applied to the distribution of self-placements across the ten integers of the EB/EES left–right scale. In this application, the first step is to divide the scale into equally-spaced intervals around each integer, so that a response of, say, ‘5’ is taken to represent some value from 4.5 to 5.5. On the assumption that values across the interval containing the median respondent are uniformly distributed, the distance along that range that one would have to go to get to the middle response is then calculated. For instance, if 47 per cent of respondents gave values of 0 to 4 and 15 per cent responded with a score of 5, the median or 50 per cent point would be located one-fifth (3/15ths) of the way along the range of category 5, i.e., at 4.7. The assumption of a uniform distribution is a drawback – a normal distribution of scores across the entire scale seems more likely – but probably not a serious one, given that it is being applied to a relatively narrow range of the left–right scale.Footnote 19
The measurement of government policy will follow the standard procedure in the congruence literature, which is to use the seat-weighted mean position of the parties in the government. The main justification for this operationalization is the evidence of a nearly perfect one-to-one relationship between legislative seat shares and portfolio shares in coalition cabinets.Footnote 20 This evidence is only partially germane; it casts a light on how influence over policy is distributed among government parties, but is totally mute about whether (a) parties defend their positions in negotiations over policy or (b) governments are able to do what they set out to do. If (a) seems reasonable, the same cannot be said of (b), since actual government policy may be affected by factors outside the control of the government parties.
It would certainly be interesting to test for a one-to-one fit between median opinion and actual government policy; unfortunately, this would require the ability to place actual government policy on the same left–right scale, which is beyond current capabilities.Footnote 21 In the conclusion of this article, I discuss more fully the implications of shifting the median mandate hypothesis so that it references actual, rather than intended, government policy. For the present, suffice it to say that, precisely because actual outcomes may deviate from intentions for reasons that are extraneous to the dialogue between voters and politicians that forms the core of liberal democracy, the nature of the connection between public opinion and government intentions remains a valid and important subject of inquiry in its own right.
Investigating the relationship in these terms still poses a challenge: it requires accurate measurement of parties’ left–right positions. McDonald and Budge tackled this problem by applying a procedure first introduced by Budge and Laver for estimating party positions from the CMP's coding of their electoral manifestos.Footnote 22 Whatever the merits of the Budge–Laver measure, however, it is inappropriate in the present context because parties would not be placed on the same left–right scale used for measuring median citizen opinion. Measurement on the same scale is crucial to the present analysis because the issue under consideration is not just whether the independent variable exerts a net effect on the dependent variable but also whether that effect is proportionate (i.e. one-to-one) or otherwise.Footnote 23
The approach adopted here therefore proceeds by reversing McDonald and Budge's strategy: rather than inferring median left–right voter opinion from the positions of the parties they voted for, it infers party positions from the mean left–right self-placements of respondents who intend to vote for them. Specifically, a party's left–right position at the time of any given survey is taken to be the mean left–right self-placement of the survey respondents who reported an intention to vote for it.Footnote 24 The assumption that parties place themselves at the mean position of their intended voters is virtually identical to the key assumption of the Kim–Fording method for estimating voter medians; it is simply being transferred from the construction of the independent variable to the construction of the dependent variable.
This change is far from inconsequential. Like McDonald and Budge's measurement strategy, the strategy utilized here derives both medians and government positions from a single data source; this allows the one-to-one hypothesis to be tested but it also means that only centrist governments are likely to meet it. The advantage of the present method is that its main inferential leap is in the estimation of party positions, whose accuracy can be readily tested.Footnote 25 The normal procedure in the literature for assessing the accuracy of position estimates is to compare them with expert estimates, usually mean estimates derived from surveys of country experts. This is the procedure that will be followed here. The standard for comparison will be Benoit and Laver's expert survey, which has the largest sample sizes (an average of twenty-one experts per country) of any expert survey of party positions.Footnote 26
Since the Benoit–Laver survey was conducted between 2002 and 2004, only the most recent position estimate for each party, calculated from surveys undertaken no earlier than 2000, will be used. There are a total of ninety-two parties for which both the Benoit–Laver and the 2000–04 EB/EES data yield estimates, and the two sets of estimates correlate at a very strong r = 0.864 (p < 0.001).Footnote 27 To gain some comparative perspective on this finding, the corresponding correlation using the manifesto-based Laver–Budge measure, as provided in the most recent release of the CMP dataset,Footnote 28 is noticeably lower at r = 0.723 (p < 0.001, n = 85). Indeed, Benoit and Laver report an even lower degree of association between the Laver–Budge measure and their own expert-based estimates (r 2 = 0.40, implying r = 0.63), based on a larger sample of parties (n = 114).Footnote 29 These results suggest that survey-based estimates of party position, calculated from the self-placements of intended voters, compare very well in terms of accuracy with the CMP-based versions that McDonald and Budge used.Footnote 30
The final issue in the preparation of the data concerns the element of timing. Both of the key variables in this analysis depend on survey data whose collection was not timed to coincide with the formation of governments. In other words, the EB/EES data yield estimates of citizen medians and estimates of the positions of government parties, but they do not – except by coincidence – yield these estimates at the time that governments are formed.Footnote 31 Of course, surveys are conducted over a period of weeks, and therefore the picture they provide is not instantaneous. But there could be a noticeable mismatch if a survey conducted, say, in March is used to infer values for the citizen median and the government's position for the following August, when the government was formed.
This issue was handled by linear interpolation. We have up to seventy-seven estimates of citizen medians and government party positions for a time range of up to thirty-one years, or about two and a half measurements per year on average. The citizen median calculated from each survey was attributed to the month(s) and year in which the survey was conducted, and values for the intervening months were then interpolated. Thus, if the estimated citizen median from a Eurobarometer survey conducted in October/November of one year is 5.51 and the median estimated in the next Eurobarometer, conducted in March of the following year, is 5.56, it is assumed that the median increased smoothly and evenly between those two values in the intervening three months. This allows a government position and a median citizen position to be estimated for the month and year in which each government was formed.Footnote 32
The governments included in the analysis comprise all non-caretaker governments formed in the period covered by these times series. The number of cases per country varies a good deal, since countries differ considerably in both the frequency with which new governments are formed and the length of time they have been members of the European Community/Union (and hence included in the Eurobarometer surveys). Altogether, there are some 161 governments in sixteen countries that have valid data on the government's position and the median citizen position, as measured here.Footnote 33 When a lagged dependent variable is introduced, the number of cases drops to 140.
Analysis and results
The analysis adopts the common assumption that the left–right scale presented to survey respondents is interpreted by them as an equal-interval scale, and therefore that the variables created from their self-placements, government position and the citizen median can be treated as intervals. With respect to causal order, it assumes that while the previous government's policy position may influence the citizen median for the month in which a new government is formed, the new government's position does not do so. Thus, if there is any contemporaneous relationship between the citizen median and the new government's position, it must flow from the former to the latter. This assumption, too, is standard in the literature. Its justification is rooted in common sense: when governmental turnover occurs, the shift in policy objectives is immediate; the citizen median may eventually be influenced by this shift, but it is highly doubtful that it could happen immediately.Footnote 34
Although regression on data that vary both over time and cross-sectionally entails, as Stimson put it, a ‘plethora of problems’,Footnote 35 most of the work in political science follows Beck and Katz's recommendation to focus on the following three: contemporaneous correlation of error terms across ‘panels’ or countries, panel heteroscedasticity, and serial correlation in the within-panel error terms.Footnote 36 Beck and Katz have introduced the use of panel-corrected standard errors to take account of the first two potential problems and have suggested that the inclusion of a lagged dependent variable as a regressor may often be sufficient to dispose of the third. If so, they suggest that model estimation can proceed using ordinary least squares (OLS) regression.
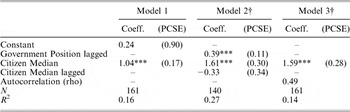
The first model of Table 1 estimates the impact of the citizen median on government position using OLS regression with panel-corrected standard errors. The results provide some initial support for the median mandate hypothesis: the estimated intercept (α = 0.24, SE = 0.90) and slope (β = 1.04, SE = 0.17) are very close to, and statistically indistinguishable from, their expected values of 0 and 1, respectively. However, further investigation shows that a substantial degree of first-order autocorrelation is also present,Footnote 37 implying that some further step, such as including a lagged dependent variable as a regressor, is warranted.
The Citizen Median/Government Position Relationship with Fixed Coefficients

Note: Standard errors (in brackets) are panel-corrected
†All variables in Models 2 and 3 are deviations from their country means.
*p < 0.05 in a one-tailed test, **p < 0.01 in a one-tailed test, ***p < 0.001 in a one-tailed test.
Another area of concern is that the model takes no account of potential non-comparability in measurement across political systems. As noted earlier, McDonald and Budge believe that the use of respondent self-placements to measure the citizen or voter median lends itself to non-comparability because respondents are likely to have centred the scale on their own systems. As a result,
the median citizen in Norway is recorded by surveys to be at the same left–right position as the median citizen in Australia, and even the median citizen in the USA. This is implausible when one thinks of the general differences between the countries’ politics, Norway by almost any account being well to the left of Australia or the USA.Footnote 38
McDonald and Budge's fear is that medians estimated from respondent self-placements, because they under-estimate cross-national variation, will not match up well with government positions. This fear is less relevant in the present analysis because government positions have also been measured from the same survey item and thus should also be affected. The degree of ‘centring’ of self-placements may vary across countries, however, and thereby have some effect on the analysis. Fortunately, there is an appropriate corrective: measuring the independent variables in terms of deviations from their country means. The consequence of this step would be to remove any influence emanating from country-level traits (such as differing propensities to ‘centre’), thereby focusing attention entirely on the within-country relationship.Footnote 39 Thus, if Norwegian respondents do tend to under-estimate their leftness and Australian and American citizens their rightness relative to some international standard, transforming the independent variables into deviations should eliminate its impact on the analysis.
A further beneficial step would be to extend the use of deviations to the dependent variable as well. Measuring all variables in this way is equivalent to adding a set of country dummy variables to the analysis, a step strongly implied by Wilson and Butler's re-analyses of several time-series cross-section studies.Footnote 40 The advantage of using deviations rather than dummies is that there are fewer coefficients to estimate.Footnote 41 Finally, a lag of the independent variable, citizen median, should also be included. As Beck notes, a model that includes a lagged dependent variable also implicitly includes a lagged independent variable (and a lagged error) as well.Footnote 42 Leaving out the lagged independent variable implies that its impact is non-existent, a position that is better tested than assumed.
In Model 2, the results of adding lags of both variables and converting all variables to deviations are shown.Footnote 43 They reveal that omitting the lagged independent variable would have been fully justified in the present case: the estimated slope for citizen median lagged is small and highly insignificant. This is not true, however, for the lagged dependent variable, which shows a highly significant impact. Moreover, its presence in the model has the hoped-for effect of rendering the autocorrelation in the error terms insignificant (p=0.11). From the standpoint of the theoretical matters at issue here, the key finding is the large increase in the effect attributed to the citizen median, which is now well above the median mandate expectation of 1.Footnote 44
It is possible, moreover, that this effect is under-estimated because of the presence of the lagged dependent variable in the model. This may happen if there is no true autoregressive effect (the dependent variable is not, in fact, influenced by its own prior values) and both the independent variable and the error term are serially correlated. It can also happen if a true autoregressive effect exists, but the serial correlations persist even when the lagged dependent variable is included in the specification. As Achen has demonstrated, the lagged dependent variable in these situations acts like ‘a kleptomaniac, picking up the effect, not only of excluded variables, but also of the included variables if they are sufficiently trended’.Footnote 45
We may examine this possibility by comparing Model 2 with Model 3, which employs a Prais–Winston regression to estimate the effect of the citizen median on government position. In addition to utilizing panel-corrected standard errors, this model estimates the first-order autocorrelation in the error terms and adjusts parameter estimates accordingly, obviating the need to introduce a lagged dependent variable solely for this purpose. The results show the slope estimate for the citizen median in Model 3 to be virtually identical to that reported in Model 2, suggesting that the lagged dependent variable is no ‘kleptomaniac’ in the former model. It appears that a government's declared position is actually influenced by the position of its predecessor.
What form does this dependence on the previous government's position take? One very plausible interpretation is that the costs associated with negotiating government agreements with new coalition partners serve to favour the formation of governments that are similar or identical in party composition to their predecessors, dampening the overall impact of changes in the citizen median. Alternatively, it may mean that there is some tendency for the citizen median effect to be distributed over time (even though its first-order lag proved to be insignificant) or that the way in which government position is measured – from the positions of intended voters – captures less adequately the extent to which the positions of ‘repeater’ governments have changed (relative to governments with different party compositions from their predecessors). Further research will be required to evaluate these (and perhaps other) possibilities.
Heterogeneity in the Government–Citizen Nexus
The results to this point suggest that citizen medians and government policy positions are connected, but the estimated slope implies that a one-unit shift in the citizen median can be expected to produce a considerably larger shift in preferred government policy. However, we cannot definitely reject the median mandate expectation of a one-to-one relationship because the 95 per cent confidence intervals for that estimated parameter in Model 2 (1.02 to 2.19) and in Model 3 (1.04 to 2.13) come very close to including the hypothesized value of 1. In fact, those confidence intervals are suspiciously large, and bring to mind another type of non-comparability that may be present: cross-country heterogeneity in the relationship itself.
This type of heterogeneity can be examined in various ways. The most straightforward method is to run separate regressions by country and compare results, but this requires more cases per country than are available here. A less data-intensive alternative is to estimate a random coefficient model, which allows slopes to differ across countries but imposes the constraint that they are drawn from a single normal distribution whose standard deviation is to be estimated. It is also possible to allow for variation across surveys as well; in this case, it is assumed that differences across surveys can be captured by random intercepts drawn from a normal distribution whose standard deviation is also to be estimated. Since surveys are not nested in countries (or vice versa), this model subtype is sometimes called a ‘crossed random effects’ model.
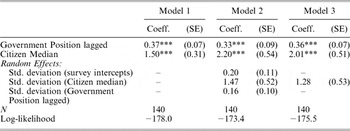
We begin this phase of the analysis by re-estimating the basic model using the standard assumptions of multilevel linear models but without allowing for variation across countries or surveys. The principal difference from Table 1 is that standard errors are no longer panel-corrected. The results, presented in the first model of Table 2, are as expected: the estimated slopes are unchanged but their standard errors differ modestly.
Introducing Heterogeneity by Means of Random Coefficients

Note: All variables are deviations from their country means.
*p < 0.05 in a one-tailed test, **p < 0.01 in a one-tailed test, ***p < 0.001 in a one-tailed test.
The next step is to relax these restrictions by allowing for variation in slopes and survey intercepts. The results are shown in Model 2 of the table. Both independent variables remain significant in this model, although the magnitudes of their effects are altered somewhat. The key alteration for present purposes is that the citizen median slope has increased even more, so that it now implies that a one-unit change can be expected (ceteris paribus) to produce a shift in government policy of about two units. But there is also evidence that this average effect, strong though it is, hides a lot of cross-country variation. This can be seen in the sizeable standard deviation (1.47) estimated for the distribution of citizen median slopes. A likelihood ratio test resoundingly rejects the null hypothesis that these slopes do not vary (p < 0.01). This is not the case for the other parameters that have been allowed to vary: the survey intercepts and the slopes for the lagged dependent variable. Likelihood ratio tests show that each type of variation is insignificant individually and both are jointly insignificant. Model 3 fits a reduced specification that excludes these two insignificant sources of variation.
What can we conclude from Model 3? The model clearly supports the contention that citizen medians influence government positions in these countries. But it is almost certainly not a one-to-one relationship; instead, our best guess is that changes in the citizen median are magnified approximately twofold in shifts in government position. This is, moreover, only the short-term effect. The full or long-term effect of a one-unit shift in the citizen median is to shift government position by about three units (3.14).Footnote 46 Small changes in the citizen median evidently produce much bigger changes in government policy.
Equally importantly, not only does the relationship lack the elegant symmetry of the median mandate hypothesis, but there are solid grounds for not speaking of a single relationship at all. This is evidenced in the large and highly significant standard deviation attributed to the estimated distribution of slopes across countries. Apparently, the impact of median citizen opinion on the policy stance of governments varies widely across these countries.
A Closer Look at the Heterogeneity
Let us consider the issue of country heterogeneity more closely. The first question is, how do government positions deviate from citizen medians in the countries under examination? The general tendency, as we have seen, is for changes in the citizen median to be amplified as they translate into changes in government position. This suggests that governments tend to be ‘partisan’ rather than centrist, that is to say, largely or entirely positioned to the left or the right of the citizen median rather than around it.
The degree to which a government is ‘partisan’ in this sense can be measured by the extent to which its party composition, weighted by legislative seat shares, is drawn from parties located on just one side (left or right) of the citizen median. The governments in this dataset possess this property to a high degree: on average, they draw 87.5 per cent of their composition from parties located on one side of the citizen median. This includes single-party governments which, almost by definition, are either entirely left-of-centre or right-of-centre, but excluding these cases still leaves the average coalition government with 81.4 per cent of its strength located on one side of the median.Footnote 47 In contrast, less than a quarter (22.3 per cent) of coalition governments can be classified as ‘centrist’ in the sense that no more than 60 per cent of their strength is located on a single side of the median. Nearly half of these cases, moreover, are concentrated in just one country (Belgium), with most of the rest falling in two others (Finland and Luxembourg).
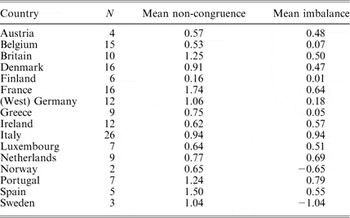
Another property suggested (although not necessarily implied) by a slope estimate considerably greater than 1 is alternation between governments of the left and the right. (‘Left’ or ‘right’ in this context means left or right of the citizen median.) A method of gauging the degree to which alternation occurs is to compare the absolute deviations of government positions from citizen medians in the various countries with their signed or non-absolute versions. Mean values of the former, which will be called ‘mean non-congruence’, indicate how far, in general, government positions in each country deviate from their citizen medians. Mean values of the latter, by allowing positive and negative deviations to offset each other, show the extent to which these deviations balance each other over time. This trait will be termed ‘mean imbalance’.Footnote 48 In both cases, a correct assessment of the trait would benefit from taking the durations of its various governments into account. That is, the extent to which a government that deviated sharply from the citizen mean influences the overall assessment of congruence in a country ought to depend on how long it remained in power, and the same is true of its contribution to the degree of balance between left and right.
The levels of mean non-congruence and mean imbalance for the various countries, weighted by government durations, are reported in Table 3. A high level of non-congruence indicates that governments in that country tend to deviate markedly from their citizen medians; a low level of imbalance indicates that, over time, right-wing deviations are in approximate balance with left-wing deviations. A combination of the two – high non-congruence and low imbalance – would indicate that the country has seen an approximately even-handed alternation between well-differentiated left-wing and right-wing governments.
Estimated Non-Congruence and Imbalance in Sixteen Countries

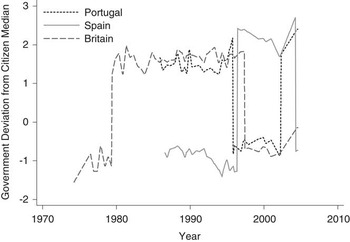
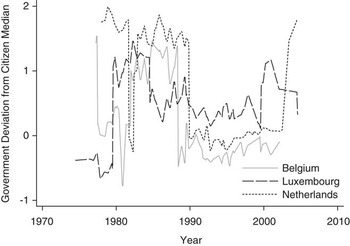
Among countries with a reasonable number of governments under analysis, the ones that mostly clearly show this combination are Germany and Greece. Several others, including France, Britain, Spain and Portugal, show considerable alternation, but somewhat less balance, with periods of right-wing rule tending to outweigh periods of left-wing rule. This may, of course, simply reflect the period for which the data are available, rather than any long-term propensity for the right to dominate. Finally, there are some countries, such as Luxembourg and Belgium, that reveal relatively low levels of non-congruence, suggesting a tendency for governments to position themselves near the citizen mean for protracted periods of time.
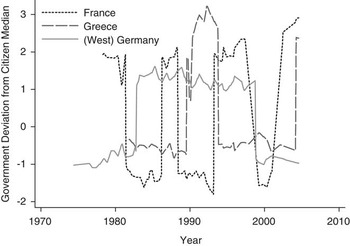
Figures 1 to 3 illustrate these differing propensities by plotting the monthly deviations of government positions from the corresponding citizen medians for various sets of countries. In these plots, the distance of a government from 0 indicates its deviation from the citizen median, with positive values signalling deviations to the right and negative values the reverse. Figure 1 contains the deviation lines for the countries with the clearest patterns of balanced alternation, Germany and Greece. The figure also includes France, which, although showing some imbalance in favour of the right still displays a high level of alternation. In Figure 2 are three countries – Portugal, Spain and Britain – that show reasonably high levels of non-congruence, but also considerable long-term bias in favour of the right. The case of Spain is particularly interesting because the periods of left-wing and right-wing rule are of approximately equal length, but right-wing governments deviate much further from the citizen median.Footnote 49 Finally, Figure 3 portrays the deviation lines for the Benelux countries, which all show sustained periods in which government positions are reasonably close to the citizen median. Note that this is not a permanent condition of governance in these countries; all of them show the pattern for the 1990s, but not for the preceding period, nor perhaps for the period after 2000 (with the exception of Belgium).
Deviation of government position from citizen median over time in France, Germany and Greece

Deviation of government position from citizen median over time in Britain, Portugal and Spain

Deviation of government position from citizen median over time in the Benelux countries

While all of these political systems show considerable non-congruence at least some of the time, Table 3 makes it clear that they vary considerably in their mean levels of the trait. What accounts for these differences? The issue has been the subject of a long-standing debate that focuses largely on the impact of having a single-member plurality (SMP) as opposed to a proportional representation (PR) electoral system. One of the laws that Duverger proposed half a century ago is that SMP systems, by over-representing large parties relative to their vote shares, tend to encourage the emergence of two-party systems.Footnote 50 If single-party governments dominate as a result (and if the parties do not engage in a Downsian convergence at the median voter position), then there may be a greater tendency for government positions to diverge from the voter or citizen median than is the case in PR systems, where coalition governments and policy compromise are more likely to prevail. Some studies have found precisely this effect.Footnote 51
Other studies, however, have rejected the reasoning and the results. Blais and Bodet argue that the greater proportionality of PR systems tends to facilitate the emergence of more polarized party systems, the consequence of which is that governments, although formed by coalitions, are just as likely to be distant from the median.Footnote 52 Their analysis finds that PR and SMP systems do not differ significantly in levels of non-congruence, as does that of Golder and Stramski.Footnote 53 The most recent contribution to this debate comes from Powell, who finds merit in both views.Footnote 54 Specifically, he traces the source of the conflicting results to the fact that the latter two studies relied on data collected since the mid-1990s, by which time the relationship between electoral systems and non-congruence had largely disappeared.
The finding that SMP systems only sometimes produce greater non-congruence leaves the causal picture very unclear. Given the expectation that large slope estimates for the citizen median will be associated with governments that are more partisan (non-centrist) and thus less congruent with median opinion, however, the present analysis affords another means of examining the issue. The key is whether the variation in slope estimates revealed in Model 3 of Table 2 can be traced to electoral system disproportionality.
Approaching the issue in the terms in which it has generally been approached – by contrasting SMP and PR systems – is not, however, the best way to proceed. There is only one SMP system in the present sample (Britain), and while (contra Duverger) France's two-ballot system might be lumped together with it as ‘non-proportional’, it would still leave the comparison rather thin. This approach would also focus attention on types rather than on causes: what matters is not the system itself but the degree of disproportionality it produces. As Lijphart's calculations show, some PR systems are a good deal less proportional than others.Footnote 55
The hypothesis that will be tested is, therefore, whether the variation in citizen median slopes is a function of the degree of electoral system disproportionality. Disproportionality will be measured by the mean Gallagher index scores reported by Lijphart for the period 1946–95.Footnote 56 It will be introduced into the analysis by re-specifying the model in a two-level format. The first level relates the policy positions of governments, GP, to the citizen median, CM:

where i = 1, 2, …, N indexes the sequence of individual governments in each country and j = 1, 2,…, 16 indexes the countries. No intercept is specified because the variables are mean-centred. The second level makes the citizen median slope β 2j a function of the mean level of disproportionality, DP, of the electoral system:

Substituting (2) into (1) gives:

where the final CM term captures any remaining random component.
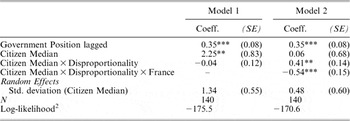
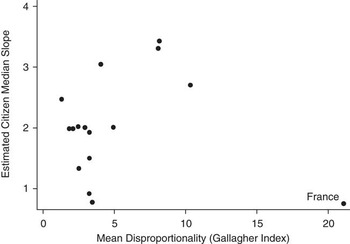
Estimating this equation produces the results given in the first model of Table 4. This model provides no support for the disproportionality hypothesis: the disproportionality/citizen median interactive term (γ 2j) is highly insignificant and its inclusion in the model still leaves a significant amount of cross-country variation in citizen median slopes (p = 0.02). Further examination reveals, however, that this result is heavily influenced by the case of France. This can be seen in Figure 4, which plots the Gallagher mean disproportionality scores for the various countries against their citizen median slopes, as estimated by the empirical Bayes method.Footnote 57 France has by far the highest level of disproportionality in this sample of countries, but a relatively low citizen median slope, making it an extreme outlier in the overall tendency for slopes to increase with higher levels of disproportionality.
The Impact of Electoral Disproportionality

Note: All variables are deviations from their country means.
*p < 0.05 in a one-tailed test, **p < 0.01 in a one-tailed test, ***p < 0.001 in a one-tailed test.
Citizen median slopes and electoral disproportionality, by country. Note: Citizen median slopes are empirical Bayes estimates.

It is not clear why France violates the pattern, but its impact can be accounted for statistically with an additional interaction term (the disproportionality/citizen median term multiplied by a country dummy for France). The addition of this term produces a markedly different picture, as Model 2 shows. The highly significant coefficient estimated for the disproportionality/citizen median term indicates that greater levels of disproportionality lead to higher country slopes, as hypothesized. That France constitutes an exception to this tendency is evidenced by the significant negative impact estimated for its interactive term. Finally, the standard deviation in citizen medians across countries is very much lower and is no longer statistically significant (p = 0.32). Once electoral disproportionality has been taken into account, citizen median slopes do not vary significantly across countries.
Thus, it appears that, France excepted, electoral disproportionality leads to higher slope estimates, that is, larger changes in government position for a given change in the citizen median. The magnitude of this effect is far from negligible, as the scatterplot in Figure 4 makes clear. Higher slopes, in turn, tend to translate into higher levels of non-congruence,Footnote 58 but this is only part of the story. The German case reveals that even a relatively pure PR system can still produce substantial non-congruence: the intended positions of left-wing governments, in particular, deviate substantially from the citizen median. The experience of the Benelux countries shows that periods of high and low congruence are possible in the same institutional setting. Finally, the case of France reminds us that the causal chain outlined above only works if changes in government position reflect changes in the citizen median. France shows a strong pattern of alternation and the highest levels of non-congruence, but it also has the least pronounced connection between citizen median and government positions (the estimated slope is just 0.54). Governments in France oscillate markedly, but with little apparent connection to median citizen opinion.
Conclusion
The evidence presented here, which uses mean-centring to capture within-country effects, paints a picture of considerable diversity across West European democracies. In a few of these countries, the preferred left–right policy stance of governments, as least as judged by their constituent parties’ positions, corresponds reasonably well with median citizen preferences over protracted periods of time. This congruence is consistent with the median mandate hypothesis, although it may not be the result of any intention to implement such a mandate. In many more countries, governments seem much more intent on realizing a partisan agenda, a proclivity abetted by the degree of disproportionality in the electoral system. In these systems, relatively small changes in the citizen median tend to provoke much larger changes in government policy, often but not exclusively by changing the government itself.
Although the one-to-one link between citizen or voter medians and government policy postulated by the median mandate hypothesis has not found support here, McDonald and Budge have advanced a couple of additional arguments in favour of the median mandate interpretation. The first is that, while government policy may fluctuate a good deal from one government to the next, its mean value over the post-war period in any given country tends to resemble the corresponding mean for the voter median.Footnote 59 The other is that actual government policy may be much closer to the median than governments would like.
In my view, both arguments are problematical as defences of the median mandate thesis. The difficulty with the first argument is that averages can mask a lot of possible patterns, including the one revealed here in which changes in the citizen median are magnified at the level of government policy. In other words, a country's average government position may line up closely with its average citizen or voter median over a period of time simply because a reasonably balanced alternation in power occurred between non-congruent left-wing and right-wing governments (and, of course, as the observation period lengthens, the odds of finding an approximate balance tend to increase). To speak of a mandate in such circumstances is to strip the concept of its core meaning. The concept of a mandate implies an authorization to implement a certain course of action; in other words, it assumes intentionality. If a succession of governments gain power and implement policies that are distinct from the median, applying the term ‘median mandate’ to the average outcome over the long term obscures more than it clarifies.
McDonald and Budge's other argument returns the focus to the level of individual governments but shifts the dependent variable from intended to actual government policy. A government may set out to implement substantial changes to the status quo, but even with favourable economic and budgetary conditions, it may find that what it can achieve between one election and the next is limited. Two or more terms in office may be required to realize a reasonable approximation of its goals, and consecutive electoral victories may be hard to come by. If they are, what we may see over time is a sequence of partially realized shifts to the left and the right, with de facto government policy essentially oscillating in the region of the middle.Footnote 60
We do not have data on this possibility and may not for some time: as noted earlier, it is much more difficult to establish an overall left–right position for government output, comparable to a citizen or voter median, than it is for overall government intentions. Nevertheless, it is evident that this is a fairly stylized scenario that may not be invariably, or even generally, realized. It assumes that governments in their initial terms can do little more than return policy to the middle, yet there is no dearth of instances where the first term, sometimes just the first ‘100 days’, achieved much more. It also requires a fairly frequent alternation between left and right governments that may not occur; as Figures 1–3 illustrate, it is not uncommon for one side to hold power for considerable stretches of time.
But suppose researchers were to find that the scenario outlined above is realized quite often – would this be evidence of a median mandate in action? Clearly not. What is portrayed here is an outcome, government policy that fluctuates in the neighbourhood of the median, which is an unintended consequence of actions that are meant to produce very different ends. If there is a mandate in this kind of situation, it is one that is thwarted rather than achieved. This thwarting of intentions also deprives the interpretation of its democratic credentials. It is difficult to see an affirmation of democracy in a generalized inability of governments to do what they promised to do.
If we set aside the notion that governments operate according to a median mandate, and if it should turn out – as seems likely – that circumstances do not invariably or typically impose median outcomes, then we are left with an intriguing question: why do some systems produce more ‘partisan’ (i.e. less centrist) governments than others? We actually know very little about this. The present analysis suggests that countries with more disproportional systems experience bigger swings in government positions, on average, but this is hardly determinative. As noted earlier, Germany's highly proportional electoral system has produced governments just as partisan as Britain's highly disproportional system. Sartori, in his classic treatise on party systems, advanced a possible causal mechanism linking the two variables: electoral proportionality makes it possible for sizeable anti-system parties to appear at the extremes of the parliamentary party system and, where this occurs, there may be little option but to build coalitions around the centre.Footnote 61 This fits the Italian case for most of its post-war history and may fit Finland as well (at times), but it also is far from complete as an explanation. Developing a more fulsome causal account of government–citizen non-congruence, or what I prefer to call ‘partisan government’, clearly ought to be a priority for further research.