





Introduction
The importance of ticks
Ticks are hematophagous mites with a global health impact on humans, domesticated animals including livestock, and wildlife. As blood-feeders, ticks are vectors, transmitting a diverse range of disease agents, including viruses (for example, tick-borne Flaviviridae, Dabie bandavirus and Orthonairovirus), bacteria (for example, Borrelia spp., Anaplasma spp. and Spotted Fever Group Rickettsiae), protozoa (for example, Babesia spp. and Theileria spp.) and filarial nematodes (de la Fuente et al., Reference de la Fuente, Estrada-pena, Venzal, Kocan and Sonenshine2008, Reference de la Fuente, Estrada-Peña, Rafael, Almazán, Bermúdez, Abdelbaset, Kasaija, Kabi, Akande, Ajagbe, Bamgbose, Ghosh, Palavesam, Hamid, Oskam, Egan, Duarte-barbosa, Hekimoğlu, Szabó, Labruna and Dahal2023). The occurrence and distribution of tick-associated diseases are increasing due to urbanization and climate change (Nuttall, Reference Nuttall2021; Diuk-Wasser et al., Reference Diuk-Wasser, Fernandez and Vanwambeke2025). Furthermore, ticks are developing resistance to current control strategies (Lempereur et al., Reference Lempereur, Ghosh, Tabor, De león, Halos, Molento and de la Fuente2025; Rojas-Cabeza et al., Reference Rojas-Cabeza, Moreno-cordova, Ayala-zavala, Ochoa-teran, Sonenshine, Valenzuela and Sotelo-mundo2025).
Ticks (order Ixodida) are comprised of 3 extant families: soft ticks (Argasidae), hard ticks (Ixodidae) and Nuttalliellidae. While there are approximately 1000 tick species (Mans et al., Reference Mans, Featherston, Kvas, Pillay, De Klerk, Pienaar, De Castro, Schwan, Lopez, Teel, Pérez de león, Sonenshine, Egekwu, Bakkes, Heyne, Kanduma, Nyangiwe, Bouattour and Latif2019; Robbins et al., Reference Robbins, Nava, Ronai, Chong and Guglielmone2025), few have whole-genome assemblies (i.e. DNA sequence of the autosomes and sex chromosomes; in ticks, the heterogametic sex with different sex chromosomes is the male (Oliver, Reference Oliver1977)) available on databases. This lack of tick genome assemblies is in part due to the unique biology of ticks.
Tick biology considerations for genome sequencing
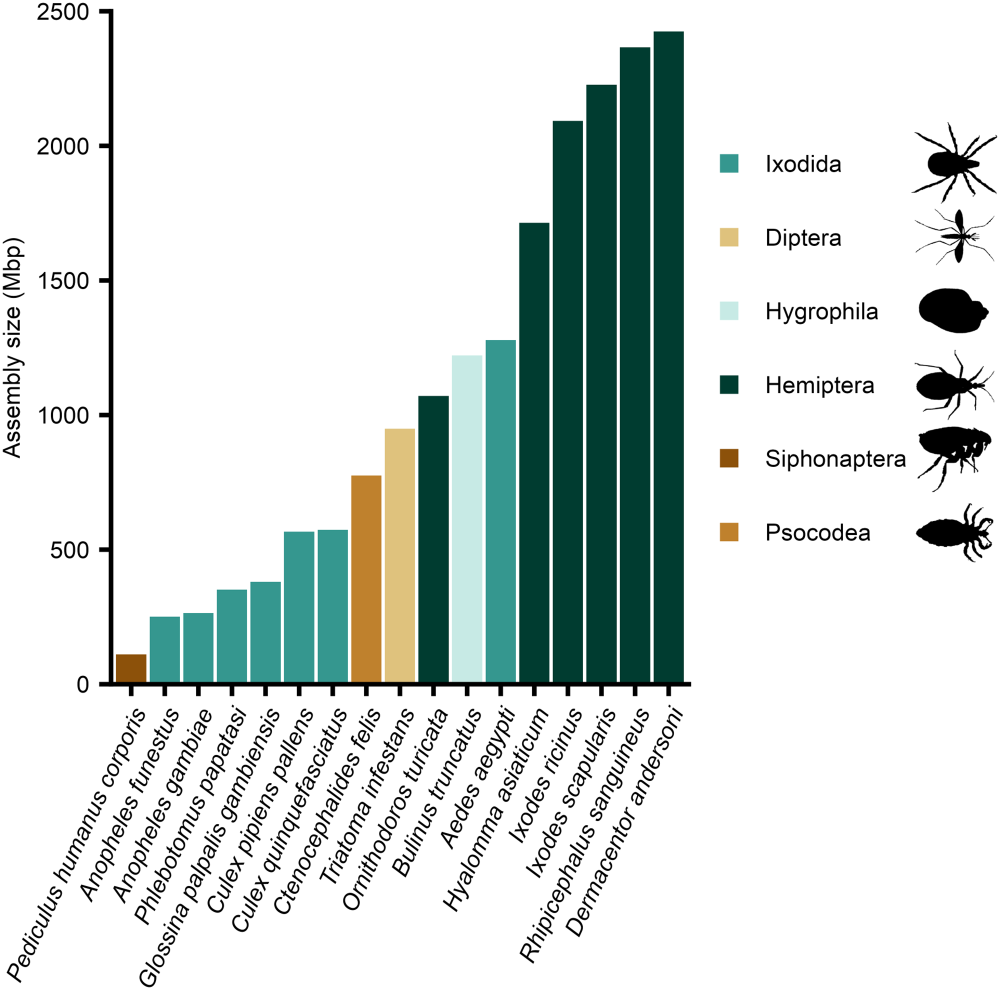
Key aspects of tick biology should be taken into consideration prior to whole-genome sequencing. Most notably, ticks have large genomes that are more similar in size to mammalian genomes than other vector species. These large genome sizes (i.e. the amount of haploid DNA material) result in ticks having large genome assembly sizes. Globally important vector species, with genome assemblies available, were identified from the World Health Organization’s list of major human vector-borne diseases (https://www.who.int/news-room/fact-sheets/detail/vector-borne-diseases). For these 17 vector assemblies, spanning 6 taxonomic orders, the 5 largest assemblies all belong to ticks (Figure 1). These tick assemblies have an average size that is up to 19 times larger than the other vector species, such as the human body louse (Figure 1). The large genome size of ticks has hindered the generation of genome assemblies, as large amounts of sequencing and bioinformatic resources are required to achieve high-quality assemblies with sufficient sequencing coverage (the number of times a single nucleotide has been sequenced).
Ticks (Ixodida) have the largest genome assembly sizes when compared with other major human disease vectors. Genome assembly size (from the NCBI database) for 17 species, spanning 6 taxonomic orders, from the World Health Organization major human vector-borne diseases list (https://www.who.int/news-room/fact-sheets/detail/vector-borne-diseases). For human vector-borne diseases associated with multiple vector species, the species associated with the highest number of disease cases and that had an available assembly is shown. When a vector species had multiple assemblies, the current reference assembly from NCBI is used. Species were ordered by assembly size, from smallest to largest.

Figure 1 Long description
The bar graph has a vertical axis labeled Assembly size comma megabase pair left parenthesis Mbp right parenthesis. The vertical axis ranges from 0 to 2500. The horizontal axis shows 17 species names as angled category labels. A legend lists six categories: Ixodida, Diptera, Hygrophila, Hemiptera, Siphonaptera, Psocodea. There are 17 vertical bars. Bar heights increase from left to right. The smallest bars are near 200 to 300 on the vertical axis. Mid bars are around 500, 600, 800, 1000, 1100 and 1200. The tallest group of bars reaches about 1700, 2100, 2200, 2300 and 2400 on the vertical axis.
Tick genomes are complex, containing numerous highly repetitive sequences. Transposable elements (mobile DNA sequences that move around the genome (Petersen et al., Reference Petersen, Armisén, Gibbs, Hering, Khila, Mayer, Richards, Niehuis and Misof2019)) are nearly 70% of some tick genome assemblies, which is amongst the highest observed in animals (Ronai et al., Reference Ronai, de Paula Baptista, Paulat, Frederick, Azagi, Bakker, Dillon, Sprong, Ray and Glenn2026). This high proportion of transposable elements in tick genomes increases their genome size and complexity, complicating genome assembly.
The body size of a tick is relatively small for an animal (unfed adult ticks are typically only a few millimetres), which results in a low total DNA yield from an individual tick (Ammazzalorso et al., Reference Ammazzalorso, Zolnik, Daniels and Kolokotronis2015). The first tick genome assembly studies were only able to obtain sufficient amounts of DNA by pooling ticks (see Gulia-Nuss et al., Reference Gulia-Nuss, Nuss, Meyer, Sonenshine, Roe, Waterhouse, Sattelle, de la Fuente, Ribeiro, Megy, Thimmapuram, Miller, Walenz, Koren, Hostetler, Thiagarajan, Joardar, Hannick, Bidwell, Hammond, Young, Zeng, Abrudan, Almeida, Ayllón, Bhide, Bissinger, Bonzon-kulichenko, Buckingham, Caffrey, Caimano, Croset, Driscoll, Gilbert, Gillespie, Giraldo-calderón, Grabowski, Jiang, Khalil, Kim, Kocan, Koci, Kuhn, Kurtti, Lees, Lang, Kennedy, Kwon, Perera, Qi, Radolf, Sakamoto, Sánchez-gracia, Severo, Silverman, Simo, Tojo, Tornador, Van zee, Vázquez, Vieira, Villar, Wespiser, Yang, Zhu, Arensburger, Pietrantonio, Barker, Shao, Zdobnov, Hauser, Grimmelikhuijzen, Park, Rozas, Benton, Pedra, Nelson, Unger, Tubio, Tu, Robertson, Shumway, Sutton, Wortman, Lawson, Wikel, Nene, Fraser, Collins, Birren, Nelson, Caler and Hill2016). However, this constraint of limited DNA input from an individual tick has been overcome by advances in sequencing workflows. In 2020, the minimum amount of high molecular weight DNA required for generating a genome assembly was achieved with single-tick DNA extractions (see Jia et al., Reference Jia, Wang, Shi, Du, Sun, Zhan, Jiang, Wang, Zhang, Ji, Bell-sakyi, Cui, Yuan, Jiang, Yang, Lam, Chang, Ding, Wang, Zhu, Ruan, Zhao, Wei, Ye, Que, Du, Zhou, Cheng, Dai, Guo, Han, Huang, Li, Wei, Gao, Liu, Shao, Wang, Wang, Yang, Huo, Li, Chen, Chen, Zhou, Ni, Tian, Sheng, Liu, Pan, Xia, Li, Zhao and Cao2020). Therefore, sequencing of individual ticks to produce high-quality tick genome assemblies has become technically feasible within the past 5 years.
A DNA extraction from a tick contains contaminants due to DNA from their hosts and microbes. Ticks typically consume at a minimum 3 bloodmeals from a host vertebrate throughout their lifecycle, potentially from multiple host species. These bloodmeals also allow the transfer of microbes from the host vertebrate to the tick (Du et al., Reference Du, Shi, Cui, Fan, Jiang, Bian, Ye, Wang, Zhang, Yuan, Xia, Ruan, Chang, Du, Que, Wang, Han, Yang, Jiang, Chen, Wang, Tan, Liu, Deng, Liu, Zhu, Pan, Wang, Lin, Li, Li, Shen, Liu, Tian, Han, Wang, Wang, Gao, Li, Xiong, Wang, Shi, Zhu, Zhu, Wang, Shi, Zhan, Liu, Feng, Zhao, Sun, Wang, Jia, Zhao and Cao2025). Furthermore, ticks possess facultative and obligate endosymbionts (Díaz-Sánchez et al., Reference Díaz-Sánchez, Estrada-peña, Cabezas-cruz and de La Fuente2019; Kolo and Raghavan, Reference Kolo and Raghavan2023). This DNA from other organisms, as well as environmental DNA, means that DNA sequencing from tick biological material generates many reads of non-tick origin (for example, 11% of total reads for an I. ricinus assembly (Ronai et al., Reference Ronai, de Paula Baptista, Paulat, Frederick, Azagi, Bakker, Dillon, Sprong, Ray and Glenn2026)). In summary, generating high-quality tick genome assemblies is challenging due to their unique biology.
Tick genome assemblies and quality assessment workflow
A comparative meta-analysis was conducted on the available tick whole-genome assemblies (see Fig. S1). The publicly available sequence databases were searched (query ‘Ixodida’): United States National Center for Biotechnology Information (NCBI); European Nucleotide Archive (ENA); and China National Center for Bioinformation (CNCB). A total of 67 tick genome assemblies were identified on the databases: NCBI (65 assemblies) or ENA (1 assembly), as of April 30, 2025; CNCB (1 assembly), as of February 28, 2025 (Fig. S1). In addition, assemblies from in-house (3 assemblies) that are now publicly available on NCBI were added to the dataset (Fig. S1). The exclusion criterion for the assemblies was any database entry that was not a tick genome assembly. Sixteen assemblies were excluded as they were endosymbiont genome assemblies or tick transcriptomes (Fig. S1, Table S1). Therefore, 54 genome assemblies, representing 24 species of tick, were characterized (Fig. S1, Table S2).
The next phase was the collection of assembly metadata. This metadata was obtained from genome databases, genome assembly publications or personal communications (Fig. S1). In particular, metadata on biological source material, sequencing platforms and annotation were collected.
For all 54 tick genome assemblies quality metrics for contiguity (auN, N50, L50 and L90) were assessed using the QUality ASsessment Tool, with the extension for large genomes greater than 100 Mbp (QUAST-LG) v.5.2.0 (Mikheenko et al., Reference Mikheenko, Prjibelski, Saveliev, Antipov and Gurevich2018). The total number of contigs reported by QUAST-LG and then assessed were the contigs greater than 0 bp, not the default QUAST-LG mode for number of contigs (i.e. contigs that are at least 3000 bp). Each assembly’s completeness was also assessed with BUSCO (Benchmarking Universal Single-copy Orthologs; a complete BUSCO score is the sum of the single-copy and duplicated genes that can be completely aligned to the assembly with 1 or more than 1 gene copy present) lineage arthropoda_odb10, using compleasm v.0.2.5 (Huang and Li, Reference Huang and Li2023). The biological source material, sequencing platforms and annotation were evaluated for their impact on tick genome assembly quality (Fig. S1).
Biological source material for genome sequencing of ticks
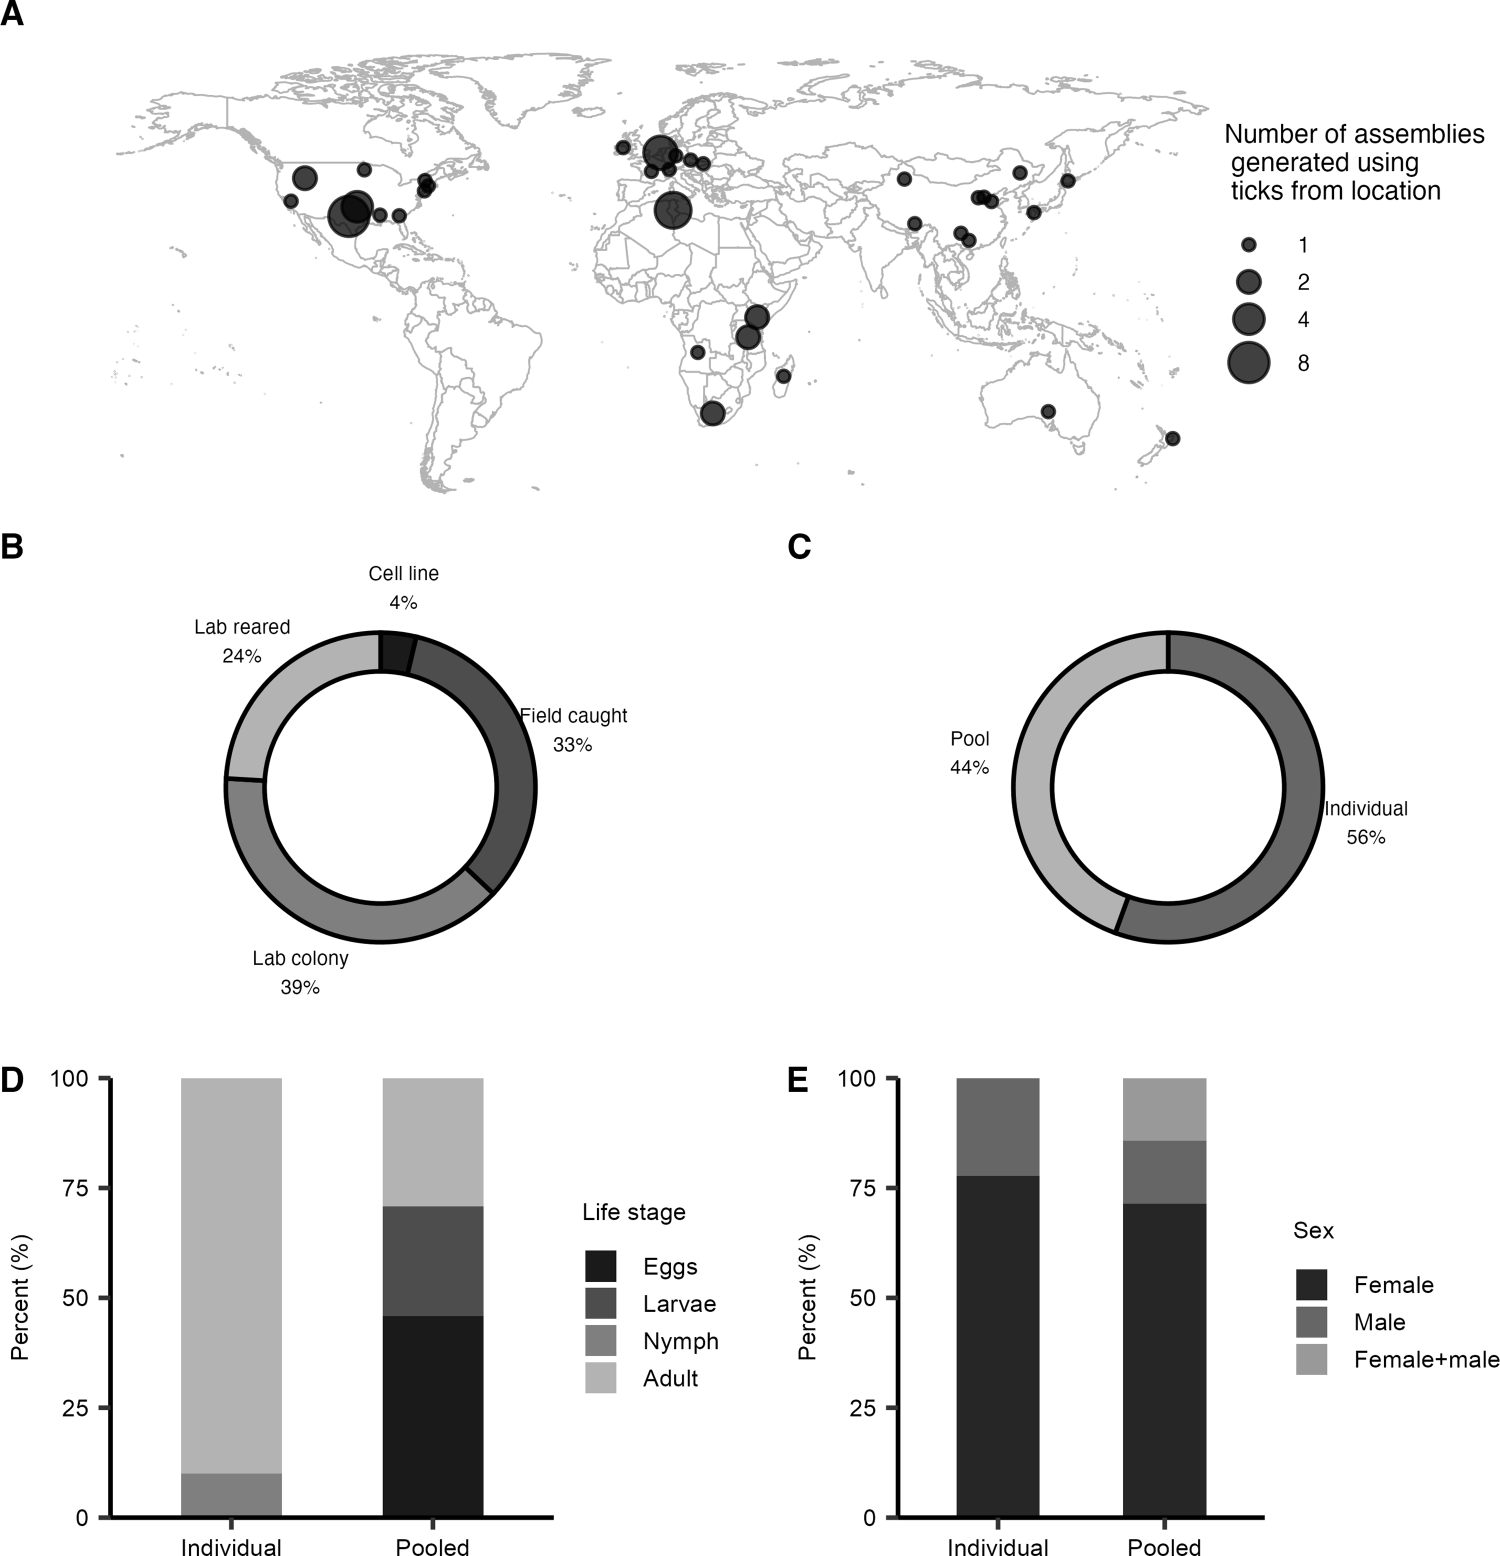
Biological material metadata was compiled for the 54 tick genome assemblies. For the zoogeographic origin (see Guglielmone et al., Reference Guglielmone, Nava and Robbins2023) of the tick material, the most assemblies (∼35%) are generated from ticks collected in the Nearctic zoogeographic region (North America), followed by ∼31% Palearctic (Europe and China) and ∼26% Afrotropical (Africa) (Figure 2A, Table S3). It is noted that some tick species are invasive and have been collected outside their native zoogeographic region and a genome assembly generated from this material, such as Haemaphysalis longicornis (see Guerrero et al., Reference Guerrero, Bendele, Ghaffari, Guhlin, Gedye, Lawrence, Dearden, Harrop, Heath, Lun, Metz, Teel, Perez de leon, Biggs, Pomroy, Johnson, Blood, Bellgard and Tompkins2019; Moustafa et al., Reference Moustafa, Barnes, Wagner, Bodine, Bendele, Teel, Saelao and Price2025). Currently, there are no genome assemblies from ticks collected in the Oriental region (South Asia and Southeast Asia) nor the Neotropical region (Central America and South America) (Figure 2A, Table S3), which have the second and fourth highest number of hard tick species (Guglielmone et al., Reference Guglielmone, Nava and Robbins2023), respectively. It is recommended that the Neotropical and Oriental zoogeographic regions be prioritized in future tick genome projects.
Biological source material for 54 tick genome assemblies. (A) Geographic origin of the tick material. Two assemblies were generated using ticks from 3 locations. (B) Collection source of the tick material. Laboratory colony ticks are maintained across generations in a lab environment. Laboratory-reared ticks are defined as those collected from the field and maintained in the laboratory until a desired life stage is obtained, not across generations. Field-caught ticks are collected from either the environment or hosts. Tick cell lines are preserved cells, typically derived from embryos. (C) Sample size of the tick material, either an individual tick or pooled ticks. (D) Life stage of the ticks in individual versus pooled material. (E) Sex of the adult ticks in individual versus pooled material. See Table S3 for further details.

Figure 2 Long description
Panel A shows a world map with circular markers indicating the number of tick genome assemblies per location. Marker size represents the count, with larger markers indicating more assemblies. Assemblies are concentrated in North America, Europe and parts of Asia. Panel B is a donut chart showing assemblies by source type: Lab colony 39 percent, Field caught 33 percent, Lab reared 24 percent, Cell line 4 percent. Lab colony is the dominant source. Panel C is a donut chart showing assemblies by sample type: Individual 56 percent, Pool 44 percent, with Individual being more common. Panel D is a stacked bar chart with the vertical axis labeled Percent, ranging from 0 to 100. It compares life stages in Individual and Pooled samples. Adults dominate in Individual, while Eggs are more prevalent in Pooled. Panel E is a stacked bar chart with the vertical axis labeled Percent, ranging from 0 to 100. It compares sex distribution in Individual and Pooled samples. Female is the dominant sex in both categories. The figure summarizes geographic sources and sample metadata breakdowns for tick genome assemblies.
For the collection source of the tick material, the highest number of assemblies are generated from tick colonies (Figure 2B, Table S3). The second highest number of assemblies are generated from ticks caught in the field and the third highest from laboratory-reared ticks that were caught in the field and maintained in the laboratory until a desired life stage had been obtained (Figure 2B, Table S3). The smallest number of assemblies are from tick cell lines (Figure 2B, Table S3). These cell lines are typically created from heterogeneous embryonic cells and maintained indefinitely in a laboratory, which leads to large-scale genome duplications, rearrangements and deletions (Kotsarenko et al., Reference Kotsarenko, Vechtova, Lieskovska, Füssy, Cabral-de-mello, Rego, Alberdi, Collins, Bell-Sakyi, Sterba and Grubhoffer2020). It is recommended that the biological source material for assemblies be obtained from laboratory colonies, laboratory-reared or field-caught.
Tick material has varied in sample size for assemblies, with ∼56% from individual ticks and ∼44% from pooled ticks (Figure 2C, Table S3). For assemblies generated from individuals, all are adult ticks, apart from 3 nymphs (Figure 2D, Table S3). For assemblies generated from pooled tick material, the highest number of assemblies came from eggs (∼46%) (Figure 2D, Table S3). For the assemblies generated from individuals, ∼78% were from adult females (Figure 2E, Table S3), most likely because they generally are larger than males resulting in higher DNA yields. Since 2020, assemblies (contigs) generated from a single individual have been feasible (Tables S2 and S3), often in conjunction with pooled DNA for high-throughput chromosome conformation capture (Hi-C) assembly scaffolding (see De et al., Reference De, Kingan, Kitsou, Portik, Foor, Frederick, Rana, Paulat, Ray, Wang, Glenn and Pal2023). While pooling individual ticks or eggs provides sufficient DNA yield for a variety of sample preparation and sequencing approaches, due to sequence variation amongst individual ticks, pooling ticks leads to a less contiguous assembly (see Cassens et al., Reference Cassens, Villalta, Aguirre, Ecklund, Stenger, Abdi, Venigalla, Shiffman, Bastug, Thielen and Faulk2025). It is recommended to prioritize tick assemblies generated from individual ticks to achieve a high-quality haploid assembly.
Tick whole-genome sequencing and assembly developments from 2011 to 2025
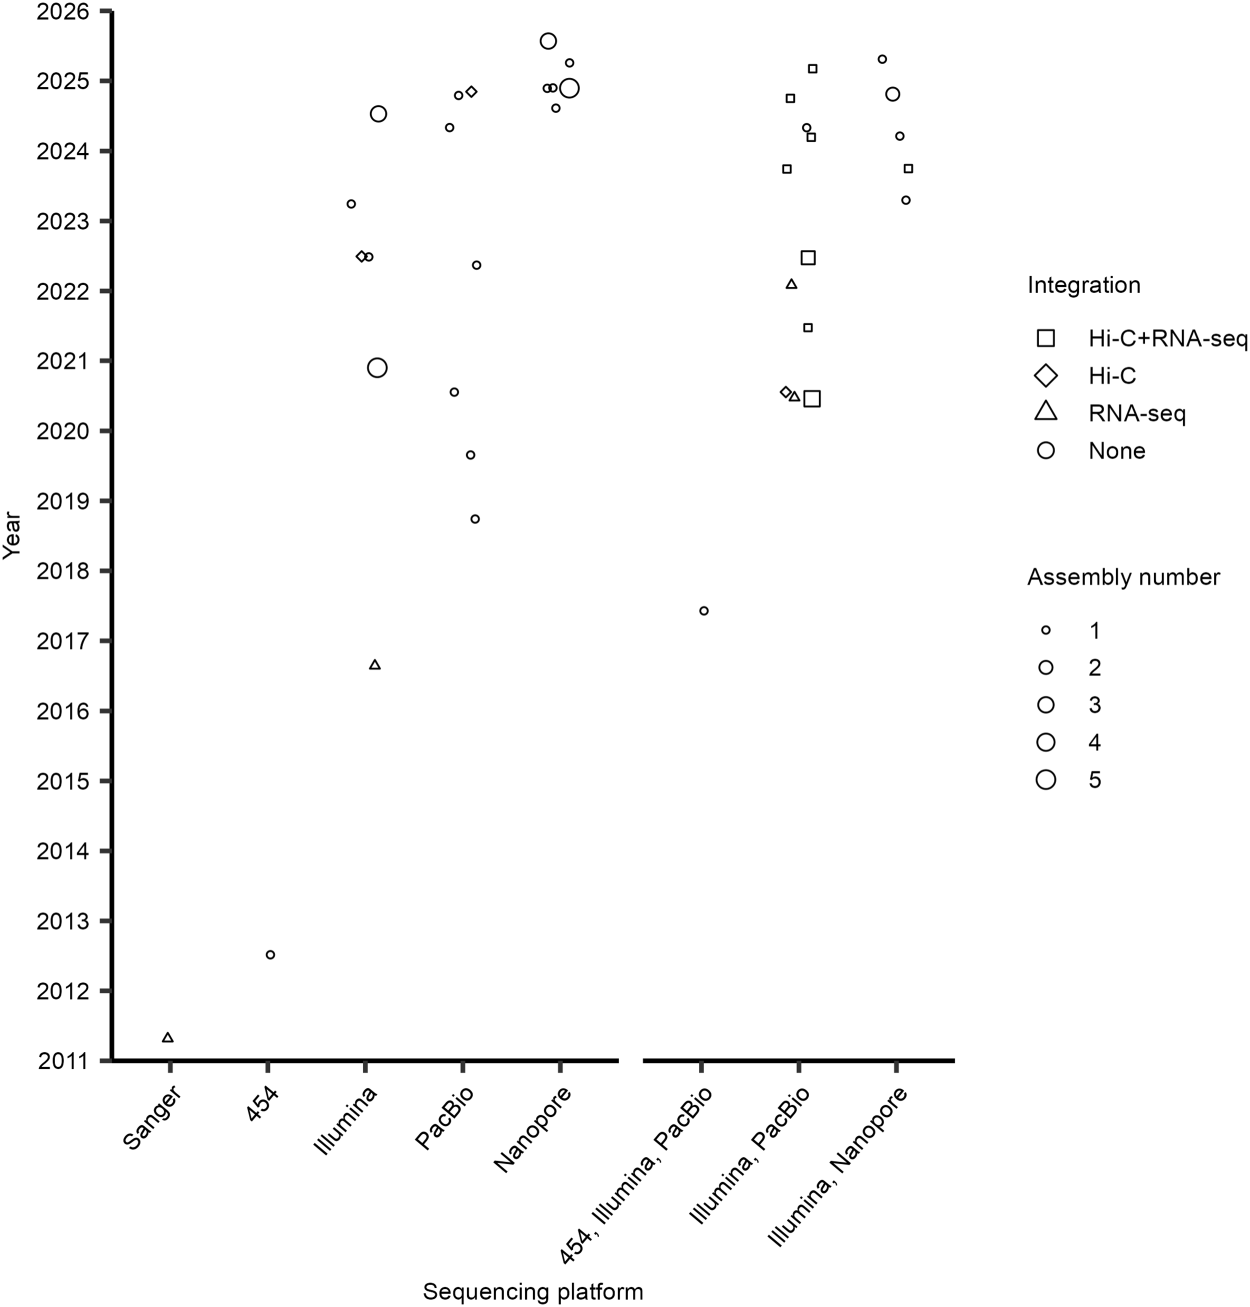
The history of the 54 tick genome assemblies was traced. The first tick assembly (JCVI_ISG_i3_1.0) was for the species Ixodes scapularis, with the assembly publicly available on the NCBI genome database in 2011 (Figure 3, Table S2) and paper published in 2016 (Gulia-Nuss et al., Reference Gulia-Nuss, Nuss, Meyer, Sonenshine, Roe, Waterhouse, Sattelle, de la Fuente, Ribeiro, Megy, Thimmapuram, Miller, Walenz, Koren, Hostetler, Thiagarajan, Joardar, Hannick, Bidwell, Hammond, Young, Zeng, Abrudan, Almeida, Ayllón, Bhide, Bissinger, Bonzon-kulichenko, Buckingham, Caffrey, Caimano, Croset, Driscoll, Gilbert, Gillespie, Giraldo-calderón, Grabowski, Jiang, Khalil, Kim, Kocan, Koci, Kuhn, Kurtti, Lees, Lang, Kennedy, Kwon, Perera, Qi, Radolf, Sakamoto, Sánchez-gracia, Severo, Silverman, Simo, Tojo, Tornador, Van zee, Vázquez, Vieira, Villar, Wespiser, Yang, Zhu, Arensburger, Pietrantonio, Barker, Shao, Zdobnov, Hauser, Grimmelikhuijzen, Park, Rozas, Benton, Pedra, Nelson, Unger, Tubio, Tu, Robertson, Shumway, Sutton, Wortman, Lawson, Wikel, Nene, Fraser, Collins, Birren, Nelson, Caler and Hill2016). This genome project resulted from a 2004 community white paper, with I. scapularis prioritized due to its medical importance in the United States, as the key tick species associated with Lyme disease (Hill and Wikel, Reference Hill and Wikel2005). The JCVI_ISG_i3_1.0 assembly is the only tick assembly to use Sanger dideoxy chain termination on capillary instruments (first-generation sequencing) (Satam et al., Reference Satam, Joshi, Mangrolia, Waghoo, Zaidi, Rawool, Thakare, Banday, Mishra, Das and Malonia2023). The high amount of DNA input required for cloning Sanger sequencing templates required pooling many individual ticks. The resulting modest length reads were unable to produce a highly contiguous assembly due to the high proportion of transposable elements and variation among individuals in the pool.
Timeline of 54 tick genome assemblies, first release was in 2011. Each point is the assembly release date on a database; up to 5 tick assemblies have been released together. Sequencing platforms are in chronological order, with first generation (Sanger or 454-FLX), second generation (Illumina) and third generation (PacBio or Nanopore). Followed by combinations of sequencing platforms. Integrations to the sequencing platforms were none, RNA-seq alone, Hi-C alone or Hi-C with RNA-seq. See Table S2 for further details.

In the 2010s, tick genome assemblies started using second-generation sequencing. Assemblies CCG_Rmi1.0 and Rmi2.0 of the tick Rhipicephalus microplus used 454-pyrosequencing (Figure 3, Table S2). This sequencing platform obtains millions of ∼500 nt reads at a time, reducing costs compared to Sanger sequencing, but also had limitations in handling repetitive DNA (Satam et al., Reference Satam, Joshi, Mangrolia, Waghoo, Zaidi, Rawool, Thakare, Banday, Mishra, Das and Malonia2023). In 2016, the first tick assembly using the Illumina short read sequencing platform was released (Figure 3, Table S2). Illumina reads are most commonly paired-end 100 or 150 nt (i.e., 200 or 300 nt total), and sequencing is massively paralleled for high throughput, providing higher sequencing coverage (Satam et al., Reference Satam, Joshi, Mangrolia, Waghoo, Zaidi, Rawool, Thakare, Banday, Mishra, Das and Malonia2023). As Illumina uses short reads, it is unable to reliably map or assemble the long repetitive regions present in tick genomes.
In 2017, the first tick assembly using a third-generation sequencing platform, PacBio, was released (Figure 3, Table S2). PacBio has a specialized library preparation (double-stranded DNA is circularized via SMRTbell adapters) and single-molecule sequencing to generate long reads (up to ∼100 kb for single-pass CLR reads or modal length of ∼20 kb when sequenced repeatedly for HiFi reads), which can handle the repetitive genomes of ticks. Initially, PacBio CLR reads were used for tick assemblies to improve contiguity (Miller et al., Reference Miller, Koren, Dilley, Harkins, Stockwell, Shabman and Sutton2018), and Illumina reads were often used in combination to correct uncalled or miscalled bases (Figure 3, Table S2). The current PacBio standard is HiFi reads, which have improved base-calling accuracy and reduced the need for Illumina error correction (Wenger et al., Reference Wenger, Peluso, Rowell, Chang, Hall, Concepcion, Ebler, Fungtammasan, Kolesnikov, Olson, Töpfer, Alonge, Mahmoud, Qian, Chin, Phillippy, Schatz, Myers, DePristo, Ruan, Marschall, Sedlazeck, Zook, Li, Koren, Carroll, Rank and Hunkapiller2019). Between 2020 and 2023, 22 tick assemblies were released, and over half used the PacBio sequencing platform (Figure 3, Table S2).
In 2023, the first tick assembly using the Oxford Nanopore Technologies (hereafter Nanopore) sequencing platform (another third-generation sequencer) was released (Figure 3, Table S2). This platform generates long reads (50 bp to >4 Mbp) in real time via flow cells with nanopores (Branton et al., Reference Branton, Deamer, Marziali, Bayley, Benner, Butler, Di ventra, Garaj, Hibbs, Huang, Jovanovich, Krstic, Lindsay, Ling, Mastrangelo, Meller, Oliver, Pershin, Ramsey, Riehn, Soni, Tabard-cossa, Wanunu, Wiggin and Schloss2008). While Nanopore base-calling accuracy has greatly improved over time, ∼33% of Nanopore tick assemblies have been generated in combination with Illumina short reads to correct base-calling errors (Figure 3, Table S2). In 2024, 20 tick assemblies were released, the most for a single year. These assemblies were ∼40% Nanopore with the remaining using combinations of Nanopore or PacBio, with Illumina (Figure 3, Table S2). By April 2025, 6 assemblies had been released, with 4 using Nanopore (Figure 3). The accuracy of Nanopore reads has now improved sufficiently that Illumina reads are often no longer necessary for error correction(Mostafa, Reference Mostafa2024).
The development of new sequencing methods and platforms has been critical for overcoming the limitations of tick biology (particularly, the large genome sizes and high proportion of repeats), leading to an increasing number of tick genome assemblies. Standalone first-generation sequencing generated ∼4% of tick assemblies, second-generation sequencing ∼20% and third-generation sequencing ∼39% (Figure 3, Table S2). In addition, ∼37% of tick genome assemblies have been generated using combinations of different generation sequencing (Figure 3, Table S2). In summary, advances in sequencing technologies have driven a dramatic recent increase in tick assemblies from 2011 to 2025.
For the 54 tick assemblies, ∼37% used 1 or more integrations (Hi-C or RNA-sequencing) to the sequencing platform. Hi-C is a molecular approach that improves the contiguity of an assembly (Satam et al., Reference Satam, Joshi, Mangrolia, Waghoo, Zaidi, Rawool, Thakare, Banday, Mishra, Das and Malonia2023), which is advantageous for the large and repetitive tick genomes. RNA-seq provides direct evidence of transcription, alongside the DNA coding sequences and isoforms (Guizzo et al., Reference Guizzo, Mans, Pienaar and Ribeiro2023). For the 20 assemblies that used integrations, 55% had both Hi-C and RNA-sequencing, 30% RNA-sequencing alone and 15% Hi-C alone (Figure 3, Table S2). In mid-2020, the first tick assembly with Hi-C integrated was released; since then, ∼26% of assemblies have Hi-C integrated (Figure 3, Table S2).
Lack of standardized annotation of tick genome assemblies
Annotation of genes and repetitive elements (particularly, transposable elements) in tick genome assemblies has not yet been standardized. These non-standardized annotations currently limit the ability to compare the genes and repetitive elements between tick assemblies, even for the same species.
Genome assemblies commonly include gene annotation. Tick assemblies have the number of protein-coding genes reported or the total number of genes reported, sometimes both numbers are reported (Table S2). It is recommended that future tick genome studies report both protein-coding genes and total genes.
Gene annotation has been performed for 30 tick assemblies, representing 18 species (Fig. S2, Table S2). Four common annotation approaches have been used. First, a custom automated gene annotation pipeline created for each assembly, used on 7 tick assemblies, with a median of ∼27 100 total genes and ∼26 400 protein-coding genes (Fig. S2, Table S2). Second, taking a custom automated annotation pipeline with RNA-seq data (either pre-existing or generated alongside the genome assembly) integrated using gene modelling programs (such as AUGUSTUS and BRAKER (Stanke et al., Reference Stanke, Schöffmann, Morgenstern and Waack2006, Reference Stanke, Diekhans, Baertsch and Haussler2008)), used on 20 tick assemblies with a median of ∼28 500 total genes and ∼26 700 protein-coding genes (Fig. S2, Table S2). Third, manual curation preceded by an automated pipeline that integrated RNA-seq and proteome data, used on 1 tick assembly, with ∼22 500 protein-coding genes (Fig. S2, Table S2). Fourth, requesting NCBI to perform a RefSeq automated annotation (NCBI Eukaryotic Genome Annotation Pipeline (Thibaud-Nissen et al., Reference Thibaud-Nissen, Souvorov, Murphy, DiCuccio and Kitts2013)), which incorporates RNA-seq and proteome data from NCBI, used on 7 tick assemblies with a median of ∼27 000 total genes and ∼26 900 protein-coding genes (Fig. S2, Table S2). While 4 gene annotation approaches have been used and resulted in variable gene number estimates, the median number for total genes (15 assemblies) across the 4 approaches is between ∼27 000 and ∼28 500 and protein-coding genes (24 assemblies) is between ∼22 500 and ∼26 900. It is recommended that future tick genome studies integrate transcriptomes and the assembly be submitted to NCBI for annotation to achieve robust gene annotation.
As tick genomes are highly repetitive, annotation of these repetitive elements is important. Repetitive elements have been annotated in 25 tick genome assemblies, representing 15 species (Fig. S3, Table S2). Commonly, repetitive elements are annotated using an automated pipeline, such as one or a combination of RepeatModeler (Flynn et al., Reference Flynn, Hubley, Goubert, Rosen, Clark, Feschotte and Smit2020) and RepeatMasker (Smit et al., Reference Smit, Hubley and Green2015). Automated pipelines used on 22 tick assemblies result in a median of ∼62% repetitive DNA, which, when further classified, is ∼1.7% tandem repeats and ∼59% transposable elements (Fig. S3A, Table S2). In studies where the transposable elements have been further classified, the median is ∼19% class I, ∼3.7% class II and ∼5.1% unclassified (Fig. S3B, Table S2). Manual curation of repetitive elements has been used on 3 Ixodes assemblies from one study (Ronai et al., Reference Ronai, de Paula Baptista, Paulat, Frederick, Azagi, Bakker, Dillon, Sprong, Ray and Glenn2026) with a median of 73% repetitive DNA, comprising ∼4.3% tandem repeats and ∼68% transposable elements (Fig. S3A, Table S2). Further classification of the transposable elements results in a median of ∼32% class I and ∼36% class II (Fig. S3B, Table S2). It is recommended that future tick genome studies perform manual curation of the transposable elements until a robust automated pipeline is established.
Quality assessment of tick genome assemblies
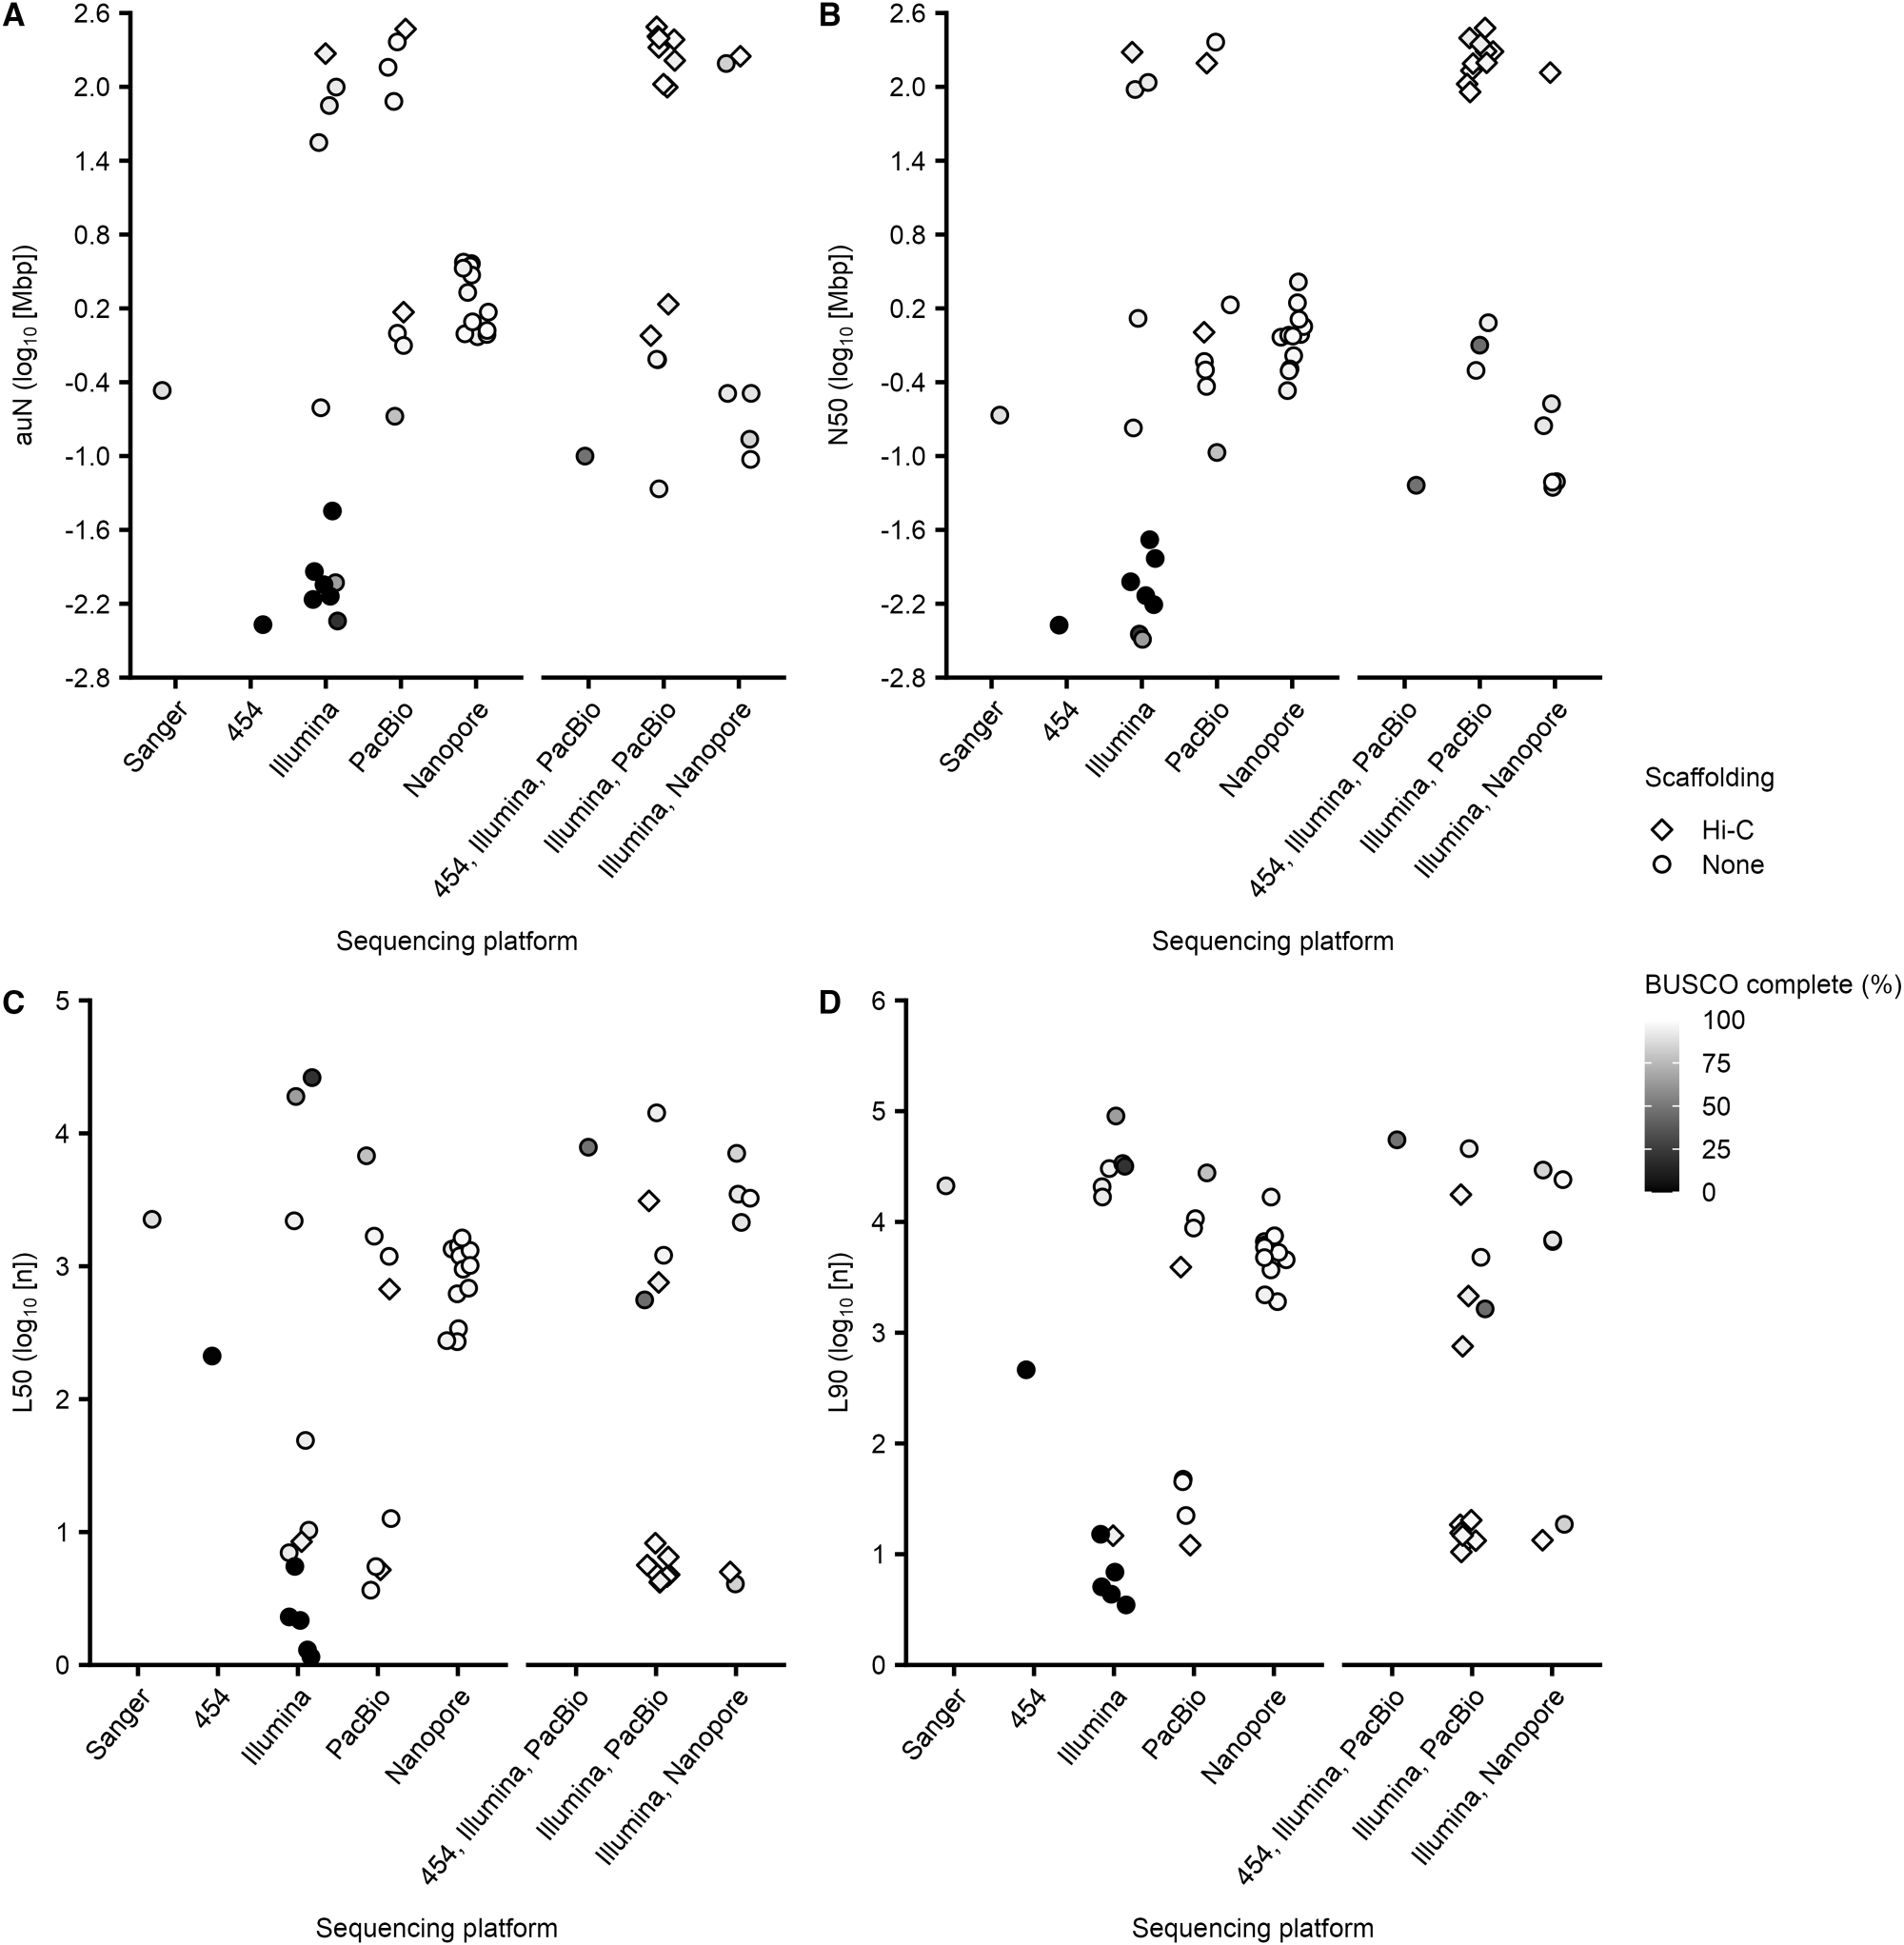
The impact of sequencing platform and integration of Hi-C scaffolding on tick assembly quality, using metrics for contiguity (auN, N50, L50 and L90) and assembly completeness (complete BUSCO scores), was comprehensively assessed. Sanger and 454-FLX sequencing platforms were used for the first 2 tick assemblies ever released (Table S2), generating highly fragmented assemblies (Figure 4A–D, Table S4). While the complete BUSCO score for the Sanger assembly was close to 90%, the 454-FLX partial assembly was close to 0% (Figure 4A–D, Table S5).
Quality metrics for 54 tick genome assemblies across sequencing platforms. (A) auN (comprehensive metric for contiguity), as auN increases so does assembly quality. (B) Contig N50 (the length of the shortest contig that must be included to cover half an assembly), as N50 increases, fewer longer contigs are used to cover half of the assembly, leading to a higher-quality assembly. (C) L50 (minimal number of contigs that cover 50% of the assembly), as L50 decreases assembly quality can increase, however, the BUSCO score needs to be included in the assessment. (D) L90 (minimal number of contigs that cover 90% of the assembly), as L90 decreases assembly quality can increase, however, the BUSCO score needs to be included in the assessment. Each point is a genome assembly. Sequencing platforms were ordered by first generation (Sanger and 454-FLX), second generation (Illumina) and third generation (PacBio and Nanopore), then followed by sequencing platform combinations. Scaffolding for the sequencing platforms was none or Hi-C. Complete BUSCO score (the sum of the single-copy and duplicated genes that can be completely aligned to the assembly with 1 or more than 1 gene copy present), a higher BUSCO score indicates higher assembly completeness and a higher quality assembly. See Tables S2, S4 and S5 for further details.

Figure 4 Long description
The image contains four scatter plots comparing sequencing platforms based on different metrics. The horizontal axis for all plots is labeled ′Sequencing platform′ with categories: Sanger, 454, Illumina, PacBio, Nanopore, 454 plus Illumina and PacBio, Illumina plus PacBio, Illumina plus Nanopore. The legend indicates scaffolding types: Hi-C (diamond) and None (circle) and BUSCO completeness is shown by grayscale intensity. Plot A shows auN log10 (Mbp) on the vertical axis, ranging from negative 2.8 to 2.6. Plot B displays N50 log10 (Mbp) on the vertical axis, with the same range as the auN plot. Plot C presents L50 log10 (n) on the vertical axis, ranging from 0 to 5. Plot D shows L90 log10 (n) on the vertical axis, ranging from 0 to 6. Platforms with higher auN and N50 also show lower L50 and L90, reinforcing the quality trend. Overall, platforms with Hi-C scaffolding generally exhibit better assembly metrics across all plots.
The Illumina sequencing platform has been used for 12 tick assemblies (Table S2). Only one Illumina assembly (that first constructed a 10X Genomics library) integrated Hi-C, I. ricinus (IXRI_v2), generating the highest quality Illumina tick assembly with a ∼95% complete BUSCO score (Figure 4A–D, Tables S4 and S5). The other 11 Illumina assemblies are more fragmented, and 7 did not produce sufficient reads to cover the genome, resulting in lower complete BUSCO scores of 0 to ∼65% (Figure 4A–D, Tables S4 and S5). Therefore, short read platforms without Hi-C are unlikely to be sufficient to handle the genome complexity of ticks.
The PacBio sequencing platform has been used for 8 tick assemblies, with 2 integrating Hi-C (Table S2). The remaining 6 PacBio assemblies without Hi-C varied in quality (Figure 4A–D, Tables S4 and S5). A combination of PacBio error-corrected with Illumina short reads has been used for 13 tick assemblies (Table S2). Twelve of these assemblies have complete BUSCO scores over 92%, indicating sufficient sequencing coverage of the genome (Figure 4A–D, Tables S4 and S5). Ten of these thirteen assemblies integrated Hi-C, and the three without Hi-C were lower in quality regarding contiguity and coverage (Figure 4A–D, Tables S4 and S5). It is suggested that Hi-C positively impacts assembly contiguity and quality for PacBio tick assemblies, with or without Illumina.
The Nanopore sequencing platform has been used for 12 tick assemblies (Table S2). These assemblies overlap in quality with the Illumina, PacBio and PacBio with Illumina assemblies (Figure 4A–D, Tables S4 and S5). None of the Nanopore assemblies integrated Hi-C (Figure 4A–D). The quality and contiguity of Nanopore assemblies are moderate when compared to the other sequencing platforms. A combination of Nanopore error-corrected with Illumina short reads has been used for 6 tick assemblies (Table S2). The Nanopore with Illumina assemblies had a ∼91% average complete BUSCO value, which was unexpectedly lower than that of the standalone Nanopore assemblies with ∼97% average complete BUSCO (Figure 4A–D, Tables S4 and S5). One of the Nanopore with Illumina assemblies integrated Hi-C, which had higher quality and contiguity compared to those without Hi-C (Figure 4A–D, Tables S4 and S5). The quality of the remaining 5 Nanopore with Illumina assemblies, but without Hi-C, while similar in contiguity had lower complete BUSCO scores compared to the standalone Nanopore tick assemblies (Figure 4A–D, Tables S4 and S5). Therefore, the highest quality Nanopore assembly integrated Hi-C.
Across all the sequencing platform assemblies, integrating Hi-C had higher contiguity, quality and completeness compared to assemblies without Hi-C (Figure 4A–D, Tables S4 and S5). Additionally, assemblies generated by a combination of long-read platforms (PacBio and Nanopore) then error-corrected with Illumina reads had, on average, better contiguity but lower genome completeness compared to those generated by long-read platforms without error-correction, suggesting a trade-off in contiguity versus errors (Figure 4A–D, Tables S4 and S5). In summary, it is recommended that future tick genome assembly projects use long-read sequencing platforms with integration of Hi-C scaffolding to produce high-quality assemblies.
Characterization of high-quality tick assemblies
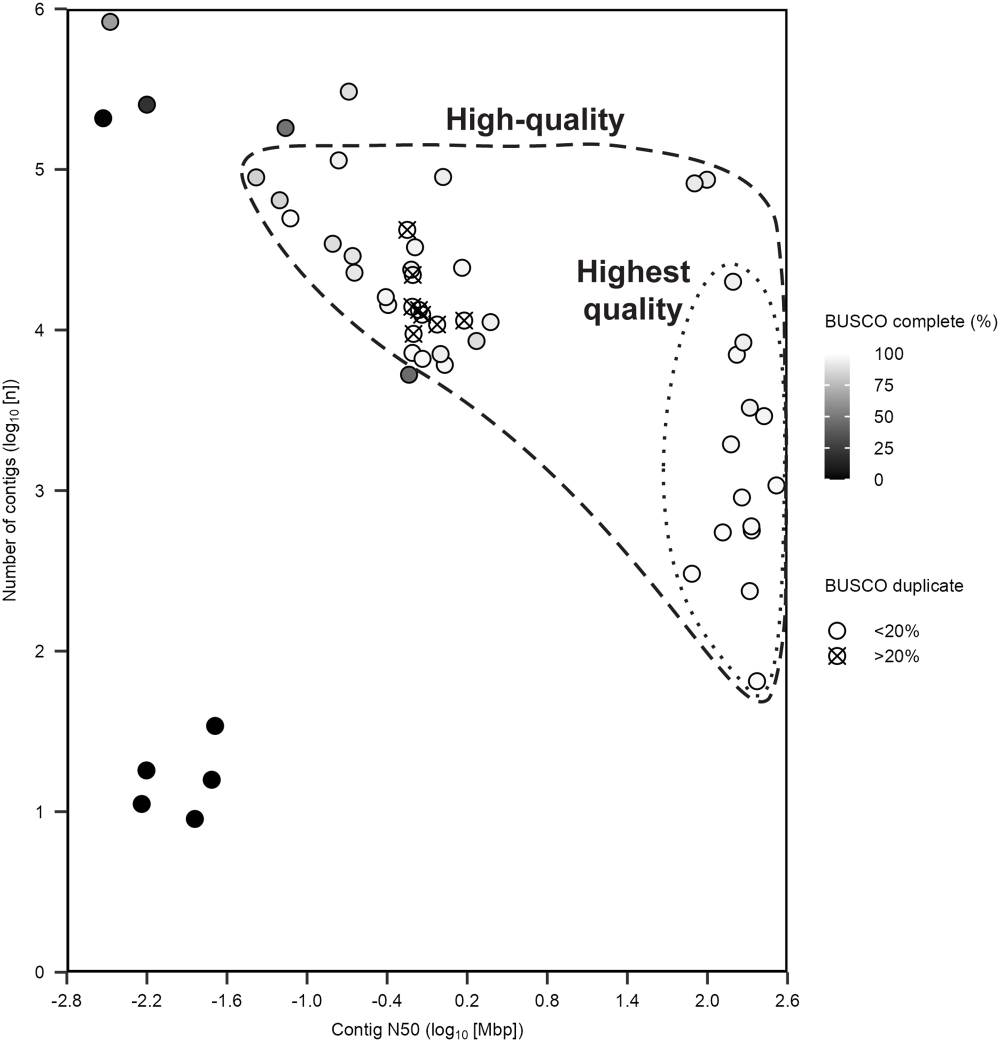
The quality of the 54 tick genome assemblies was assessed using 4 metrics (number of contigs, contig N50, complete BUSCO score and duplication BUSCO score) to identify 35 high-quality tick genome assemblies that are suitable for downstream analyses (Figure 5). These high-quality assemblies have under 126 000 contigs, a contig N50 over 0.045 Mbp, a complete BUSCO score over 83% and a duplicate BUSCO score under 20% (Figure 5, Tables S4–S6, Fig. S1). The median number of contigs is 8198, contig N50 is 1.589 Mbp, complete BUSCO is 96% and duplicate BUSCO is 2.8%. High-quality assemblies of other arthropod taxa have N50s over 0.01 Mbp and >90% complete BUSCOs (Feron and Waterhouse, Reference Feron and Waterhouse2022). The 35 high-quality tick assemblies have all been generated since 2020 (Figure 3); the sequencing platforms are 14.3% Illumina, 17.1% Nanopore, 17.1% Nanopore + Illumina, 20.0% PacBio and 31.4% PacBio + Illumina (Figure 5, Tables S4–S6). Forty percent of the high-quality tick assemblies integrated Hi-C (Figure 5, Tables S4–S6).
Quality assessment of 54 tick genome assemblies. Identified 35 high-quality assemblies (dashed line cluster), including a sub-group of 14 highest quality assemblies (dotted line cluster). Each dot is a genome assembly. Contig N50 is the length of the shortest contig that must be included to cover half an assembly, a higher N50 means fewer small contigs, which is a more complete, less fragmented assembly. Number of contigs (greater than 0 bp), fewer contigs typically results in a more contiguous assembly as there is less fragmentation. However, few contigs associated with a low N50 can lead to poor assembly quality. Complete BUSCO score, a higher BUSCO score indicates higher assembly completeness and a higher quality assembly. Duplicate BUSCO score, a lower duplication BUSCO score indicates a higher quality pseudo-haploid assembly. See Tables S4–S6 for further details.

A cluster of 14 tick assemblies that are the highest quality was identified, which have under 17 500 contigs, a contig N50 over 84 Mbp, a complete BUSCO score over 93% and a duplicate BUSCO score less than 10% (Figure 5, Tables S4–S6, Fig. S1). These 14 highest-quality assemblies have all been generated since 2020 (Figure 3); the sequencing platforms are ∼7% Illumina, ∼7% Nanopore + Illumina, ∼21% PacBio and ∼64% PacBio + Illumina (Figure 5, Tables S4–S6). All 14 highest-quality tick assemblies integrated Hi-C, except for the USDA_Rmic assembly (Figure 5, Table S2). The use of comprehensive metrics for the high-quality tick assemblies means future tick assembly projects now have metrics to benchmark against.
Tick species with high-quality genome assemblies
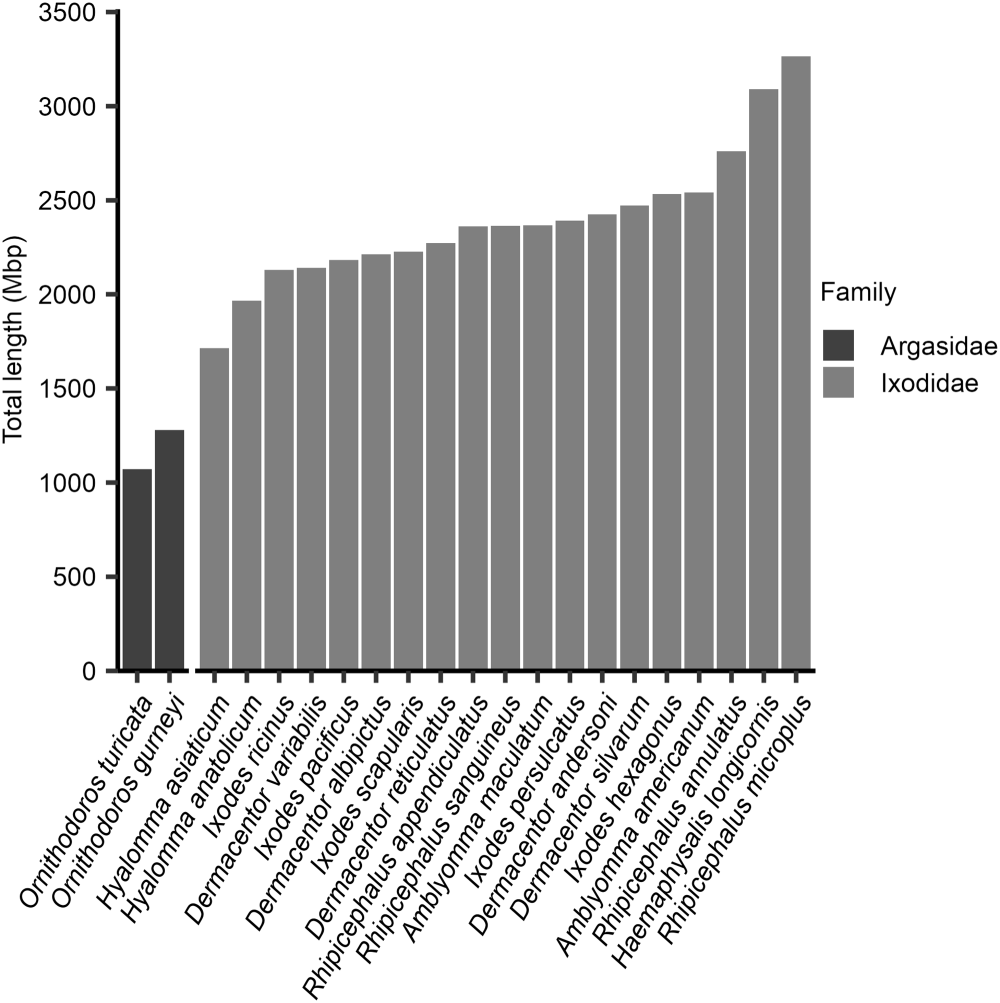
The 35 high-quality genome assemblies represent 21 species of tick (Figure 6). As some species have multiple high-quality assemblies, the best-quality assembly for each of the 21 tick species (Figure 6, Table S6) was determined.
Assembly total length of the best-quality genome assembly for 21 tick species. The best assembly for each tick species was identified from the high and highest quality assemblies. Tick species were ordered by assembly total length, from smallest to largest. Assemblies are grouped by taxonomic family; the soft tick species (Argasidae) and hard tick species (Ixodidae). See Table S6 for further details.

Figure 6 Long description
The bar graph has a vertical axis labeled Total length left (Mbp) with tick marks from 0 to 3500. The horizontal axis lists tick species names. A legend titled Family lists Argasidae and Ixodidae. Bars increase from left to right. The leftmost bar is near 1100. Many middle bars fall between about 2000 and 2600. The tallest bars at the right end are near 3400.
For the 21 best-quality assemblies, hard ticks have an average assembly length of ∼2390 Mbp and soft ticks ∼1176 Mbp (Figure 6, Table S4). Rhipicephalus spp. have the largest assembly length across all the tick species, with an average of ∼2689 Mbp. The 2 Hyalomma spp. have the smallest assembly lengths for the hard ticks, with an average of ∼1840 Mbp (Figure 6, Table S4). The 2 soft tick Ornithodoros spp. have the smallest assembly lengths for all ticks, with an average of ∼1176 Mbp (Figure 6, Table S4). These reported assembly sizes (length of gapped DNA sequence), however, are not directly equivalent to the ‘genome size’. The average genome size of 7 hard tick species is 2671 Mbp and 2 soft tick species is 1281 Mbp using flow cytometry (Geraci et al., Reference Geraci, Spencer johnston, Paul Robinson, Wikel and Hill2007). Tick assembly size (NCBI assembly size or QUAST assembly total length) is on average 95.5% of the genome size (Table S7), n = 16. Overall, it is hypothesized that hard ticks have larger genomes compared to soft ticks (Figure 6) due to a higher proportion of repetitive elements (Fig. S2A).
The 21 species with high-quality assemblies are 2 soft ticks (Argasidae) and 19 hard ticks (Ixodidae); the hard ticks are 5 Ixodes spp. and 14 non-Ixodes spp. (Table S7). These assemblies are 0.9% (2/216) of soft tick species and 2.4% (19/786) of hard tick species (Mans et al., Reference Mans, Featherston, Kvas, Pillay, De Klerk, Pienaar, De Castro, Schwan, Lopez, Teel, Pérez de león, Sonenshine, Egekwu, Bakkes, Heyne, Kanduma, Nyangiwe, Bouattour and Latif2019; Robbins et al., Reference Robbins, Nava, Ronai, Chong and Guglielmone2025). It is recommended that soft tick species be prioritized for genome sequencing. So far, the tick species sequenced are those of medical and veterinary importance. Therefore, it is also recommended that future tick genome projects prioritize capturing the diversity of tick species.
Conclusions
In summary, 54 tick genome assemblies were assessed, and 35 high-quality assemblies for 21 tick species were identified. This assessment of the tick genome assemblies provided an opportunity to make evidence-based recommendations for future tick genome assembly projects. It is recommended that future assemblies better represent the biodiversity of tick species, particularly the soft ticks and species from unrepresented zoogeographic regions. In addition, to obtain the highest-quality tick genome assemblies, future studies should prioritize obtaining individual, adult ticks for DNA extractions and use long-read sequencing platforms integrated with Hi-C scaffolding and transcriptomes. To achieve the best-quality gene and repetitive element annotations future studies should prioritize manual curation. These recommendations will hopefully be helpful for future tick genome assembly studies.
Major developments in sequencing technologies have helped overcome the biological challenges of tick genomes. However, there are genomic resources that are well established in other non-model arthropods, which are still needed for ticks. These genomic resources include: a chromosome-anchored reference genome using fluorescent in situ hybridization (FISH) (Sharakhova et al., Reference Sharakhova, Artemov, Timoshevskiy and Sharakhov2018) and cross-species whole genome alignments (van der Heijden et al., Reference van der Heijden, Näsvall, Seixas, Beserra Nobre, Maia, Salazar-carrión, Walker, Szczerbowski, Schulz, Warren, Córdova, Sánchez-carvajal, Chandi, Arias-cruz, Rueda, Salazar, Dasmahapatra, Montgomery, McClure, Absolon, Mathers, Santos, McCarthy, Wood, Lamas, Bacquet, Freitas, Willmott, Jiggins, Elias and Meier2025). In addition, new sequencing technologies to further advance tick genomes include Assay for Transposase-Accessible Chromatin with sequencing (ATAC-seq) (Buenrostro et al., Reference Buenrostro, Giresi, Zaba, Chang and Greenleaf2013) to characterize regulatory elements, and Telomere-to-Telomere (T2T) gapless sequencing (Nurk et al., Reference Nurk, Koren, Rhie, Rautiainen, Bzikadze, Mikheenko, Vollger, Altemose, Uralsky, Gershman, Aganezov, Hoyt, Diekhans, Logsdon, Alonge, Antonarakis, Borchers, Bouffard, Brooks, Caldas, Chen, Cheng, Chin, Chow, de Lima, Dishuck, Durbin, Dvorkina, Fiddes, Formenti, Fulton, Fungtammasan, Garrison, Grady, Graves-lindsay, Hall, Hansen, Hartley, Haukness, Howe, Hunkapiller, Jain, Jain, Jarvis, Kerpedjiev, Kirsche, Kolmogorov, Korlach, Kremitzki, Li, Maduro, Marschall, McCartney, McDaniel, Miller, Mullikin, Myers, Olson, Paten, Peluso, Pevzner, Porubsky, Potapova, Rogaev, Rosenfeld, Salzberg, Schneider, Sedlazeck, Shafin, Shew, Shumate, Sims, Smit, Soto, Sović, Storer, Streets, Sullivan, Thibaud-Nissen, Torrance, Wagner, Walenz, Wenger, Wood, Xiao, Yan, Young, Zarate, Surti, McCoy, Dennis, Alexandrov, Gerton, O’neill, Timp, Zook, Schatz, Eichler, Miga and Phillippy2022) to characterize structural elements. These additional approaches, alongside advances in genome assembly software, will greatly improve understanding of tick genomes and tick biology.
With the availability of high-quality tick genome assemblies, there are opportunities to improve understanding of tick biology. For example, comparative genomic analysis has found that tick genomes retain largely intact animal ancestral linkage groups, placing them amongst the less derived arthropod genomes (see Figure 5 of Schultz et al. Reference Schultz, Blümel, Destanović, Sarigol and Simakovin press). Also, the tick genome assemblies have been essential for advancing tick research, from tick vectorial capacity (Frederick et al., Reference Frederick, Thompson, Sharma, Dharmarajan, Ronai, Pesapane, Smith, Sundstrom, Tsao, Tuten, Yabsley and Glenn2023) to anti-tick vaccines (Hart et al., Reference Hart, Cui, Telford, Marín-lópez, Calloway, Dai, Matias, DePonte, Jaycox, DeBlasio, Hoornstra, Belperron, Cibichakravarthy, Johnson, Alameh, Dwivedi, Hovius, Bockenstedt, Weissman, Ring and Fikrig2025). The tick genome assemblies have so far been referred to or used in more than 130 publications (Table S8), since 2011. These publications have 4 key themes: identifying gene targets for anti-tick vaccination studies, tick control and acaricide resistance; annotation of repetitive elements; intra-species and inter-species comparative genomics studies; and ‘omic studies of transcriptomics and proteomics. In summary, the tick genome assemblies have enabled major advances in understanding tick biology. New tick genome assemblies will provide further insights into the fascinating biology of these important blood-feeding parasites.
Supplementary material
The supplementary material for this article can be found at https://doi.org/10.1017/S0031182026102273.
Acknowledgements
We thank all the researchers who have pushed the boundaries of tick genomics and shared with us unpublished information. In particular, we thank the following researchers for their willingness and transparency to provide information on unpublished tick genome assemblies that they have released on databases, in alphabetical order: Joshua Benoit, Seemay Chou, Christopher Faulk, Jan Forth, Melissa Klein, Michel Labuschagne, Susan Noh, Pia Olafson, Perot Saelao, Ryan O. M. Rego, Claude Rispe, Hailey Schau and Pavlina Vechtova. We also acknowledge Roslyn Hickson for facilitating the resources that made the O. gurneyi genome assembly possible. The use of the unpublished genome assemblies in this paper does not constitute their announcement, as details related to preparation, assembly and gene annotation processes have yet to be described.
Author contributions
K.C.D., J.C.F., T.C.G., I.R. conceived the study. K.C.D. validated the study, performed the formal analysis and curated the data. K.C.D. and J.C.F. performed the study investigation. H.S. provided the resources necessary to execute the study. K.C.D. and I.R. wrote the original draft of the manuscript. All authors reviewed and edited the manuscript. K.C.D. and I.R. designed visualizations. T.C.G. and I.R. supervised and administered the study. H.S., T.C.G., I.R. acquired funding for the study.
Financial support
K.C.D. and T.C.G. were supported in part with federal funds from the Centers of Disease Control and Prevention Pathogen Genomics Center of Excellence (Contract No. NU50CK000626). J.C.F. was partially supported by Grant No. DGE-1545433 from the National Science Foundation and the IDEAS programme at the University of Georgia. H.S. was financially supported by the Dutch Ministry of Health, Welfare and Sport (VWS). I.R. is a Howard Hughes Medical Institute Awardee of the Life Sciences Research Foundation.
Competing interests
The authors declare there are no conflicts of interest.
Ethical standards
Not applicable.


 Open access

