1. Introduction
Financial illiteracy is often associated with poor financial outcomes, which has prompted the introduction of financial education programs in several countries.Footnote 1 These programs are aimed at equipping household investors with knowledge related to a basic set of financial notions and protecting them through the implementation of appropriate regulations. However, policymakers need to know how to evaluate the effects of these programs and to understand whether (and how) financial education reduces illiteracy, and accordingly improves financial outcomes.
The literature provides little evidence on the effects of financial education programs. Most available financial education programs are targeted to specific population groups and few are designed to be evaluated. Examples of these programs are financial education for school students (see Bruhn et al., Reference Bruhn, de Souza Leao, Legovini, Marchetti and Zia2016 for Brazil and Romagnoli and Trifilidis Reference Romagnoli and Trifilidis2013 for Italy); financial education in the work place (see Bernheim and Garrett Reference Bernheim and Garrett2003; Clark and d'Ambrosio Reference Clark, D’Ambrosio and Lusardi2008 and Clark et al., Reference Clark, Morrill and Allen2012a, Reference Clark, Morrill and Allen2012b); financial education for financial distressed households (Collins and O'Rourke, Reference Collins and O'Rourke2010).
Becchetti et al. (Reference Becchetti, Caiazza and Coviello2013) and Lührmann et al. (Reference Lührmann, Serra-Garcia and Winter2015) are among the few to use an experimental identification strategy to assess the effect of financial education programs on high-school students. Becchetti et al. (Reference Becchetti, Caiazza and Coviello2013) do not find a statistically significant effect of the treatment on financial literacy but claim a positive effect on hypothetical behaviors. Lührmann et al. (Reference Lührmann, Serra-Garcia and Winter2015) find a positive effect of short training sessions on financial attitudes such as interest in financial matters and saving propensity.
Our paper contributes to the debate by investigating the effect of a small-scale course in basic financial concepts on the financial literacy of university students. To our knowledge, this is the first paper to focus on this particular population within a randomized treatment setting.Footnote 2
University students are a special population but there are several advantages from a focus on them. First, all university students have completed the high-school education, and are equipped with the basic numerical notions needed to understand and make proper use of financial concepts such as interest compounding, inflation and risk diversification. This guarantees that they are fully endowed with the mathematical prerequisites required by standard financial education programs. Second, Italian university students mostly have no or very limited job market experience, and tend to live with their parents and rely on parents’ income to support their studies; some rely on scholarships or grants but the market for loans to students is virtually non-existent. Consequently, Italian university students have very little exposure to the financial notions needed to manage saving or debt, and often lack the basic budgeting notions needed to run a household. These characteristics make exposure to a short course in financial education more likely to have a sizeable impact on their financial skills. Finally, university students are a rather homogeneous population according to certain relevant dimensions such as age and year of birth but also in terms of place of residence, since universities in Italy tend to be local and the geographical mobility of students is limited.
The goal of the paper is twofold. First, we assess whether a short course in financial education has a positive impact on subjective and objective assessments of financial knowledge. Second, we investigate the correlation between changes in subjective and objective assessments in order to evaluate to what extent improvements in self-assessed financial knowledge match actual improvements in familiarity with financial concepts.
To identify the effect of training on financial literacy and investment attitudes, we exploit a standard randomized trial treatment and control group structure on a sample of 579 university students.
We provide two substantive findings. First, the results show a positive effect of financial education on financial literacy. After the course, the treated students appeared more aware of financial concepts, such as interest compounding, inflation and diversification, compared with the control group of students. The second result of the intervention relates to the effect on self-assessed financial literacy. The short course increased the level of self-assessed financial literacy although interestingly this increase is larger than the actual increase in knowledge.
The rest of the paper is organized as follows. Section 2 presents the identification strategy and describes the data; Section 3 presents the results. Section 4 offers some conclusions.
2. Identification of the effects of financial education
2.1 Measuring financial literacy
We asked three questions to assess the financial literacy of participants, three questions to assess their attitudes to investment, and one question to assess how they rated their financial literacy.
To elicit knowledge about basic financial concepts we use the so-called ‘Big Three’ questions. These questions are labeled‘Inflation’, ‘Interest compounding’ and ‘Diversification’ to emphasize the notions they refer to. We use the same wording of the SHIW questionnaire (2006) run by the Bank of Italy. Below, we report the English wording of the questions.
Inflation: Suppose that you leave €1000 to an account that pays an interest rate of 1% per year and has no running costs. Also, assume that inflation is 2% per year. According to you, when in a year you will withdraw your money, you will be able to buy the same amount of goods that you could buy today spending €1000?
1 Yes.
2 No, I will be able to buy a lower amount.
3 No, I will be able to buy a higher amount.
99 I do not know / I do not have elements to answer.
Interest compounding: Suppose you had €1000 in a savings account, without running costs, and the interest rate was 2% per year. According to you, after 2 years, how much do you think you would have in the account if you left the money to grow?
1 Less than €1040.
2 Exactly €1040.
3 More than €1040.
99 I do not know/I do not have elements to answer.
Diversification: Which of the following investment strategies involves a greater risk of losing money?
1 Invest own savings in the securities of one company.
2 Invest own savings in the securities of several companies.
99 I do not know/I do not have elements to answer.
In addition, we use a further set of questions that require participants to elaborate on the topics covered by the course to a deeper extent than the standard ‘Big Three’ questions on financial literacy. This set of questions refers to investment attitudes since they are designed to describe hypothetical situations in which participants are asked to take the correct investment decision building upon a more advanced use of their financial literacy. In the investment attitudes questions participants are asked to calculate the annual return from a risky financial asset net of inflation (‘Real vs. Nominal’), to apply the interest compounding notion in order to compare correctly the returns from alternative investment plans 2 years long (‘Investment plan’) and to assess the doubling time for a loan (‘Rule of 72’). The questions are reported below.
Real vs. Nominal: Which of the two scenarios listed below do you prefer?
1 You are dealing with an inflation rate of 1% per year (which costs 100 today, it will cost 101 in a year) and you are investing all your savings in a financial asset that will give you a yearly return of 6% in 50% of cases and 2% in the other 50% of cases.
2 You are dealing with an inflation rate of 0% per year (which costs 100 today, it will cost 100 in a year) and you are investing all your savings in a financial asset that will give you a yearly return of 5% in 50% of cases and 1% in the other 50% of cases.
3 The two scenarios are equivalent.
99 I do not know / I do not have elements to answer.
Investment plan: Compare the two investment plans for a period of 2 years given below. Which investment plan you prefer?
1 1 Investing €100 at the rate of 5% for the first year and reinvest the entire amount available at the end of the first year at the rate of 6% for the second year.
2 Investing €100 and after 2 years getting €111.
3 I am indifferent between the two investment plans.
99 I do not know / I do not have elements to answer.
Rule of 72: Suppose you owe €1000 on your credit card and the interest rate you are charged is 20% per year compounded annually. If you did not pay anything off, at this interest rate, how many years would it take for the amount you owe to double?
1 2 years.
2 Less than 5 years.
3 Between 5 and 10 years.
4 More than 10 years.
99 I do not know/I do not have elements to answer.
While it is hard to fully remove the effects of ‘teaching to the test’, these two latter sets of questions and the course have been explicitly conceived to attenuate the risk of these effects completely driving participants’ performance. In practice, the questions are designed in a way that the mechanical application of the notions provided by the course is not enough to provide the correct answers to these questions.
The financial literacy self-assessment is measured using a 7-point Likert scale.
Self-Assessed Financial Literacy: Financial Literacy refers to the set of skills required to understand the opportunities offered by financial markets and invest savings in a conscious and informed way. On a scale of 1–7, with 1 being the lowest and 7 the highest level, how would you rate your overall level of financial literacy?
2.2 Experimental design
The participants have to perform three tasks: the answer to a battery of questions, watch a video-course, and answer once more to the same battery of questions. The average time to complete the experiment was 45 min. After the first battery of questions, each participant is randomly assigned to the treatment or to the control course.
The treatment course on basic finance is 20 min long and consists of a male teacher discussing, with the help of numerical examples and graphs, the concepts of patience, interest rate, present and future value of money, inflation, and risk. The concept of patience deals with the comparison between present and future needs and it is introduced by the children story ‘The Cicada and the Ant’. Then, the interest rate is used to measure the reward necessary to compensate an impatient person to postpone current consumption. In order to compare cash flows available at different points in time, the future value of money is discussed and the compounding mechanism is introduced. At this point, the student is able to distinguish exponential growth from the linear growth of the future value of money. Similarly, the teacher treats the present value of the money and the discounting mechanism. The course also explores the role played by the changes in price level on the purchasing power of a consumer through time. The last topic of the course is the concept of risk. Using the story of a farmer who faces uncertain outcomes due to the weather and the crop type, a risk diversification strategy is discussed in order to reduce the exposure to bad outcomes.Footnote 3
The control course is also 20 min long, delivered by a male teacher and deals with the history of the Venetian lagoon. It is arguably orthogonal to the contents of the treatment course given that deals with non-financial issues. The core of the course refers to the changes in the morphological evolution of the lagoon, with a focus on the human facilities (channels, fishing fields, barriers, etc.) that have had an impact on the functioning of the lagoon as an ecosystem.Footnote 4
The treatment and the control course are provided through a series of short videos of 1–2 min length. We decide to split the courses into shorter videos to maximize students’ attention. When the student is ready to start the course, then the first video starts automatically and, only when the short video is over, the button to go on is activated. Once the student presses the button ‘next’, the following video starts automatically, and so on and so forth.
We administered the intervention using the internet platform obtained with LimeSurvey.Footnote 5 On the internet platform, each question appears on a separate page and respondents could only progress if they provided an answer to each question.
The questions posed before and after the treatment were different in order to remove the effect of re-taking a test in a short span of time. However, the answers to the questions are fully comparable and if the question required (simple) numerical calculations we make sure that the before and after the course questions did not include the same calculations.Footnote 6
The subjects received an e-mail directing them to the platform where the survey and course were located. The subjects had 30 days in which to participate in the experiment, which they had to complete in one shot.
To give the students an incentive to participate and to provide the best possible answers, we designed a lottery with a prize of one latest generation laptop computer. Participation in the experiment was not compulsory. We advertised it in the student community using institutional media (university website and newsletters, brochures distributed in public space) and informal networks (direct mailing, Facebook, student radio station) before and during the experiment. For each correct answer, the students received a lottery ticket. They were made aware of the reward by a message that appeared at the top of the screen. Participants did not receive feedback on their performance and were informed about how many lottery tickets they had gained only after data-collection had closed.
2.3 Sample selection
The experimental subjects are students at a medium-sized university in the Northeast of Italy.
The population of interest consists of 24,737 students who enrolled in the academic years 2012–2014, in one of the several BA, MA or PhD courses in the following four areas: foreign languages, humanities, economics, and sciences. The sample was obtained by adding to the students enrolled in the academic year 2013/2014 those who graduated in the academic year 2012/2013. For all the students, we have complete information from the university administrative archives on gender, field of study, and degree (undergraduate and graduate). These students were invited to participate in the experiment: 1,366 students accept the invitation, 279 stop before the course starts. The remaining students were assigned to the treatment and the control group in equal proportion and, of these, 579 listened the course to the end and answered all questions, therefore completing the experiment.Footnote 7
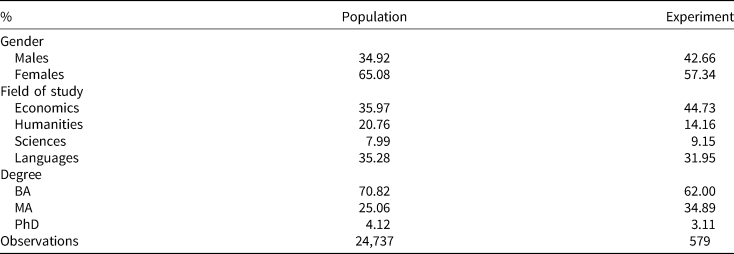
Table 1 shows selected descriptive statistics for the population of interest and for the samples of students who completed the experiment. Females are 65% of the population. Economics is the field of study for 36% of the students, languages for 35%, humanities for 21%, and science for 8%. Most participants were undergraduates (71%), master students accounted for to 25% of the sample, and PhD students to 4%. The sample distributions of gender and education align well with their population counterparts.
Population and sample frequencies

Note: The table reports the distribution of gender, field of study and degree in the population and in the sample of students who completed the experiment.
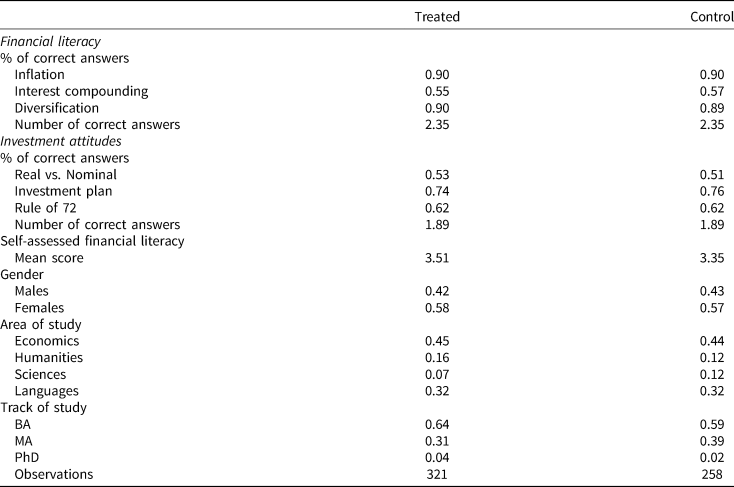
Table 2 provides the sample means of relevant variables for the treatment group (321 students assigned to it) and the control group (258 students) before the intervention. The table shows no substantial differences between the treatment and the control groups in the outcomes before the intervention and provides positive evidence on baseline balance. Furthermore, the table records a generally high level of financial literacy, which is not surprising given that financial literacy is related to literacy and education.
Baseline outcomes and characteristics for treatment and control group

Note: The table reports selected statistics on financial literacy, investment attitudes, and self-assessed financial literacy before the intervention, and the distribution by gender, area, and track of study for the control and the treatment group.
3. Evidence from the experiment
3.1 The effect of financial education on financial literacy and investment attitudes
Our econometric analysis is designed to assess the effect of the short course in financial education on actual financial literacy, investment attitudes, and self-assessed financial literacy. The experimental design of our intervention randomly assigns participants to the treated and the control group. This makes it possible to assess the effect of the short course by comparing the variations in the outcomes of interest before and after the intervention between the treatment and the control groups. For each outcome of interest, we run a standard OLS regression of its variation before and after the intervention on a constant term and a treatment dummy T assigning the value 1 to participants in the treated group and 0 to those in the control group. The coefficient of the treatment dummy is the difference-in-difference estimator of the causal effect of the short course in financial education.
Table 3 shows the results for financial literacy, Table 4 for investment attitudes. Columns 2–4 of Table 3 refer to the ‘Inflation’, the ‘Interest compounding’, and the ‘Diversification’ questions, column 5 refers to the number of correct answers to these questions. Table 4 is similarly constructed, with columns 2–4 referring to ‘Real vs. Nominal’, the ‘Investment plan’, and the ‘Rule of 72;’ questions, and column 5 referring to the number of correct answers.
Financial literacy

Note: The number of observations is 579. The dependent variables in columns 2–4 are changes before and after the course in the 0/1 dummies taking value 1 if the answer to the ‘Inflation’ (column 2), ‘Interest compounding’ (column 3), and ‘Diversification’ (column 4) questions are correct. The dependent variable in column 5 is the number of correct answers. Estimates are obtained using the OLS method. *p < 0.1, **p < 0.05, ***p < 0.01. Robust standard errors in parentheses.
Investment attitudes

Note: The number of observations is 579. The dependent variables in columns 2–4 are changes before and after the course in 0/1 dummies taking value 1 if the answer to the ‘Real vs. Nominal’ (column 2), ‘Investment plan’ (column 3), and ‘Rule of 72’’ (column 4) questions are correct. The dependent variable in column 5 is the number of correct answers. Estimates are obtained using the OLS method. *p < 0.1, **p < 0.05, ***p < 0.01. Robust standard errors in parentheses.
The evidence from Table 3 shows a significant impact of the treatment on the overall number of correct answers. On average, attending the short course increases overall performance in this domain by 0.23. Among those who attended the short course the overall number of correct answers increases by 0.21, while for those assigned to the control group it decreases by 0.02. This variation is not negligible even in qualitative terms since the average number of correct answers in this domain was around 2.3 before the intervention. Then, receiving the short course increases the overall performance by about 10%. The effect is mostly due to increased awareness of the notions of inflation (5%) and interest compounding (18%), while the effect on diversification is negligible.
Turning to the results for investment attitudes, Table 4 shows that the number of correct answers increases by 0.23, mostly due to the effect on the ‘Investment plan’ and the ‘Rule of 72’ questions, both of which require the students to make use of the notion of interest compounding.Footnote 8 Again, the effect is sizeable since it amounts to about 12% of average pre-intervention levels.Footnote 9
Finally, we compute the difference in the degree of self-assessed financial literacy before and after the intervention. The treatment causes the score to increase by 0.761 (standard error 0.080), an effect that is both statistically and economically significant. Since the before intervention average score is 3.44, this means that the intervention increases the score for self-assessed knowledge by more than 20%.Footnote 10
To investigate the potential heterogeneity of treatment effects, in the regression presented above, we interact the T variable with gender, field of study and degree dummies. The results, not reported for brevity, point to not statistically significant differences of treatment effects among genders, fields of study and degrees.Footnote 11
3.2 Actual versus self-assessed knowledge
Our findings highlight a positive and significant effect of our treatment on both the objective and self-assessed skills of participants.
A natural question is whether increases in skills confidence are accompanied by increases in actual skills.
To address this issue, we assess the correlation between the variations in students’ actual financial skills and variations in their self-confidence levels. In addition, we investigate the relation between investment attitudes and self-assessed financial literacy.
Table 5 shows the joint distribution of changes in actual and self-assessed financial literacy, the former measured as the number of correct answers to the financial literacy question.
Joint distribution of actual and self-assessed financial literacy

Note: The number of observations is 579. The table shows the estimate of the joint distribution of changes in actual and self-assessed financial literacy.
Column 2 of Table 5 indicates that 7.6% is the relative frequency of participants whose self-rated financial knowledge has decreased after the intervention. This percentage can be broken down in 1.9% of participants whose knowledge is also decreased, 4.15% of participants whose knowledge has not changed and 1.55% of participants whose knowledge has increased. The other columns can be similarly interpreted. The degree of correlation between changes in actual and self-assessed knowledge is, therefore, larger the closer to 100 are the numbers on the main diagonal.
About 50% of students lie on the main diagonal. This means that variations in actual skills and variations in self-assessed skills are broadly consistent for half of the sample. However, for about 30% of the sample, the improvement in self-assessed financial literacy is not matched by an improvement in actual financial literacy since it remains constant or even deteriorates. Therefore, Table 5 points to the limited correlation between actual and self-assessed knowledge. The latter increases in 41% of cases but actual knowledge increases in only just below 11% of cases and in 27% of cases is unchanged after the intervention.
Table 6 investigates the correlation between changes in investment attitudes and changes in self-assessed financial literacy. The pattern of results is similar to that in Table 5. The correlation between investment attitudes and self-assessed financial literacy is positive but well below 1. Investment attitudes improve for less than 1/3 of those whose self-assessed financial literacy increases.
Joint distribution of investment attitudes and self-assessed financial literacy

Note: The number of observations is 579. The table shows the estimate of the joint distribution of changes in investment attitudes and self-assessed financial literacy.
4. Conclusions
There is a large and growing literature showing that sizeable fractions of the population lack the basic skills to make sound financial decisions. The evidence has prompted a number of financial education initiatives around the world. These initiatives often take the form of education programs but rarely are designed to be evaluated.
The primary question is whether financial education is effective for enhancing the level of financial literacy. Using an evaluation design, our experiment studied the effect of financial education on financial literacy and how individuals perceive their level of financial literacy.
Our evidence shows a non-negligible effect on financial literacy but an even larger effect on the level of self-assessed financial literacy in a population of university students. We also find broadly consistent changes in financial literacy and self-assessed financial literacy after the course. However, our evidence also suggests that for a fraction of students increase in self-assessed financial literacy are not fully matched by an increase in financial literacy, a potential issue deserving further attention in future work.
Author ORCIDs
Yuri Pettinicchi 0000-0003-0837-8449
Acknowledgements
We are grateful to the Italian Ministry of Education, University and Research under the FIRB project on “The Economic Effects of Demographic Aging” and under the PRIN - Italian Ministry MIUR project “2010T8XAXB - The economic consequences of population ageing in Europe 2013–2016”, and to Research Center CINTIA for financial support for this work. Yuri Pettinicchi gratefully acknowledges research support from the 7.FP, COFUND, Goethe International Postdoc Programme GO-IN, No. 291776. We thank Michele Bernasconi, Massimo Warglien, Giulia Previati, and Juliana Bernhofer. We also thank the participants at the workshop The Policy Implications of Demographic Ageing (2014), CINTIA Second Conference (2014), Netspar International Pension Workshop (2015), ESPE Annual Conference (2015) and First Ca' Foscari - University of Groningen PhD Workshop in Economics (2015). Errors are our own and any opinion expressed here belongs to authors and does not reflect COVIP views.