I. INTRODUCTION
Due to the nonequilibrium nature of physical vapor deposition (PVD) methods, resulting film properties are generally highly dependent on preparation parameters. Understanding the basic mechanisms governing the evolution of microstructure is essential to controlling film properties as the physical structure of a film is often directly related to its performance. Despite the importance of film microstructure, there is only a qualitative or semiquantitative understanding of the various physical structures that can be obtained and their origins. A great deal of phenomenological information is available on the relationships between deposition conditions and microstructure in inorganic films, which can be summarized in structure zone models (SZMs) that describe the evolution of film morphology under various deposition conditions.Reference Movchan and Demchishin1–Reference Messier, Giri and Roy3 Although fewer data exist on the relationships between deposition conditions and morphology in vapor-deposited organic films, previous studies have shown that varying parameters such as the substrate material,Reference Kafer and Witte4–Reference Schreiber6 temperature,Reference Kafer and Witte4–Reference Vasseur, Rolin, Vandezande, Temst, Froyen and Heremans12 or deposition rateReference Fenter, Schreiber, Zhou, Eisenberger and Forrest9, Reference Yang, Shtein and Forrest10, Reference Vasseur, Rolin, Vandezande, Temst, Froyen and Heremans12, Reference Zhang and Weeks13 can have significant effects on the resultant microstructure. These studies have all been limited to very thin films (∼1 μm or less) and efforts to categorize organic film morphologies produced under specified deposition conditions for a broad range of materials have been limited. However, a number of situations exist in which thicker organic films are required, and it is often advantageous to retain the morphological control offered by PVD, such as in the case of explosive materials.
Explosive materials have a very high energy density, but they require a certain material-dependent minimum thickness to detonate in a reproducible fashion. Microstructure has been shown to have a significant impact on the properties of explosive materials; differences in density, grain size, or pore size and distribution can lead to large changes in ignition sensitivity, detonation velocity, critical diameter, and other behaviors.Reference Eyring, Powell, Duffy and Parlin14–Reference Sheffield, Engelke and Horie21 However, traditional methods for processing explosive materials, such as compacting powders in molds, do not allow for precise control over microstructure, and significant local variations are common, often resulting in poor reproducibility, especially at sub-millimeter scales. PVD alleviates these concerns in a less time-consuming and labor-intensive manner and can also easily accommodate complex geometries that would be extremely difficult to fabricate using pressed powders.
In this article, we use pentaerythritol tetranitrate (PETN) to demonstrate a range of microstructures that can be fabricated in a molecular crystal material using PVD. PETN is used since its high vapor pressure at moderate temperaturesReference Dobratz and Crawford17 makes it easy to deposit, and its small critical diameterReference Campbell and Engelke22 (detonation has been observed in vapor-deposited films as thin as 130 μm)Reference Wang, Jiao, Li, Wang, Huang and Li23, Reference Tappan, Knepper, Wixom, Miller, Marquez and Ball24 allows it to be detonated in the small geometries inherent to the PVD process. Films are deposited to thicknesses ranging from 5–500 μm using several different substrate materials to investigate the effects of the substrate/film interface on the evolution of microstructure with film thickness. Film microstructure is examined by imaging surface and cross-section morphologies using scanning electron microscopy (SEM) and examining crystallographic texture using x-ray diffraction. Stylus profilometry is used to quantify film thickness, surface roughness, and measure volumes to ascertain average densities.
Vapor deposition of PETN films allows for precise control over film microstructure, and consequently, the properties of an explosive material at the mesoscale. This work presents an opportunity to not only investigate the effects of microstructure on explosive properties with exceptional detail but also optimize the microstructure of an energetic material to meet specific requirements. In addition, the small-scale samples of explosive materials generated using these techniques can allow unique experimental opportunities, such as studies of detonation behavior near the critical thickness for detonation in materials that detonate in sub-mm geometriesReference Tappan, Knepper, Wixom, Miller, Marquez and Ball24 or generating unreacted shock Hugoniot dataReference Bolme, McGrane, Moore and Funk25, Reference Armstrong, Crowhurst, Bastea and Zaug26 at pressures greater than the detonation pressure in these materials.Reference Armstrong, Crowhurst, Bastea and Zaug26
II. EXPERIMENTAL
A. Film deposition
PETN films were deposited in a custom designed high-vacuum deposition system. Between 25 and 450 mg of PETN powder was loaded into an effusion cell thermal deposition source, and the chamber evacuated to a base pressure of ∼10−6 Torr. The effusion cell was heated to a maximum temperature of ∼135 °C, at which point the PETN completely sublimed or evaporated over a period of ∼30 min. Film thickness was controlled by the amount of material placed in the effusion cell; the thickest films (480 μm) required four depositions to uniformly coat the desired area.
Substrates consisted of 1 cm squares of either fused silica or (100) oriented single crystal silicon (with its native oxide), which were held in a 3 × 3 array, 10 mm above the top of the effusion cell. The middle location in the array was left empty and the effusion cell offset from center while the substrates were rotated at 25 rpm during deposition to produce a uniform film thickness within ± 5%. Shadow masks were used such that uncoated 1- to 2-mm-wide regions around the edges of the substrate could be used as a reference for accurate film thickness measurements. A 300-nm aluminum film was deposited on some substrates prior to coating with PETN (without breaking vacuum) by DC magnetron sputtering from a 2 inch target at 185 W in 10 mTorr of argon with a source-to-substrate distance of 85 mm. Prior to depositing aluminum layers, the chamber was evacuated to a lower base pressure (∼10−7 Torr) to minimize oxidation of the Al surface.Reference Do, Splinter, Chen and McIntyre27
Substrates were held on a water-cooled copper block to reduce heating during deposition. Silicon substrates were coupled to the block with silver-filled vacuum grease to improve heat transfer, whereas fused silica substrates were only held against the block by the shadow mask. Although it was not possible to measure substrate temperatures during deposition with the current setup, it was expected that the fused silica substrates would reach a somewhat higher temperature than the silicon substrates because of the differences in heat transfer rates to the cooling block.
B. Characterization
Distributions of film thickness were determined using a Dektak 8 surface profiler with a 5 μm stylus and 15 μN applied force. Three-dimensional maps of each sample were collected by performing a series of scans with a 40-μm spacing between scan lines. This provided data on film thickness distribution, surface roughness, and film volume. Average densities were calculated by dividing the film mass by the volume. Film mass was determined by measuring the mass of the substrate and PETN film, removing the film with an acetone rinse, and subtracting the mass of the substrate alone.
Film microstructure was characterized using SEM and atomic force microscopy (AFM). SEM was used to image the morphologies of both the top surfaces and fracture cross-sections using a Zeiss Supra 35VP SEM (Zeiss, Peabody, MA) operating at 1 kV. Films were cross-sectioned by scoring bare regions of the substrate following deposition and propagating fracture through the film. All surfaces were coated with a thin layer of iridium prior to imaging to mitigate surface charging. The surface morphology of the thinnest films (∼6 μm) was also examined using an Agilent 5500 AFM (Agilent, Santa Clara, CA) as surface roughnesses of these films tended to be too small to measure accurately using stylus profilometry. Several 20 × 20 μm areas of a PETN film on each type of substrate were scanned using intermittent contact mode to determine surface roughness and provide a detailed look at the local surface morphology in the early stages of film growth.
Crystal structure verification and grain orientation were examined in some films using x-ray diffraction. A Bruker D8 diffractometer (Bruker, Madison, WI) equipped with a General Area Detector Diffraction System was used for these measurements. This system used a copper x-ray source (k-α wavelength of 1.54059 Å) operated at 40 kV and 40 mA with a 0.5 mm spot size for these measurements. Three-dimensional scattering intensity data were collected where the coordinate system can be defined as a cylindrical volume in which ϕ and χ angular positions define the intensity distribution for a fixed 2q value (in essence, the pole figure for that 2q). Stacking these pole figures sequentially with increasing 2q angle generates the third dimension (2q) and reveals how the sample diffracts in essentially all orientations over the established limits of the measurement. These limits were ϕ = 0.6–354°, χ = 0.6–78°, and 2q = 15–80° to generate the data cylinder. Note that the steps for ϕ and χ were both 6°, whereas the 2q steps were much smaller at 0.1°. The completeness of this texture analysis was useful in determining subtle texture variations in these samples.
III. MICROSTRUCTURE ANALYSIS
A. Results
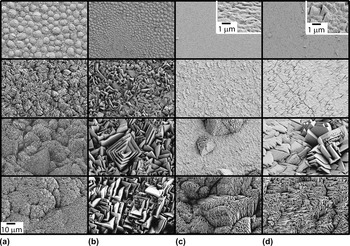
SEM images of the top surfaces of PETN films deposited on silicon and fused silica with and without a 300-nm layer of sputtered aluminum on the substrate are shown in Fig. 1. These substrate conditions will be referred to as Si, FS, Si/Al, and FS/Al. The series of images shows the evolution of surface morphology with increasing film thickness from ∼6 to 480 μm, with 35 and 110 μm intermediate thicknesses. All images are shown at the same magnification with the exception of the insets in the 6-μm films on Si/Al and FS/Al, which are magnified by an additional 10× so that the microstructural details are visible.
Representative scanning electron microscopy (SEM) images depicting the evolution of surface morphology with film thickness of pentaerythritol tetranitrate (PETN) films on (a) silicon, (b) fused silica, (c) silicon with a 300-nm aluminum layer, and (d) fused silica with a 300-nm aluminum layer. Images show the top surfaces of films with approximate thicknesses of (from top to bottom) 6, 35, 110, and 480 μm. The scale bar in the lower left corner applies to all images except the insets.

In the early stages of growth, films deposited on Si form dome-shaped surface features that are roughly 10 μm across and appear to be composed of micron-sized platelets. As the films grow to 35 μm, these platelets become more pronounced and cluster together into groups with a similar orientation to form the dominant surface features. With continued growth, the platelets remain roughly the same size, but the clusters grow larger as film thickness increases.
PETN films deposited on FS initially show a microstructure similar to that of films on Si, but with somewhat smaller domes in a wider range of sizes. However, as film thickness increases, the microstructure evolves very differently. Large, faceted platelets form and grow larger with increasing film thickness. Thicker films often include platelets with sharp, angled facets that grow in nested sets or square pyramidal structures. This morphology is similar to that reported by Wixom et al.Reference Wixom, Tappan, Long, Renlund, Welle, McDonald, Jared, Brundage and Michael28 for PETN films deposited on fused silica using a thermal planar deposition source. The surface morphology looks similar for the 110- and 480-μm-thick films, with the characteristic feature size and shape remaining roughly the same. Note that the slightly wavy appearance of some of the features in the 480-μm-thick film is the result of difficulties in imaging due to charging effects.
When a thin layer of aluminum is placed on the substrate just prior to depositing the PETN film, the microstructure changes dramatically. The thinnest films show a very smooth surface with no features larger than about 1 μm. As the films grow thicker, it appears that the surface is composed of small platelets lying nearly parallel to the substrate. Although these platelets grow larger with increasing thickness on FS/Al, little platelet growth is evident on Si/Al. Many films deposited on aluminum also have a network of narrow cracks. On both Si/Al and FS/Al, much of the surface remains smooth in the 35-μm films; however, distinct “defect regions” appear in both the 35- and 110-μm films that protrude from the surface and have a morphology that resembles that of films deposited on Si or FS without the aluminum layer. In the 480-μm films, the “defect” structure dominates, completely replacing the smooth surface. The morphology of these thick films on Si/Al looks very much like that of films on Si, with approximately micron-sized platelets clustered into larger features. Thick films deposited on FS/Al have similar clusters of small platelets but tend to have more features in common with films on FS, such as faceted grains in nested sets.
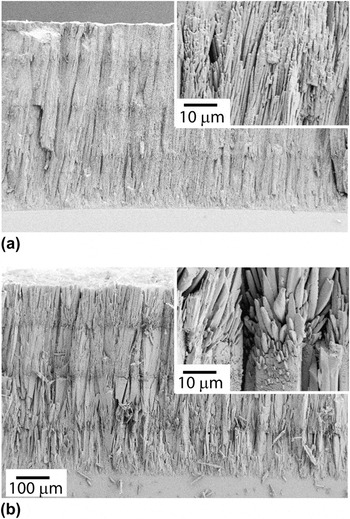
SEM images of the fracture cross-sections of PETN films deposited on Si (top) and FS (bottom) are shown in Fig. 2. Films deposited on Si/Al and FS/Al did not fracture as cleanly and are not shown. Most striking are the differences in morphology evolution with thickness, with films on FS characterized by expanding plate-like columns that can grow as large as 20 μm across, whereas films on Si have a fibrous grain structure with narrow columns that remain at a fairly constant width of about 1 μm. In addition, it is clear that there are large differences in the distribution of pore sizes in the two films, with films on Si substrates having many small pores, whereas films on FS appear to have fewer larger pores. Films on either substrate show horizontal “stripes,” variations in contrast that are indicative of the breaks between depositions (it required four depositions for these films to reach their final thickness). The insets show areas around one of these interfaces in each film. The PETN columns clearly renucleate at the start of each new deposition in films on FS substrates, and this may be occurring to a lesser extent in films on Si substrates as well. Although a ragged fracture surface of the PETN films deposited on Si/Al and FS/Al obscured many of the details of morphology evolution, the presence or absence of an aluminum layer did not seem to have a major effect on cross-section morphology beyond the initial stages of growth. Films deposited on Si and Si/Al had a qualitatively similar morphology, with narrow fibrous columns, as did films deposited on FS and FS/Al, which were characterized by expanding columns and significant renucleation between depositions. Future work will involve ion polishing of the cross-sections and quantitative analysis of the porosity distribution, similar to that performed by Wixom et al.Reference Wixom, Tappan, Brundage, Knepper, Ritchey, Michael and Rye29
Representative SEM images of fracture cross-sections of 480-μm PETN films grown on (a) silicon and (b) fused silica substrates. Insets show the morphology at an interface between depositions at higher magnification.

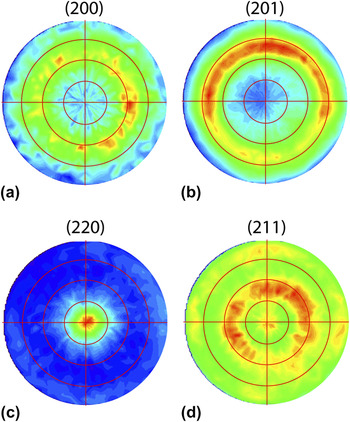
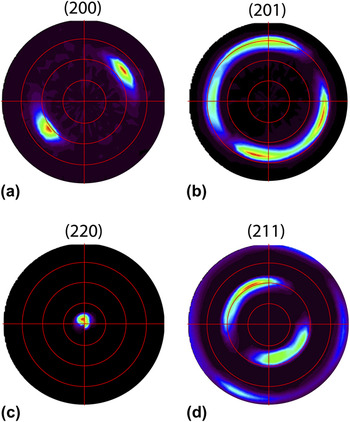
It appears that the substrate has a significant effect on crystal orientation as well. A detailed x-ray analysis was performed on a 35-μm PETN film deposited on FS and on FS/Al. Pole figures from the (200), (201), (220), and (211) hkl reflections for each sample are shown in Figs. 3 and 4. The film deposited on FS shows a preferred (110) out-of-plane texture, but with a substantial random component and no significant preferred in-plane orientation, as demonstrated by the nearly continuous ϕ rings at specific χ angles that are consistent with a fiber texture. When a thin aluminum layer is deposited immediately prior to the PETN, the PETN film becomes much more strongly oriented. The film on FS/Al is highly textured, with a strong out-of-plane orientation and a preferred in-plane orientation. Note that the out-of-plane texture appears to be offset from (110) by about 5°. This is consistent with SEM and AFM images of the surface of thin PETN films on FS/Al, which appear to be made of slightly tilted plates that are likely to be the (110) planes. Limited data from similar films on Si and Si/Al suggest texturing similar to films on FS and FS/Al, respectively.
(a) (200), (b) (201), (c) (220), and (d) (211) pole figures showing the distribution of crystal orientations for a 35-μm PETN film deposited on fused silica. The red lines indicate 20° increments in χ. The film has a weak (110) out-of-plane texture and a random in-plane orientation.

(a) (200), (b) (201), (c) (220), and (d) (211) pole figures showing the distribution of crystal orientations for a 35-μm PETN film deposited on fused silica with a 300-nm layer of aluminum. The red lines indicate 20° increments in χ. The film has a very strong out-of-plane orientation slightly offset from (110) and also shows some in-plane texturing.

B. Discussion
The growth evolution of films deposited on FS and Si substrates suggests a significantly different behavior of substrate temperature during deposition. The expansion of columns in films deposited on FS during a single deposition followed by renucleation of smaller columns at the start of each new deposition suggests that the substrate temperature increases significantly during the course of a single deposition. In contrast, column size stays nearly constant in films deposited on Si and renucleation with each new deposition is less evident. This suggests that the Si substrates remain at a low temperature during deposition, whereas the temperature of the FS substrates increases significantly during deposition. This can be explained by differences in heat conduction from the substrates to the cooling block on which they were mounted. Although Si substrates had a good conduction path because of their high thermal conductivity and the use of silver-filled vacuum grease to improve coupling with the cooling block, the FS substrates have a much lower thermal conductivity and were mounted without the silver-filled grease. The differences in morphology evolution also provide compelling evidence that substrate temperature has a substantial impact on film microstructure. Future work will involve direct control of substrate temperature to more directly ascertain its effects on film morphology.
The 6-μm films most clearly demonstrate the effects of having a layer of aluminum between the substrate and film. The domed structure seen in PETN deposited on either silicon (with its native oxide) or fused silica substrates is indicative of the formation and coalescence of islands during the early stages of growthReference Wixom, Tappan, Long, Renlund, Welle, McDonald, Jared, Brundage and Michael28 and a high interface energy between the PETN and substrate.Reference Nix and Clemens30 The smooth surface of films grown on the sputtered aluminum layer suggests that PETN has a significantly lower interface energy with aluminum than with SiO2. Note that the dome-like microstructure observed in our 6-μm-thick films on Si substrates appears similar to that reported by Zhang et al.Reference Zhang, Weeks, Gee and Maiti31 for 500 nm and thinner PETN films on Si; however, while their films showed a smooth, amorphous-like surface morphology, our films are clearly polycrystalline.
A (110) orientation is likely preferred due to a low surface energy as it is the most closely packed plane in the PETN crystal structure. In addition, it is probable that the bare (not oxidized) Al surface further promotes a (110) orientation due to the high density of oxygen on the (110) plane of PETN and aluminum’s affinity for oxygen. Note that the texturing is not likely to be caused by any heteroepitaxial effects as the grain size in the aluminum film (tens of nm) is more than an order of magnitude smaller than that of the PETN. This suggests that other materials that are prone to oxidation, when deposited onto a substrate prior to a PETN film (without breaking vacuum so as to ensure a pristine surface), should also promote a strong (110) texture. Note that the apparent in-plane preferred orientation of the films deposited on Al is an unexpected result. However, we do not think this is an artifact of the measurement technique as the spot size (0.5 mm) should be sufficiently large to sample a large number of grains. Further study will be required to determine if the in-plane texture is of a local or global nature.
Although it is unclear exactly what causes the smooth surface of films deposited on aluminum to be so abruptly replaced with the “defect” structure, there are several possible explanations. Many of the 35- and 110-μm films deposited on aluminum have a network of narrow cracks, presumably caused by a high residual stress in the film. If these cracks form during deposition, it would create local defects on which a different morphology might grow. Alternatively, occasional spitting has been observed from the deposition source, which can result in small particles being emitted and may create another source of defects in the film. In either case, additional PETN would be deposited on the defect and could nucleate a lower density morphology that would grow faster than the surrounding smooth areas due to its low density. It is possible that such defects could be reduced or eliminated by changing the deposition conditions (such as deposition rate or substrate temperature), making it possible to obtain thicker films with a uniform, smooth morphology.
Note that the growth evolution of vapor-deposited PETN is, in general, quite different than what has been observed in high-rate thick film growth for many other materials. Although little work has been done previously on the morphology evolution of thick vapor-deposited organic films, there has been extensive characterization of the evolution of thick inorganic films. Characteristic morphologies that occur for various growth conditions in inorganic films have been organized into SZMsReference Movchan and Demchishin1–Reference Messier, Giri and Roy3 that relate microstructure to deposition conditions such as substrate temperature (normalized by the melting temperature of the film, T m). These SZMs show that for low substrate temperatures (Zone 1: T < 0.3 T m), films tend to be amorphous or nanocrystalline, and morphology is dominated by shadowing effects, resulting in a rough, porous film. For intermediate temperatures (Zone 2: 0.3 T m < T < 0.5 T m), surface diffusion of depositing adatoms controls the growth process, and films generally grow in columnar, crystalline grains with faceted surfaces. These columns tend to increase in size as temperature increases. At higher temperatures (Zone 3: T > 0.5 T m), bulk diffusion dominates, and films tend to be composed of large equiaxed grains and have a smooth surface. For PETN film growth, despite the substrate temperature being greater than 0.7 T m (room temperature is roughly 0.72 T m for PETN), the microstructure has a mixture of features akin to Zone 1 and Zone 2, with a porous structure similar to Zone 1, but including faceted crystals like those seen in Zone 2 microstructures. It is clear that traditional SZMs do not accurately characterize the growth of PETN, and while data are limited, it is likely that trends in the microstructure evolution of other vapor-deposited organic materials will be outside the bounds of traditional SZMs as well. SchreiberReference Schreiber6 provides a thorough description of issues specific to the growth of organic films, but as of yet, it is unclear whether various organic molecular crystal materials have growth evolution processes and characteristic microstructures that could be captured by a new SZM, and a great deal of additional characterization would be required to assess the feasibility of such an endeavor.
IV. MESOSTRUCTURE ANALYSIS
Although the previous section focused on analysis of microscale features in vapor-deposited PETN, the evolution of film microstructure can also have a significant impact on larger scale structural features. The following section details how the microstructure evolution discussed above affects mesoscale characteristics such as surface roughness, average density, and millimeter-scale morphology.
A. Results
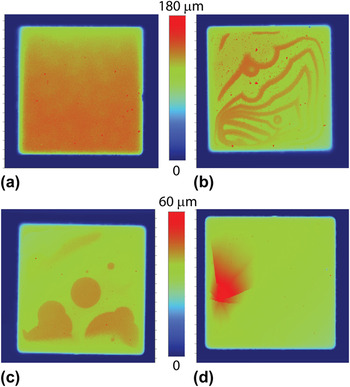
Many PETN films deposited on aluminum have millimeter-scale surface features not seen in films deposited on bare Si or FS. Surface profiles of 35- and 110-μm films on Si/Al and FS/Al often show large areas that abruptly protrude from the surface, as shown in Figs. 5(b)–(d). Figure 5(a) shows a representative surface profile of a film deposited on a bare FS substrate for comparison. In these images, the dark blue perimeter region is the substrate, which corresponds to a height of zero. The green, orange, and red areas indicate height above the substrate surface according to the scale next to each image. The morphologies shown are typical of the substrate and film thickness conditions shown, with 35-μm films on Si/Al often having circular or semicircular features several millimeters in diameter, 110-μm films on Si/Al showing a series of ridges, and 35-μm films on FS/Al showing distinct patterns of cracking. In 110-μm films on FS/Al, such distinctive features were rare. In the 6-μm films on either Si/Al or FS/Al, only occasional cracking was observed, whereas in the 480-μm films, no distinctive features were observed at all, possibly due to the large surface roughness. Films of all thicknesses deposited on bare Si or FS look similar to Fig. 5(a).
Surface profiles of (a) a 110-μm PETN film on FS, (b) a 110-μm PETN film on Si/Al, (c) a 35-μm PETN film on Si/Al, and (d) a 35-μm PETN film on FS/Al. Films deposited on aluminum often have mm-scale defects that may be associated with mechanical failure due to high stresses.

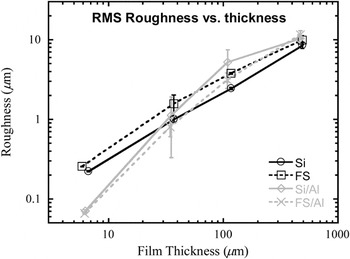
Root mean square surface roughness values were determined from these surface profiles and are plotted in Fig. 6 as a function of film thickness on a log-log scale. Note that roughness values for all of the 6-μm films were also independently obtained using AFM. Roughnesses were determined from the surface profiles by averaging over large areas (at least several millimeters/side) of several films to capture the full range of surface structures. For films deposited on bare Si or FS, the roughness increases with film thickness in a linear fashion on a log-log scale, increasing from ∼200 nm for the 6-μm films to ∼10 μm for the 480-μm films. This linear trend on a log-log scale is indicative of power law roughness evolution, with a growth exponent from 0.83–0.85 for PETN films grown under these conditions. Films deposited on FS/Al and Si/Al have a different behavior, starting with much lower roughnesses for the thinnest films (∼70 nm) and displaying a nonlinear increase in roughness with film thickness.
Log-log plot of surface roughness versus film thickness for PETN films. Data are shown for films deposited on silicon and fused silica substrates with and without a 300-nm layer of aluminum on the substrate.

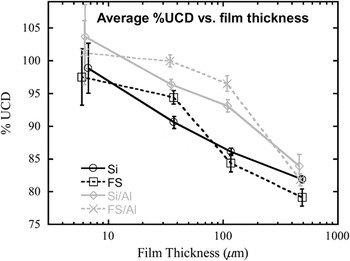
Figure 7 shows the evolution of film density with thickness for all four substrate conditions. The measured density is an average over the entire film volume and is plotted as a percentage of the unstrained crystal density (% UCD), which is equivalent to that of a single crystal material at zero stress conditions. Regardless of the substrate, density decreases monotonically with increasing film thickness. While all of the thinnest films are very dense (near 100% UCD), the density drops to 79−84% UCD in the 480-μm films. Also, films deposited on a thin aluminum layer have significantly higher densities than the corresponding films on bare Si or FS at all thicknesses.
Plot of average PETN density (as a percentage of the unstrained crystal density) versus film thickness. Data are shown for films deposited on silicon and fused silica substrates with and without a 300-nm layer of aluminum on the substrate. Note that film thickness is displayed on a log scale.

B. Discussion
The raised features in the films deposited on Si/Al appear to be consistent with blistering and/or buckling, failure mechanisms associated with high levels of compressive stress. The cracking patterns seen in the films on FS/Al appear to be consistent with failure from buckling with cracking as described by Thouless.Reference Thouless32 These mechanical failures strongly suggest the presence of high levels of compressive stress in PETN films deposited on a sputtered aluminum layer. In addition, the elevated regions of the films also appear to have a higher surface roughness and may be related to the “defect” structures shown in the SEM images of the 110-μm PETN film on Si/Al and FS/Al in Figs. 1(c) and 1(d).
This same transition in morphology from a smooth surface to the “defect” morphology is the likely cause for the nonlinearity in roughness evolution seen for films deposited on Si/Al and FS/Al. This is evidenced by the large error bars for films on Si/Al substrates at intermediate thicknesses that reflects the difference between local roughness in the smooth, plate-like regions and the large global roughness due to the variation in local film height between the smooth regions and the “defect” regions (see Fig. 5), where the film may have undergone compressive failure. A similar dichotomy appears in the films on FS/Al but the differences in roughness tend to be less drastic. Regardless, such an extreme change in characteristic morphology is likely to change how roughness scales with film thickness, such that a single exponent does not accurately represent the evolution of surface roughness in the films deposited on aluminum.
Note that for films where the roughness exponent was constant, the magnitude was somewhat larger than that found by Zhang et al.Reference Zhang, Weeks and Holtz33 for submicron PETN films deposited on a hydrophilic self-assembled monolayer. This difference in growth exponent is not surprising due to the different substrate surfaces and the vastly different thickness ranges used in the two studies. The growth exponents found in this work are also in the range commonly seen in other organic thin filmsReference Durr, Schreiber, Ritley, Kruppa, Krug, Dosch and Struth34–Reference Zhang, Barrena, Goswami, de Oteyza, Weis and Dosch36 and are characteristic of “rapid roughening” that is believed to be dominated by self-shadowing effects.
The decrease in average film density with increasing film thickness may be related to the trends in surface roughness. If we assume low mobility conditions during deposition, as seems likely from the observed morphologies, an increase in local (microscale) surface roughness will lead to increased self-shadowing during deposition. Greater self-shadowing, in turn, promotes a more porous and lower density film. This mechanism would also be consistent with the observed higher density for films deposited on Al as the lower local surface roughness of those films would limit the self-shadowing and thus, the porosity. In addition, films on both Si/Al and FS/Al stay relatively dense while the smooth, plate-like morphology dominates, but show a rapid drop in density when the defect structure takes over, causing the local surface roughness to increase to levels similar to those of films on bare Si or FS.
Note that while densities greater than the unstrained crystal density are measured for the 6-μm films on Si/Al and FS/Al, the uncertainty in the measurement is large enough that the range includes values below 100% UCD. The large uncertainty in the density of the 6-μm films is primarily due to the uncertainty in the volume measurement, which increases significantly at small film thicknesses. However, note that it is possible for the density of thin PETN films to exceed the UCD. If a polycrystalline film has a large enough compressive residual stress, its density may exceed the density of an unstrained single crystal. Assuming the PETN film is a polycrystalline aggregate with random crystal orientation, the average elastic constants can be estimated from either a Voigt or Reuss average for a tetragonal polycrystalline material,Reference Chinh37 which can be calculated from the single crystal elastic constants.Reference Winey and Gupta38 Using these data, along with Hooke’s Law for a material under biaxial compression in plane stress conditions (as is typical for thin films), it can be shown that for every 100 MPa in compression, the density can exceed 100% UCD by ∼0.7%. Thus, a stress of 500 MPa in compression would be necessary to reach the nominal density measured for 6-μm thick PETN on Si/Al. Although there is some evidence for compressive stress in films deposited on either Si/Al or FS/Al (as discussed above), the stresses have not been measured directly at this time.
A particularly interesting result is that the variation in density with substrate material appears greatest for the 110-μm films, where PETN density increases from ∼85% UCD for films deposited on bare silicon or fused silica to ∼95% or higher when an aluminum layer is present. This film thickness is in the vicinity of the minimum necessary for a detonation to propagate in a PETN film.Reference Tappan, Knepper, Wixom, Miller, Marquez and Ball24 This introduces the possibility of using interface conditions to control microstructure and thus, properties such as detonation velocity, sensitivity, or output energy on a local scale. Also note that in the 480-μm films, the films on Si and on FS/Al have approximately the same density, but have very different morphologies. These films may present an opportunity to study the effects of pore size on explosive properties such as initiation threshold.
V. CONCLUSIONS
This work provides compelling evidence that the microstructure of vapor-deposited PETN films can be controlled by varying the deposition conditions, particularly the film/substrate interface and the substrate temperature. Significant variations in density, surface roughness, pore size and distribution, characteristic morphology, and crystal orientation were observed in films deposited on various substrates. Of note, films with a thickness near the critical value for detonation propagation in PETN had densities varying from less than 85% UCD to greater than 95% UCD depending on the substrate. The control over film morphology demonstrated in this work will allow for quantification of the impact of film morphology on explosive properties, such as ignition sensitivity and detonation velocity, in an effort to construct meaningful preparation-structure-property relationships for vapor-deposited explosive materials.
ACKNOWLEDGMENTS
The authors thank Michael P. Marquez and M. Barry Ritchey for their assistance with sample preparation and SEM imaging. Sandia National Laboratories is a multiprogram laboratory operated by Sandia Corporation, a wholly owned subsidiary of Lockheed Martin Company, for the United States Department of Energy’s National Nuclear Security Administration under contract DE-AC04-94AL85000. Sandia’s Laboratory Directed Research and Development Program and the Joint Department of Defense/Department of Energy Munitions Technology Development Program supported this work.