I. INTRODUCTION
The combinatorial approach in materials science,Reference Koinuma and Takeuchi1, Reference Potyrailo, Rajan, Stoewe, Takeuchi, Chisholm and Lam2 in which a large compositional landscape is rapidly mapped and screened for desired physical properties, is an effective way to accelerate the traditional time-consuming and serendipitous trial-and-error processes that we rely on for discovering and developing novel high-performance materials. Owing to recent developments in atomic-scale thin-film fabrication and characterization techniques for inorganic materials, various types of sophisticated combinatorial library designs such as the continuous composition gradients are available not only for identifying materials with desired properties but also for systematically tracking the details of the structure–property relationships of targeted materials.Reference Fukumura, Ohtani, Kawasaki, Okimoto, Kageyama, Koida, Hasegawa, Tokura and Koinuma3−Reference Aimon, Kim, Choi and Ross6
It has been widely accepted that materials at boundaries where different structural phases with very similar energy levels coexist can display a colossal susceptibility response in reaction to weak external stimuli such as temperature, electric field, or magnetic field. Indeed, giant piezoelectric responses are achieved in some ferroelectrics at their morphotropic phase boundaries (MPBs).Reference Park and Shrout7–Reference Bellaiche, García and Vanderbilt11 While such boundaries are often identified by compositional tuning of the materials, experimental processes for the identification of structural boundaries can require synthesis and characterizations of an enormously large number of individual samples. To overcome this challenge, we have implemented the combinatorial approach, which allows rapid identification of structural boundaries.Reference Hunter, Osborn, Wang, Kazantseva, Hattrick-Simpers, Suchoski, Takahashi, Young, Mehta, Bendersky, Lofland, Wuttig and Takeuchi5, Reference Takeuchi, Famodu, Read, Aronova, Chang, Craciunescu, Lofland, Wuttig, Wellstood, Knauss and Orozco12, Reference Cui, Chu, Famodu, Furuya, Hattrick-Simpers, James, Ludwig, Thienhaus, Wuttig, Zhang and Takeuchi13
BiFeO3 (BFO)Reference Wang, Neaton, Zheng, Nagarajan, Ogale, Liu, Viehland, Vaithyanathan, Schlom, Waghmare, Spaldin, Rabe, Wuttig and Ramesh14–Reference Catalan and Scott16 with the rhombohedrally distorted perovskite structure has drawn considerable attention and has been considered as a candidate for Pb-free ferroelectrics due to its multiferroic nature (i.e., coexistence of ferroelectricity and antiferromagnetism) as well as robust ferroelectric properties at room temperature. However, this oxide suffers from high leakage current, large coercive fields, and its electromechanical coefficient is much smaller than those of traditional Pb-based piezo/ferroelectrics. To improve these shortcomings, chemical substitution into either A- or B-site (of the BFO perovskite cell) has been attempted.Reference Cheng, Wang, Dou, Kimura and Ozawa17−Reference Levin, Tucker, Wu, Provenzano, Dennis, Karimi, Comyn, Stevenson, Smith and Reaney27 An important consequence of the chemical substitution is a structural phase transition from the rhombohedral ferroelectric phase of the parent compound (pure BFO) into another structural phase. This indicates that the chemically substituted BFO may emulate the performance of Pb-based piezoelectrics at MPBs.
In this paper, we present our combinatorial studies of the structural and ferroelectric properties of chemically substituted BFO. We discovered the substitution-induced MPB behavior with the enhanced piezoelectric coefficient and dielectric constant. At the MPB, a structural transition from the rhombohedral phase for pure BFO to an orthorhombic phase occurs, which is accompanied by a double hysteresis behavior in polarization–electric field (P-E) hysteresis loops. We find that the behavior can be universally described as a function of the average A-site cation radius. We also investigated the B-site substitution effect on the structural and ferroelectric properties of BFO with a pseudoternary composition spread of the A- and B-site cosubstituted BFO. We found that the structural and ferroelectric properties are less influenced by the B-site substitution. This behavior was further verified by an extensive clustering analysis of experimental data from different characterization techniques for the ternary library. The results demonstrate the significance of the A-site substitution on the structural and ferroelectric properties of BFO. We show that such a comprehensive mapping approach is effective not only in quickly delineating the structural boundaries but also for identifying subtle (yet important) correlations between physical and structural properties in compositional phase spaces of multifunctional materials in general.
II. EXPERIMENTAL DETAILS
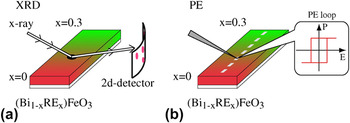
To systematically investigate the A- and B-site substitution effect on structural and ferroelectric properties of BFO, we fabricated combinatorial pseudobinary and ternary thin-film composition spread libraries based on pulsed laser deposition (PLD) technique. The PLD system was equipped with an automated shadow mask and a multitarget system (Pascal Inc., Japan). For fabricating composition spread libraries, gradient wedge layers of end compositions of the library, where the thick end of the wedge is less than the pseudocubic perovskite unit cell (0.4 nm), were deposited in an alternating manner in opposing directions by moving the shadow mask back and forth at the epitaxial deposition condition.Reference Koinuma and Takeuchi1 The thickness of the wedge layer was controlled by the number of shots of the laser pulses, which is determined based on the deposition rate calibrated for each composition. The fabrication of the unit cell height wedge layers is critical for obtaining atomic-scale mixing of the deposited constituent compositions. The wedge layer depositions were repeated until the film thickness reaches the desired value. In our study, the total thickness was set to be 200 nm. The details for our library fabrications were given in Refs. Reference Fujino, Murakami, Anbusathaiah, Lim, Nagarajan, Fennie, Wuttig, Salamanca-Riba and Takeuchi28, Reference Kan, Pálová, Anbusathaiah, Cheng, Fujino, Nagarajan, Rabe and Takeuchi29, and Reference Kan, Suchoski, Fujino and Takeuchi30. Our library was deposited on a (001) SrTiO3 substrate buffered with a 50-nm-thick SrRuO3 film, which serves as the bottom electrode. We note that no interfacial reaction between the library layer and the bottom electrode was observed in transmittance electron microscopy (TEM) observations.Reference Cheng, Kan, Lim, McKenzie, Munroe, Salamanca-Riba, Withers, Takeuchi and Nagarajan31 The composition across the library was determined by an electron probe (JEOL JXA-8900, Tokyo, Japan) with an uncertainty of ±1.5% at each measurement point. To track structural evolution due to the A- and B-site substitutions, we mainly used scanning x-ray microdiffraction [Fig. 1(a)]. For x-ray diffraction (XRD) measurements, the x-ray incident beam spot was focused into 0.5 mm φ with an aperture, and the diffracted signals were collected with a two-dimensional (2D) detector (Bruker D8, Karlsruhe, Germany) as shown in Fig. 1(a). The Raman scattering spectra were obtained from a confocal Raman spectrometer (U1000, Horiba Jobin-Yvon, France) operating in the backscattering configuration. The source was a 532-nm diode laser with about 10 mW of power incident on the sample. The signal from the substrate was subtracted from the spectra. For electrical characterizations [Fig. 1(b)], a 100-nm-thick Pd top electrodes layer with 50 × 50 μm2 squares was sputtered and patterned through a conventional liftoff process [Fig. 1(b)]. The P-E hysteresis loops were acquired at 5–20 kHz with a ferroelectric test system (Premier II, Radiant Technologies Inc., San Diego, CA). Dielectric constants were evaluated with an LCR meter (4275A, Hewlett Packard/Agilent, Santa Clara, CA) with an AC signal of 80 mV at a frequency of 100 kHz. The out-of-plane piezoelectric coefficient d 33 versus electric field curves was obtained by piezoelectric force microscopy (PFM) with a Pt-/Ir-coated cantilever.
Schematics describing the central concept of the combinatorial search of the structural boundary in RE-substituted BFO with the thin-film composition spread technique. In the schematics, the color gradient represents the composition gradient, which is typically created over a 6-mm length along one direction of the sample. By performing (a) XRD and (b) polarization hysteresis (P-E loop) measurements along the direction of the composition gradient, we obtain the RE substitution-induced changes in structural and ferroelectric properties in BFO.

III. COMBINATORIAL DISCOVERY OF A MPB IN RARE-EARTH-SUBSTITUTED BFO
To discover the MPB in chemically substituted BFO, we explored the substituting composition regions where the lattice parameters display large concomitant changes, using the thin-film composition spread technique. We selected rare-earth elements (RE3+ = Sm3+, Gd3+, and Dy3+), for which the ionic radii are smaller than Bi3+, as substituting dopants and fabricated pseudobinary composition spreads of (Bi1−xREx)FeO3 (RE-BFO).
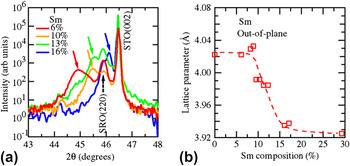
Figure 2(a) displays a series of 2θ–θ scans of Sm-substituted BFO around the (002) STO Bragg reflection as a function of Sm composition. Only (002)pc reflections from the film and the substrate are seen, confirming epitaxial growth of the film over the substitution composition range studied here, where the subscript pc denotes the pseudocubic perovskite notation. It is seen that with increasing Sm substitution [Fig. 2(a)], the (002)pc reflection from the Sm–BFO layer shifts toward the higher 2θ side, indicating that the Sm substitution results in shrinkage of the out-of-plane lattice parameter d 001_pc. This shift can also be seen in Fig. 2(b), where the d 001_pc determined from the (002)pc reflection is plotted against the Sm composition. The lattice constant shift is consistent with the fact that Sm3+ has a smaller ionic radius than Bi3+. We note that d 001_pc undergoes a large drop of ∼0.09 Å in the substitution composition region from 10% to 15%, suggesting that the rhombohedral phase for pure BFO undergoes a structural phase transition. Indeed, detailed structural characterizations based on x-ray and electron diffraction techniquesReference Fujino, Murakami, Anbusathaiah, Lim, Nagarajan, Fennie, Wuttig, Salamanca-Riba and Takeuchi28, Reference Kan, Pálová, Anbusathaiah, Cheng, Fujino, Nagarajan, Rabe and Takeuchi29, Reference Cheng, Kan, Lim, McKenzie, Munroe, Salamanca-Riba, Withers, Takeuchi and Nagarajan31, Reference Kan, Cheng, Nagarajan and Takeuchi32 (see Sec. IV for details) have revealed that the observed drop in d 001_pc corresponds to the structural phase transition from the rhombohedral phase to an orthorhombic phase at Sm 14%.
(a) X-ray 2θ–θ profiles across the structural phase transition for Sm-substituted BFO thin films. All scans were performed at room temperature. The colored solid arrows denote the (002)PC reflections from Sm-substituted BFO layer. (b) Substitution-induced evolution of the out-of-plane lattice parameter d 001_pc for Sm-substituted BFO. The lattice parameter is determined from the (002)pc reflection. The dotted line is drawn as a guide to eyes.

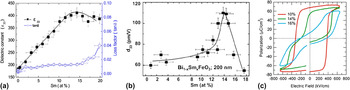
We also found that at the structural boundary, both out-of-plane dielectric constant ε33 and piezoelectric coefficient d 33 are enhanced.Reference Fujino, Murakami, Anbusathaiah, Lim, Nagarajan, Fennie, Wuttig, Salamanca-Riba and Takeuchi28, Reference Cheng, Kan, Anbusathaiah, Takeuchi and Nagarajan33Figure 3(a) shows the Sm composition dependence of ε33 and loss tangent (tanδ) measured at 10 kHz. The ε33 reaches a maximum at Sm 14%, while tanδ at this composition is relatively low at ∼0.01. In Fig. 3(b), we plotted the high field piezoelectric coefficient d 33 evaluated by quantitative PFM as a function of the Sm composition. Around Sm 11–13%, the effective d 33 displays a rapid increase, peaking at 110 pm/V for Sm 14%, which is where the structural transition occurs. Beyond this composition, it rapidly decreases to ∼55 pm/V for Sm 17%. We note that the measured remanent and high field d 33 here are comparable to values previously reported for epitaxial thin films of Pb-based compounds such as Pb(Zr,Ti)O3 (PZT) at MPB.Reference Nagarajan, Stanishevsky, Chen, Zhao, Liu, Melngailis, Roytburd, Ramesh, Finder, Yu, Droopad and Eisenbeiser34 In addition, the polarization hysteresis (P-E) loop exhibits the concomitant changes across the structural transition as shown in Fig. 3(c). As the Sm substitution increases, the square-shaped ferroelectric hysteresis loops begin to be distorted, and at the transition boundary, the loops exhibit a transition from single to double hysteresis loops. It is worthwhile to note that similar behavior was seen for the cases where RE = Gd3+ and Dy3+,Reference Cheng, Kan, Anbusathaiah, Takeuchi and Nagarajan33, Reference Kan and Takeuchi35 both of which have ionic radii smaller than that of the Sm3+ ion.
(a) Dielectric constant ε33 and tanδ of (Bi1−xSmx)FeO3 as a function of Sm composition. The data were measured at 1 MHz (zero bias). (b) High field d 33 determined by PFM as a function of Sm composition. (c) P-E hysteresis loops with 25 kHz at compositions of x Sm= 0.1, 0.14, and 0.16. In (a) and (b), the curve is a guide to the eye.

In comparing nominally similar thin-film samples of the same thickness,Reference Nagarajan, Stanishevsky, Chen, Zhao, Liu, Melngailis, Roytburd, Ramesh, Finder, Yu, Droopad and Eisenbeiser34 the MPB behaviors discovered here exhibit intrinsic piezoelectric properties, which are among the best. The added advantage of the present system is that it is a much simpler system in terms of the solid-state crystal chemistry compared to some of the other reported Pb-free compounds,Reference Saito, Takao, Tani, Nonoyama, Takatori, Homma, Nagaya and Nakamura36 and it has a relatively easy method for processing.
IV. UNIVERSAL BEHAVIOR IN RE-SUBSTITUTED BFO
In Sec. III, we showed that RE-substituted BFO has a MPB with enhancement of ε33 and d 33. The next step is to consider the mechanism behind the enhanced properties at MPB. To this end, we expanded our study and systematically compared structure–property relationships in RE-substituted BFO (RE = Sm, Gd, and Dy) with the thin-film composition spread technique. We selected trivalent Sm, Gd, and Dy as substituting dopants whose ionic radii with 12-fold coordination are Bi3+ (1.36 Å) > Sm3+ (1.28 Å) > Gd3+ (1.27 Å) > Dy3+ (1.24 Å).Reference Jia37 For each composition spread with a different RE3+ dopant, the dopant concentration was continuously varied from x = 0 (pure BFO) to a fixed value (typically, x = 0.3) along the direction of the spread sample, as shown in Fig. 1.
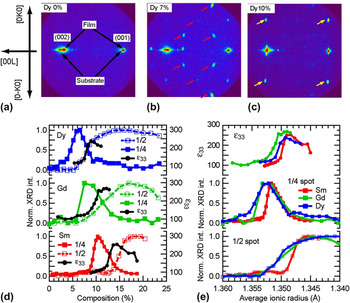
Figures 4(a)–4(c) show typical 2D XRD images taken for (Bi1−xDyx)FeO3 with x Dy = 0, 0.07, and 0.1, respectively. The images capture essential and common characteristics of the substitution-induced structural evolution for all RE (= Dy, Gd, and Sm) cases. For pure BFO [x Dy = 0, Fig. 4(a)], only (001) and (002) reflections from the film and the substrate are observed. With increasing x Dy, extra diffraction spots [denoted by red arrows in Fig. 4(b)] begin to appear in addition to the fundamental spots. Corroborated by TEM images and zone axis selected-area electron diffraction patterns,Reference Cheng, Kan, Lim, McKenzie, Munroe, Salamanca-Riba, Withers, Takeuchi and Nagarajan31, Reference Cheng, Borisevich, Kan, Takeuchi and Nagarajan38 the extra spots are assigned as 1/4{011} spot and arise from the antiparallel cation displacements along the [011] direction in the local region. Although this structure closely resembles that of the well-established antiferroelectric (AFE) structure in PbZrO3 (PZO),Reference Karimi, Reaney, Han, Pokorny and Sterianou23, Reference Sawaguchi, Maniwa and Hoshino39−Reference Karimi, Reaney, Levin and Sterianou41 macroscopic properties of the films in the composition range, where the 1/4 spots are observed, are those characteristics of a ferroelectric phase not an AFE phase, which is consistent with the fact that the structure associated with the 1/4 spots is a minority phase.
(a–c) 2D XRD images for the Dy–BFO composition spread film on (001) SrTiO3 substrate. (a) x Dy = 0. (b) x Dy = 0.07. (c) x Dy = 0.1. The 2D XRD images are recorded in the 2θ-χ plane with the incident x-ray beam parallel to the [100]STO direction. For (b) and (c), the spots marked with arrows belong to 1/4{011} and 1/2{010}, respectively. All spots are indexed by the pseudocubic unit cell notation. (d) Normalized XRD intensities of (0, 1/4, 7/4) (filled square, denoted as 1/4, or 1/4 spot) and (0, 1/2, 2) (open square, denoted as 1/2, or 1/2 spot) XRD superstructure spots and ε33 at zero bias (black dot) as a function of RE dopant composition. (e) All data in (d) are plotted against r ave. The ionic radii in 12-fold coordination are 1.36 Å for Bi3+, 1.28 for Sm3+, 1.27 for Gd3+, and 1.24 for Dy3+ ions.Reference Jia37 This change in r ave corresponds to the change in the Goldschmidt tolerance factor from 0.954 (r ave = 1.36 Å) to 0.947 (r ave = 1.34 Å) with 0.645 and 0.14 Å for the ionic radii of Fe3+ and O2-, respectively.

With further increase in x Dy [Fig. 4(c)], the 1/4{011} superstructure spots disappear and new superstructure spots (marked with yellow arrows) begin to emerge. These new spots correspond to the 1/2{010} reflection spots resulting from the unit cell doubling along the in-plane direction as compared to the rhombohedral BFO lattice. From detailed x-ray reciprocal space mappings,Reference Kan, Pálová, Anbusathaiah, Cheng, Fujino, Nagarajan, Rabe and Takeuchi29, Reference Kan, Cheng, Nagarajan and Takeuchi32 a film with the 1/2{010} spots is in an (pseudo-) orthorhombic structural phase with the unit cell having the dimensions of √2a pc × √2a pc × 2a pc, where a pc is the pseudocubic perovskite lattice parameter.
In the upper panel of Fig. 4(d), we plot the normalized intensities of the (0, 1/4, 7/4) spot (a 1/4{011} spot) arising from the PZO-type minority phase and the (0, 1/2, 2) spot (a 1/2{010} spot) due to the occurrence of the cell doubling in the majority phase for Dy–BFO. The intensity of the 1/4{011} spot reaches a maximum at 6% substitution. Beyond this substituting composition, the 1/4{011} spot intensity decreases, while the 1/2{010} spot becomes dominant due to the phase transition from the rhombohedral phase to the orthorhombic one. In the upper panel of Fig. 4(d), we also plot the zero bias ε33, which reaches a maximum of ∼250 at the structural boundary. The observed structural evolution and the enhanced properties are common to all three RE dopants [Fig. 4(d)]. A key observation is that the composition of the structural transition shifts toward the larger composition values as the ionic radius of the RE dopant becomes larger. For RE = Dy, which has the smallest ionic radius of the three elements, 8% substitution is sufficient to induce the transition. On the other hand, for RE = Sm, which has the largest radius, 14% substitution is necessary. This observation is attributed to a hydrostatic pressure effect caused by the smaller radii of the isovalent RE ions, namely a chemical pressure effect. Figure 4(e), where the same data shown in Fig. 4(d) are plotted together against the average A-site ionic radius r ave, captures the behavior universal to all the RE dopants. The curves collapse together, revealing an underlying common behavior as a function of r ave. We also note that the observed structural evolution is independent on the thickness (in the thickness region larger than 200 nm) and the type of substrate.Reference Kan, Pálová, Anbusathaiah, Cheng, Fujino, Nagarajan, Rabe and Takeuchi29 This observation rules out the possibility that the observed universal structural evolution results from some thickness- or substrate-induced effects.
It is interesting to note that the change in r ave also results in the change in the average A-site ionic polarizability. This is due to the fact that for RE elements (lanthanides), the ionic polarizability is directly proportional to the ionic radius.Reference Shannon42 Thus, one can look at the observed universal trend as a function not only of r ave, and thus chemical pressure, but also as a function of the A-site ionic polarizability. In fact, a similar looking universal behavior as seen in Fig. 4(e) can be obtained when the properties are plotted against the average ionic polarizability (not shown).
We also note that there have been a number of theoretical and experimental investigations on pressure-induced structural transitions in BFO.Reference Ravindran, Vidya, Kjekshus, Fjellvåg and Eriksson43−Reference Guennou, Bouvier, Chen, Dkhil, Haumont, Garbarino and Kreisel45 It is known that BFO itself undergoes a pressure-induced structural transition into the Pnma (GdFeO3-type) orthorhombic phase that has the same structure as the one for RE-orthoferrites. It is reasonable that the chemical pressure effect due to A-site substitution results in a similar transition.
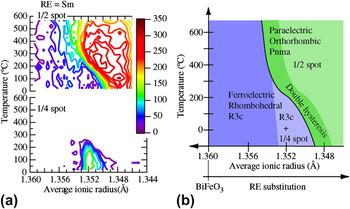
To further investigate the phase stability and the role of the superstructures in determining the functional behavior, we also tracked the structural evolution across the composition spreads as a function of temperature using 2D XRD images. In Fig. 5(a), we show contour plots of the (0, 1/4, 7/4) and the (0, 1/2, 2) XRD spot intensities as functions of temperature and the average ionic radius r ave for the case of Sm-substituted BFO thin films, to closely monitor the occurrence of the PZO-type structure and the orthorhombic structure, respectively. Near the structural boundary composition region, as the temperature is raised from room temperature, the 1/4 spot gradually decreases in intensity, while the 1/2 spot intensity gets enhanced. This indicates that on the higher temperature side, the orthorhombic phase is the stable phase. More importantly, the same rhombohedral to orthorhombic structural phase transition induced by RE substitution occurs with increasing temperature. A similar temperature-induced structural phase transition from the rhombohedral phase to the orthorhombic one was also observed from the synchrotron XRD study.Reference Emery, Cheng, Kan, Rueckert, Alpay, Nagarajan, Takeuchi and Wells46 It is worthwhile to note that Dy-substituted BFO exhibits essentially the same contour plots of the 1/4 and 1/2 spot intensities.Reference Kan, Pálová, Anbusathaiah, Cheng, Fujino, Nagarajan, Rabe and Takeuchi29 This indicates again that the average ionic radius r ave is the critical parameter that governs the structural properties of RE-substituted BFO. Based on the results, we arrive at a universal phase diagram for RE-substituted BFO, as illustrated in Fig. 5(b). On the lower temperature side, the composition region in light blue where the minority phase gives rise to the 1/4 spot is seen to “bridge” the ferroelectric rhombohedral phase regions (marked in blue) and the orthorhombic phase (marked in green). This bridging phase has been previously shown to result in lattice incommensuration at the rhombohedral–orthorhombic phase boundary.Reference Cheng, Kan, Lim, McKenzie, Munroe, Salamanca-Riba, Withers, Takeuchi and Nagarajan31 As the temperature is elevated, the composition region with the 1/4 spot phase disappears, and the orthorhombic phase lies directly adjacent to the ferroelectric region.
(a) Contour plots of intensities (counts per second) of (0, 1/2, 2) (1/2 spot, upper panel) and (0, 1/4, 7/4) spots (1/4 spot, bottom panel) as functions of temperature and the average A-site ionic radius for the Sm-substituted BFO composition spread thin films. (b) Proposed phase diagram for (Bi1−xREx)FeO3. The black line represents the structural phase boundary between the rhombohedral (in blue) and the orthorhombic (in green) structural phases. At lower temperature side, the 1/4 spot is observed in the region in light blue. The double hysteresis loop behavior [see main text and Fig. 6 for details] emerges in the region in dark green.

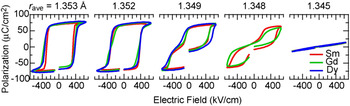
Universal behavior in polarization hysteresis loops across the structural transition for RE-substituted BFO thin films (RE = Sm, Gd, and Dy). Room temperature P-E hysteresis loops for 200-nm-thick films are plotted for r ave. For each r ave, the hysteresis loops collapse into a single curve. This clearly demonstrates universal behavior in ferroelectric properties of RE-substituted BFO.

The ferroelectric properties also display concomitant evolution in response to the substitution-induced structural changes, and thus, the universal behavior also exists in the ferroelectric properties in RE-substituted BFO. This is shown in Fig. 6, where room temperature polarization hysteresis loops for the films with various RE substituting compositions are displayed such that r ave is the same for each group of curves. For each r ave, the hysteresis loops collapse together, and the general shape and ferroelectric character of the hysteresis loop are constant. This indicates that r ave is the universal parameter to describe not only the structural but also the ferroelectric properties. Therefore, we can conclude that the chemical pressure effect provided by the RE substitution is the primary cause for the MPB behavior in RE-substituted BFO.
As we cross the structural boundary (corresponding to r ave ∼ 1.35 Å at room temperature), the polarization hysteresis loop consequently exhibits a transition from single to double hysteresis loops with decreasing r ave, as shown in Fig. 6. The corresponding Goldschmidt tolerance factor for this r ave is 0.9509. (For pure BFO, the tolerance factor is 0.954.) For the ferroelectric composition region immediately adjacent to the transition (r ave > 1.35 Å), the ferroelectric square-shaped hysteresis loops with saturated polarizations of 70 μC/cm2 are observed. As one approaches the transition (r ave ∼ 1.35 Å), the hysteresis loop first becomes distorted, and then, it transitions to a fully developed double hysteresis loop beyond the transition (r ave < 1.35 Å). Based on a first-principles calculations study,Reference Kan, Pálová, Anbusathaiah, Cheng, Fujino, Nagarajan, Rabe and Takeuchi29 an electric field-induced transformation from a paraelectric orthorhombic phase to a polar rhombohedral phase was proposed as the origin of the double hysteresis behavior as well as the associated enhancement in the piezoelectric coefficient. The proposed electric field-induced phase transformation events can also explain the enhancement of d 33 at the boundary. Similar electric field-induced transformation and the resulting enhancement of piezoelectric response have been observed in Pb-based ferroelectric materials at MPBsReference Park and Shrout7−Reference Bellaiche, García and Vanderbilt11 such as Pb(Zr,Nb)O3–PbTiO3, PZT, and Pb(Mg,Nb)O3–PbTiO3. We believe that the enhancement in the electromechanical properties we see in the present RE-substituted BFO thin filmsReference Fujino, Murakami, Anbusathaiah, Lim, Nagarajan, Fennie, Wuttig, Salamanca-Riba and Takeuchi28, Reference Kan, Pálová, Anbusathaiah, Cheng, Fujino, Nagarajan, Rabe and Takeuchi29, Reference Cheng, Kan, Anbusathaiah, Takeuchi and Nagarajan33 is of similar nature.
V. COMBINATORIAL INVESTIGATIONS OF STRUCTURAL AND FERROELECTRIC PROPERTIES OF A- AND B-SITE COSUBSTITUTED BFO
According to the universal behavior in RE-substituted BFO,Reference Kan, Pálová, Anbusathaiah, Cheng, Fujino, Nagarajan, Rabe and Takeuchi29 the structural transition boundary emerges when the average A-site ionic radius r ave is 1.35 Å. This ionic radius corresponds to a tolerance factor of 0.9509. The same tolerance factor can, in fact, also be obtained by making B-site substitution into the BFO lattice. This raises an important question about whether B-site substitution can also introduce a MPB in BFO. Given that the ferroelectric polarization mainly results from the 6s lone pairReference Baettig, Schelle, LeSar, Waghmare and Spaldin47 of the Bi ion in the A-site, one might expect that B-site chemical substitution would improve the ferroelectric and dielectric properties at the structural boundary of BFO. However, to date, little has been known about the B-site substitution effect in BFO.
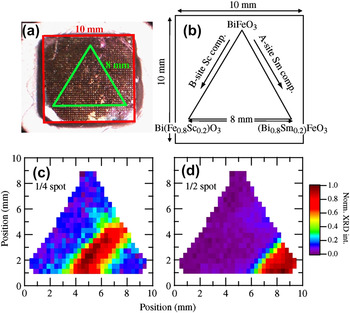
To address the question, we investigated the structural and ferroelectric properties in the A- and B-site cosubstituted BFO in the form of a pseudoternary composition spread library.Reference Kan, Suchoski, Fujino and Takeuchi30Figures 7(a) and 7(b) show an optical image and a design schematic of the fabricated library, respectively. In this design, the substituting composition of each dopant (A- or B-site dopant) varies along one of the sides of the triangle, which allows us to easily separate the A- and B-site substitution effect. We selected SmReference Fujino, Murakami, Anbusathaiah, Lim, Nagarajan, Fennie, Wuttig, Salamanca-Riba and Takeuchi28, Reference Cheng, Kan, Lim, McKenzie, Munroe, Salamanca-Riba, Withers, Takeuchi and Nagarajan31 and ScReference Yasui, Uchida, Nakaki, Nishida, Funakubo and Koda48 as the substitutional dopants for the A- and B-site, respectively. As both dopants have a robust 3+ valence state, the substitution is unlikely to result in an increase in leakage current. Besides, in terms of the ionic radius, Sm3+ has a smaller ionic radius (1.28 Å in 12-fold coordination) than Bi does (1.36 Å), and Sc3+ has a larger ionic radius (0.745 Å in 6-fold coordination) than Fe3+ does (0.645 Å). Thus, according to the tolerance factor picture, we expect that the substitution induces distortions or tilting of the oxygen octahedral in the BFO lattice. In fact, the end materials SmFeO3 and BiScO3 have (distorted) orthorhombic structures with dimension of √2a pc × √2a pc × 2a pcReference Marezio, Remeika and Dernier49, Reference Maslen, Streltsov and Ishizawa50 and 2√2a pc × √2a pc × 4a pc,Reference Belik, Iikubo, Kodama, Igawa, Shamoto, Maie, Nagai, Matsui, Stefanovich, Lazoryak and Takayama-Muromachi51 respectively.
(a) Real image of the fabricated ternary library of (Bi,Sm)(Fe,Sc)O3. (b) Design schematic of the ternary library. The equilateral triangle-shaped library with the 8-mm-long side was made on the substrate with 10 by 10 mm in size. The compositions in the schematic were determined by the electron probe. (c, d) The normalized intensities of (c) (0, 1/4, 7/4) (1/4{011}) and (d) (0, 1/2, 2) (1/2{010}) spots are respectively displayed against the position in the library.

The scanning 2D XRD revealed that the fabricated library undergoes a structural evolution similar to the ones observed for RE-substituted BFO pseudobinary composition spreads, which is characterized by 1/4{011} and 1/2{010} superstructure spots. In Figs. 7(c) and 7(d), we plot normalized intensity of the 1/4{011} and 1/2{010} spots against the measurement position in the ternary, respectively. We note that these extra spots have high intensities at the right bottom region in the library, and that both 1/4 and 1/2 spot intensities vary along the right edge of the library, where Sm composition is varied continuously. Along this edge, we see that the 1/4 and 1/2 spot intensities switch over at the same composition as we observed for the above-discussed RE-substituted BFO binary spreads (Fig. 4), again indicating the occurrence of a structural transition boundary from the rhombohedral phase to the orthorhombic one. Importantly, the composition measurements found that the structural boundary occurs at 14% Sm substitution, irrespective of Sc composition (see Fig. 10 for details). The observed behavior indicates that Sm substitution into the A-site of the BFO lattice plays a dominant role in the rhombohedral-to-orthorhombic structural transition, and that the B-site substitution has smaller influence on the structural transition in BFO in the composition region studied here.
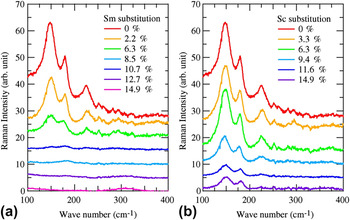
We also performed Raman scattering measurements on this ternary library. Figure 8 presents a series of Raman spectra taken along the side of the library where Sm3+ or Sc3+ substitution was varied continuously. For the low substitution region, we see the three prominent peaks for the A1 phonon modes at 147, 179, and 230 cm−1. The positions of the A1 phonon modes are in a good agreement with the reported values of the A1 phonon mode for the BFO single composition thin films.Reference Singh, Jang, Ryu and Jo52, Reference Singh, Ryu and Jang53 We found that the Raman spectra display a distinct evolution depending on the substitution site. As the A-site Sm substitution increases up to 8% [Fig. 8(a)], the A1 phonon peaks begin to show a decrease in intensity along with a slight increase in Raman shift. With further Sm substitution, the scattering intensities eventually disappear except a weak feature near 170 cm−1 and a new broad peak at 310 cm−1. Around the Sm 13% substitution, the signal all but disappears with a weak feature near 170 cm−1 and a new broad peak at ∼310 cm−1. At Sm 14.9%, the only observed feature is the peak at 310 cm−1, which can be attributed to the orthorhombic phase of SmFeO3.Reference Venugopalan, Dutta, Ramdas and Remeika54 In the case of the B-site Sc substitution [Fig. 8(b)], the three A1 phonon modes are clearly seen in the all spectra, with only some decrease in intensity, which is in sharp contrast to the Sm substitution case. This is consistent with the fact that the A-site substitution controls the structural properties of BFO [Figs. 7(c) and 7(d)].
Representative Raman spectra taken for the fabricated ternary library. In (a) and (b), the spectra are collected along (a) Sc = 0% and (b) Sm = 0% sides of the library where Sm and Sc substitutions are varied, respectively.

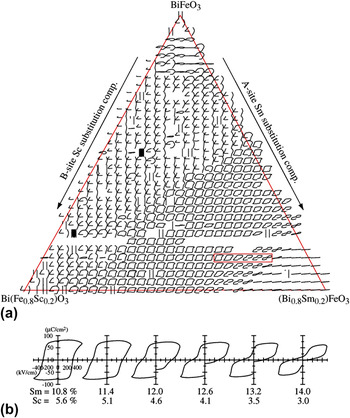
We also see concomitant changes in ferroelectric properties in response to the substitution-induced structural evolution. In Fig. 9, we present all room temperature P-E hysteresis loops taken across the library. Each loop is displayed at the position of the corresponding top electrode where the measurement was made. In the low substitution region, unclosed loops resulting from high leakage current are observed. As the Sm and Sc substitutions are increased, square-shaped P-E hysteresis loops with a saturation polarization of about 70 μC/cm2 begin to appear. This indicates that the substitution results in a reduction of the leakage current. The fact that the composition region where only Sc is substituted corresponds to hysteresis loops that are characteristic of leaky ferroelectrics suggests that Sm substitution is more effective in reducing the leakage current than Sc substitution. It is interesting to point out that in the composition region where the square-shaped ferroelectric hysteresis loops begin to appear, we see appearance of the 1/4 spot due to the local antiparallel cation displacements (Fig. 7). This suggests that the reduced leakage current is perhaps not caused by the Sm substitution into the rhombohedral BFO lattice alone, but instead, it is due to the substitution-induced phase coexistence between the rhombohedral phase and the 1/4 spot structural phase.
(a) All polarization hysteresis loops taken for the fabricated ternary library. The loops are displayed at the position of the top electrodes, which are located 200 μm apart horizontally and 150 μm apart vertically on the ternary library. All loops are obtained at 5 kHz at room temperature. For each loop, the horizontal axis ranges from −500 to 500 kV/cm for electric field, and the vertical axis is from −120 to 120 μC/cm2 for polarization. (b) “Zoom up” of the hysteresis loops in the red box in (a).

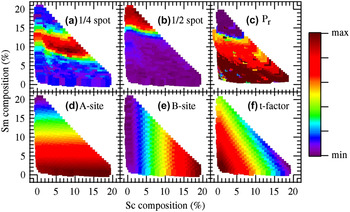
Plots of (a) (0, 1/4, 7/4) (1/4{011}) spot intensity, (b) (0, 1/2, 2) (1/2{010}) spot intensity, (c) remanent polarization P r, (d) average A-site ionic radius, (e) average B-site ionic radius, and (f) tolerance factor as function of Sm and Sc substitution composition. In (a), (b), and (c), the maximum (red hue) and minimum (purple hue) of the color bar are 1.0 and 0.0, respectively. In (d), the maximum is 1.36 Å and the minimum is 1.344 Å. In (e), the maximum is 0.664 Å and the minimum is 0.645 Å. In (f), the maximum is 0.953 and the minimum is 0.945.

In Fig. 9(b), we display the P-E hysteresis loops indicated by the red box in Fig. 9(a). As one approaches the MPB at Sm 14%, the ferroelectric hysteresis loops become distorted, and the double hysteresis behavior begins to appear. Beyond Sm 14%, fully developed double hysteresis loops are observed. This behavior is in good agreement with that observed for RE-substituted BFO thin films (Fig. 6). It is seen that the evolution in the ferroelectric properties occurs along the Sm substitution composition axis, as in the case for the structural properties (Fig. 7). Thus, this leads to the conclusion again that the A-site substitution, which provides the chemical pressure effect, plays the crucial role in both structural and ferroelectric properties across the structural boundary in BFO.
To further delineate the composition dependence of the structural and ferroelectric properties in BFO, we plot the normalized intensities of the (0, 1/4, 7/4) (referred to as 1/4) and (0, 1/2, 2) (referred to as 1/2) XRD spots, as well as the remanent polarization (P r) of the P-E loops against the Sm and Sc substitution compositions in Figs. 10(a)–10(c), respectively. We note that in these plots, the data points, which were triangularly distributed on the original library layout, have been displaced in such a way that the Sm and Sc compositions vary along the vertical and horizontal axes, respectively. All three parameters [Figs. 10(a)–10(c)] are much more strongly dependent on A-site Sm substitution than on Sc substitution. Above 14% Sm, the 1/4 and 1/2 spot intensities switch over, confirming the occurrence of the rhombohedral to orthorhombic structural transition. As a consequence of the structural transition, P r also becomes zero at Sm ≈ 14%, which corresponds to the transition from square ferroelectric hysteresis loops to double hysteresis loops, as seen in Fig. 9. In Figs. 10(d)–10(f), we compare the observed trends in the structural and ferroelectric properties with the changes in r ave in the A-site, r ave in the B-site, and the tolerance factor, respectively. To calculate the parameters in Figs. 10(d)–10(f), we used 1.36 Å as an ionic radius for the Bi3+ ion in 12-fold coordination and 1.28 Å for the Sm3+ ion.Reference Jia37 For the Fe3+ and Sc3+ ions with 6-fold coordination, 0.645 and 0.745 Å are used, respectively. The substitution-induced variations in the 1/4 spot intensity, the 1/2 spot intensity, and P r in Figs. 10(a)–10(c) essentially agrees with changes in the average A-site ionic radius [Fig. 10(d)]. This reinforces the picture that the average A-site radius is the controlling parameter and that the chemical pressure provided by A-site substitution governs the structural and the ferroelectric properties in BFO.
VI. CLUSTERING ANALYSIS OF THE COSUBSTITUTED BFO TERNARY LIBRARY
To further delineate the relationships among the observed substitution-induced evolution of structural and ferroelectric properties, we performed agglomerative hierarchical clustering analysis of the Raman spectra and P-E hysteresis loops. Hierarchical cluster analysisReference Johnson55 has previously been applied to combinatorial materials experiments, where example applications include the analysis of XRD spectra,Reference Long, Hattrick-Simpers, Murakami, Srivastava, Takeuchi, Karen and Li56, Reference Barr, Dong and Gilmore57 Raman spectra,Reference Barr, Cunningham, Dong, Gilmore and Kojima58 and gas sensor “fingerprints.”Reference Scheidtmann, Frantzen, Frenzer and Maier59 The analysis here was performed using CombiView, which is written in MATLAB. The idea behind performing clustering analysis is to map out the regions of composition space that have similar properties (in this case, similar Raman spectra or P-E loops) by forming discrete groups of similar samples. Once the groups of samples have been determined, the compositions for each group are plotted on the ternary composition diagram, providing a map of compositions with similar properties. This mapping allows us to identify critical compositions where there is a systematic change in the materials properties. In particular, these critical compositions are often found at the interface between two groups of similar samples. The specific change in the materials properties is then identified by looking at the physical property data for samples near the interface between groups. The cluster analysis therefore serves as a guide for rapidly identifying such material's composition at the interface between groups with similar physical properties.
The details of the agglomerative hierarchical cluster analysis performed here include the choice of a distance metric, a linkage method, and a threshold distance. The distance metric determines the definition of the “similarity” between two spectra. The distance metric used here was the correlation distance. The correlation distance is defined as one minus the Pearson correlation coefficient between two spectra. Therefore, a distance of zero between two spectra corresponds to identical spectra, while a distance of two would correspond to the maximum dissimilarity. In addition to defining the distance between a pair of spectra, hierarchical clustering also requires a way to define the distance between two groups of spectra. This is called the linkage method. In our case, we used the group average linkage method. In the group average linkage method, the distance between two groups of spectra is taken to be the mean distance for all possible pairs of spectra, where each pair entails one spectrum from each group. The final parameter in the cluster analysis is the threshold distance. This level determines how fine-grained the final groups are. A high distance threshold allows a larger average distance between groups, producing larger groups. The interfaces between these larger groups tend to correspond to more significant variations in the physical properties. On the other hand, we would like to exploit the power of the combinatorial approach in identifying subtle trends in the data acquired from the library, so it is desirable to set the threshold low to produce small groups. In practice, the lower limit for the threshold is often set by measurement artifacts or noise present in the data, which create artificial divisions between groups.
Before performing cluster analysis for the Raman spectra, some preprocessing of the spectra was performed. In particular, the spectra were renormalized such that the total counts in the region from 530 to 730 cm−1 were constant. This region was chosen because there was no Raman signal from the fabricated library layer. Second, the Raman spectra were cropped down to the region from 100 to 550 cm−1, which is the region containing all the film peaks.
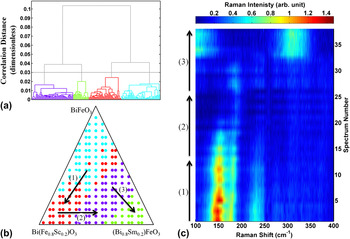
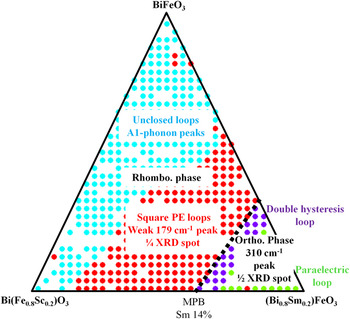
In Fig. 11, we present the results of the clustering analysis for the Raman spectra. Figure 11(a) presents a dendrogram containing the hierarchy of sample groupings as a function of the correlation distance between groups, along with the threshold correlation distance (which is ∼0.03) used to produce the final groupings of Raman spectra. As one moves from small threshold distance to large threshold distance, the small groups are joined together (agglomerated), as denoted by horizontal connecting lines. Figure 11(b) shows the regions of the composition space covered by each group of similar Raman spectra. To identify the difference in the Raman spectra from one group to another, we select a subset of samples that crosses the boundary between adjacent groups. We plot the Raman spectra for these selected samples as a heat map, with the Raman shift along the abscissa and the spectrum number along the ordinate axis. The arrows in Fig. 11(b) indicate the ordering of the Raman spectra displayed in Fig. 11(c). As we move along the arrow (1), from the cyan to the red group, we find the gradual decrease in the intensities of the A1 phonons. As we move along the arrow (2), from the red to the purple group, we see that the intensities of the A1 phonons are highly attenuated except the weak feature near 170 cm−1. Finally, as we move along the arrow (3), we find that at the boundary between the purple and green groups, a broad peak appears at 310 cm−1. The groupings presented here therefore map out the major features of the Raman data in the composition space (Fig. 8).
Cluster analysis of the Raman data. (a) A dendrogram showing the threshold correlation distance (∼0.03) used to create the groups of Raman spectra. Each Raman spectrum is represented by a vertical line at the base of the dendrogram. The agglomeration of Raman spectra into groups is indicated by horizontal tie bars at the correlation distance between the groups. (b) The groups of similar Raman spectra marked on the ternary diagram. The three arrows in the figure indicate the compositions and ordering of Raman spectra displayed in the (c). (c) A selection of Raman spectra that traverse the groups produced in the cluster analysis. The transition between groups of similar spectra occurs roughly in the middle of each vertical arrow.

To perform cluster analysis on the P-E loops, the loops were “unrolled” into two spectra. That is, for any given P-E loop, we consider two spectra, one for the electric field at each data point, hereafter called the E-spectrum, and one for the polarization at each data point, hereafter called the P-spectrum. To make a valid comparison between P-spectra constructed in this way, it is necessary that the electric field at each data point in each loop is the same. That is, the E-spectra for all the data set must be the same. However, it turned out that the large leakage current in a shorted test capacitor causes some variation in the E-spectra. We therefore removed the leaky loops for the completely shorted capacitors from the set of the P-E loops before performing cluster analysis on the P-spectra.
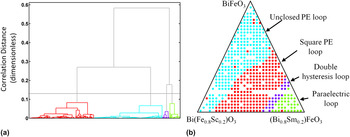
The results of the cluster analysis for the P-spectra are displayed in Fig. 12. Comparing the cluster results to the P-E loops in Fig. 7, it can be seen that the cluster analysis has formed groups that depend on the features of the P-E loops. In the cyan group, the loops are unclosed due to the leakage in the films. The red group corresponds to the composition region where the square-shaped P-E loops are seen, indicating that the films are ferroelectric in this region. In the purple group region, we see well-developed double hysteresis loops. In the green group region, the loops are characteristic of paraelectric behavior (less-pronounced double hysteresis behaviorReference Kan, Cheng, Nagarajan and Takeuchi32 here).
Cluster analysis of the P-E loops. (a) A dendrogram showing the threshold correlation distance (∼0.13) used to create the groups pictured in (b). (b) Groups of similar P-E loops based on cluster analysis. The groups identified correspond to the different types of P-E loops visible in Fig. 9.

Combined with the structural evolution determined by XRD [Figs. 7(c) and 7(d)], the cluster analysis reveals close ties between the structural and ferroelectric properties in cosubstituted BFO. The substitution-induced behaviors are summarized in Fig. 13. It is obvious that the behaviors are less dependent on the B-site Sc substitution. For the rhombohedral phase with no or lower Sm substitution (composition regions in cyan), the Raman A1 phonon peaks are pronounced, and the P-E loops are unclosed due to the leakage. With increasing the Sm substitutions (composition regions in red), the 1/4 XRD spot due to the PZO minority phase is seen, and the P-E loops become closed and square shaped indicating that the leakage currents are reduced in the presence of the 1/4 phase. In this composition region, the Raman A1 phonon peaks are largely decreased in their intensity with a weak feature around 170 cm−1. When the Sm substitution reaches at 14%, MPB emerges where the rhombohedral phase undergoes to the structural transition to the orthorhombic phase, which is characterized by the 1/2 XRD spots. Beyond the boundary, the double hysteresis behavior in the P-E loops is well developed due to the electric-field-induced structural transformation from a paraelectric orthorhombic phase to the polar rhombohedral phase.Reference Kan, Pálová, Anbusathaiah, Cheng, Fujino, Nagarajan, Rabe and Takeuchi29 Since the electric field required for the occurrence of the field structural transformation event increases with increasing the Sm substitution,Reference Kan, Pálová, Anbusathaiah, Cheng, Fujino, Nagarajan, Rabe and Takeuchi29 the double hysteresis behavior is less pronounced, and the loops become the characteristic of paraelectric behavior for the orthorhombic phase in the composition region away from the MPB.
Summary of the intimate links between the structural and ferroelectric properties of cosubstituted BFO.

VII. CONCLUDING REMARKS AND FUTURE PERSPECTIVES
In conclusion, we reviewed our combinatorial search and investigations of the MPBs in chemically substituted BFO thin films by using the pseudobinary thin-film composition spread technique. We discovered that RE-substituted BFO has a MPB behavior with substantially enhanced properties. It was also found that at the boundary, the rhombohedral phase undergoes a structural transition to the orthorhombic phase, which exhibits the double hysteresis behavior. The discovered MPB behavior can be described as a function of the average A-site ionic radius as a universal parameter. We also extended our combinatorial investigations into A-site and B-site cosubstituted BFO by fabricating pseudoternary libraries. The cluster analysis of the ternary library finds the intimate links between the structural and ferroelectric properties of cosubstituted BFO and confirms that these properties have a strong dependence on the A-site substitution, while the B-site substitution has less influence on the properties. We have shown that an integrated approach, which combines synthesis of combinatorial libraries, rapid characterization of various properties, and cluster analysis of all the data pooled together, can be used to quickly obtain a comprehensive picture of the composition–structure–property relationship near structural boundaries.
It is desirable to fabricate and investigate the thin-film compositions studied here in ceramic forms to see how the structural evolution and the concomitant property change manifest themselves in bulk materials. To reap the full benefit of the enhanced properties at MPB in the substituted BFO, bulk samples need to be synthesized. Recent investigations of RE-substituted BFO ceramicsReference Karimi, Reaney, Han, Pokorny and Sterianou23, Reference Troyanchuk, Karpinsky, Bushinsky, Mantytskaya, Tereshko and Shut26 have revealed a similar overall trend in substitution-induced structural phase evolution: with increasing substitution, the rhombohedral BFO first undergoes a structural transition into an antipolar structural phase, followed by another transition to an orthorhombic phase. One significant difference between the ceramics and thin-film cases is the way in which the antipolar structural phase appears: for the ceramics case, it appears as a single or majority phase, while for the thin-film specimens, the AFE 1/4 structural phase is seen as a minority phase embedded in the R3c rhombohedral matrix. Although the origin of the difference remains unclear at this point, our experimental results (see Sec. V) imply that this difference may explain why the thin-film samples studied here have good enough insulation to allow full characterization of their functional properties as compared to the ceramic samples, where poor insulation has been an issue to be overcome. Preliminary leakage reduction behavior seen with Ti dopingReference Kalantari, Sterianou, Karimi, Ferrarelli, Miao, Sinclair and Reaney24 is promising, and perhaps, further substitutional investigation will reveal additional pathways toward eliminating the leakage issue of bulk BFO altogether. These are some of the key points of future investigation of chemically modified BFO.
ACKNOWLEDGMENTS
We would like to acknowledge the work of S. Fujino and R. Suchoski (University of Maryland) for film fabrications and P-E loop measurements; V. Anbusathaiah, C.J. Cheng, and V. Nagarajan (University of South Wales) for PFM and TEM studies; A.Y. Borisevich (Oak Ridge National Labs) for TEM observations; S.B. Emery, B.O. Wells, and S.P. Alpay (University of Connecticut) for synchrotron XRD measurements; and L. Palova and K.M. Rabe (Rutgers University) for first-principles calculations. This work was supported by NSF-MRSEC at the University of Maryland, DMR 05-20471. This work was also supported by ARO MURI W911NF-07-1-0410 and the W.M. Keck Foundation.