I. INTRODUCTION
Orthorhombic B52 boron phases have been theoretically predicted to be more stable than B50–B52 phases with the structure of α-tetragonal (α-t) boron. Reference Hayami and Otani1,Reference Zhu, Oganov, Glass and Stokes2 Idealized crystal structure of α-t boron, space group P42/nnm, consists of 50 atoms: four B12 icosahedra per unit cell connected to each other by direct B–B bonds and through two interstitial atoms at 2b sites. Reference Hoard, Hughes and Sands3 The structure predicted of orthorhombic boron B52 Reference Hayami and Otani1 results from the distortion of this structure, when two extra boron atoms are added to 4c position of B50, taking half of it (1/2, 0, 0; 0, 1/2, 1/2) so, that tetragonal lattice loses its 4-fold symmetry and becomes orthorhombic. It was shown that orthorhombic B52 has cohesive energy per atom similar to that of α- and β-rhombohedral boron, if the calculations of them are performed in the same way. Reference Hayami and Otani1 Surprisingly, orthorhombic boron B52 has never been obtained in experiment, while the synthesis of α-t boron B50 was reported in the number of papers. Reference Hoard, Hughes and Sands3–Reference Kurakevych, Godec, Hammouda and Goujon8 Soon after the discovery of α-t boron, Reference Hoard, Hughes and Sands3 its structure was shown to be unstable because of the electron deficiency. Reference Longuet-Higgins and Roberts9 It was demonstrated eventually, that B50C2 (a = 8.753, c = 5.093 Å) and B50N2 (a = 8.634, c = 5.128 Å) boron-rich compounds Reference Will and Ploog10 crystallize in the structure of α-t boron instead of pure boron. In these compounds, carbon and nitrogen occupy 2b sites in tetragonal unit cell, stabilizing the structure. So, the presence of carbon or nitrogen impurities in the growth systems could account for the formation of α-t boron phases rather than orthorhombic B52. Recent high pressure–high temperature investigations of phase transformations in systems of B–H, Reference Ekimov and Zibrov5,Reference Ekimov, Zibrov and Zoteev11 B–C, Reference Dubrovinskaia, Wirth, Wosnitza, Papageorgiou, Braun, Miyajima and Dubrovinsky12 B–C–H, Reference Ekimov, Lebed, Lyapin and Borovikov13 B–N, Reference Solozhenko and Kurakevych14 and B Reference Qin, Irifune, Dekura, Ohfuji, Nishiyama, Lei and Shinmei6–Reference Kurakevych, Godec, Hammouda and Goujon8 showed that the structure of α-t boron is stabilized at high pressures. Pure α-t boron was claimed to be obtained at high pressures by recrystallization of β-rhombohedral boron, Reference Qin, Irifune, Dekura, Ohfuji, Nishiyama, Lei and Shinmei6,Reference Parakhonskiy, Dubrovinskaia, Bykova, Wirth and Dubrovinsky7 crystallization of amorphous boron, Reference Kurakevych, Godec, Hammouda and Goujon8 and even by pyrolysis of decaborane. Reference Ekimov and Zibrov5 Since the volumes of unit cell of tetragonal phases, obtained by recrystallization of β-rhombohedral boron [384.8 Å3 (Ref. Reference Qin, Irifune, Dekura, Ohfuji, Nishiyama, Lei and Shinmei6) and 379.3 Å3 (Ref. Reference Parakhonskiy, Dubrovinskaia, Bykova, Wirth and Dubrovinsky7)], are smaller than the volumes of boron-carbon tetragonal B50C2 phases [387–390 Å (Refs. Reference Will and Ploog10 and Reference Latrigue and Male15)] and the volumes of calculated structures of tetragonal B50 [389 Å3 (Ref. Reference Hayami and Otani16)] and B52 [394 Å3 (Ref. Reference Hayami and Otani1)], the presence of carbon and nitrogen impurities in these high-pressure phases (Refs. Reference Qin, Irifune, Dekura, Ohfuji, Nishiyama, Lei and Shinmei6 and Reference Parakhonskiy, Dubrovinskaia, Bykova, Wirth and Dubrovinsky7) cannot be completely excluded. Note that substitution of boron in 2b position of α-t boron by carbon and nitrogen leads to the shrinkage of the structure. Reference Will and Ploog10,Reference Latrigue and Male15 But, the unit cell volumes of tetragonal phases, obtained upon decomposition of decaborane B10H14 [420 Å3 (Ref. Reference Ekimov and Zibrov5)] and crystallization of amorphous boron [404.3 Å3 (Ref. Reference Kurakevych, Godec, Hammouda and Goujon8)], are larger than those of tetragonal boron-rich compounds as well as calculated of B50 and B52 structures. We can suppose that additional chemical elements, apart from carbon and nitrogen, may be incorporated into these structures causing the lattice expansion. In the case of α-t boron, produced by decomposition of decaborane, this element could be hydrogen. Interestingly that structure analysis, based on a recently established theory of pure α-t boron, Reference Uemura, Shirai, Eckert and Kunstmann17 suggested that α-t boron obtained from amorphous boron Reference Kurakevych, Godec, Hammouda and Goujon8 may be the pure form, while the samples produced from decaborane Reference Ekimov and Zibrov5 are not. The possibility of intake of hydrogen into crystalline boron structure was theoretically predicted by Dekura, Reference Dekura, Shirai and Yanase18 whereas no experimental confirmation of this is known up to date. At the same time, the hydrogen content in amorphous boron can be up to 2 mass%. Reference Wang, Orimo, Tanabe and Fujii19 Hydrogen atoms, if present in the structure of tetragonal boron, can be easily removed by heating at ambient pressure. Reference Wang, Orimo, Tanabe and Fujii19,Reference Kodama, Oyaidzu, Sasaki, Kimura, Morimoto, Oya, Matsuyama, Sagara, Noda and Okuno20 In accordance with Ostwald's rule of stages, we can expect the formation of orthorhombic boron B52 upon dehydrogenation as an intermediate phase in the stability region of α- or β-rhombohedral boron. Orthorhombic boron B52 was predicted to possess very low band gap energy of 0.07 eV Reference Hayami and Otani1 or even transit to metallic state. Reference Zhu, Oganov, Glass and Stokes2 Thus, the synthesis of orthorhombic boron polymorph would open up new possibilities in practical use of elemental boron.
In this study, temperature-induced structure evolution and hydrogen desorption combined with thermal analysis of α-t boron, produced by high-pressure decomposition of decaborane, were investigated during normal-pressure annealing.
II. EXPERIMENT
Microcrystalline powder of α-t boron with lattice parameters a = 9.053 Å and c = 5.130 Å, used as the starting material, was synthesized by pyrolysis of decaborane B10H14 at pressures of 8–9 GPa and temperatures about 1600 K. Reference Ekimov and Zibrov5,Reference Ekimov, Zibrov and Zoteev11 Characteristic crystal sizes of the powder were within the range of 1–10 μm. According to the manufacturer, overall amount of C, O, N impurities in decaborane (AVIABOR, Dzerzhinsk, Russia) did not exceed tens of ppm. Total impurity content of C, N, O and metals in α-t boron powder, synthesized in the tantalum capsule, was less than 0.1 mass%. Reference Ekimov and Zibrov5
The phase transformations in α-t boron were studied in the atmosphere of pure argon (99.997%) at normal pressure using NETZSCH simultaneous thermal analyzer STA 409 PC Luxx (NETZSCH Group, Selb, Germany) coupled with a quadrupole mass spectrometer QMS 403С Aëolos (NETZSCH Group). The sample temperature was increased up to 1170 K with a heating rate of 10 K min−1. All emitted gases and vapors were transported from the sample area to the ion source of the mass spectrometer for analysis.
X-ray phase analysis of samples was carried out on RA Rigaku Ultima IV diffractomer (Rigaku Corporation, Tokyo, Japan), Cu Kα radiation. Powder diffraction data for the Rietveld analysis were collected on STOE STADI MP diffractometer (STOE and Cie GmbH, Darmstadt, Germany; Cu Kα1 radiation) with curved Ge-monochromator and linear PSD detector, in transmission mode, at 2θ step 0.01°. For ab initio structure determination, Rietveld refinement and presentation of the programs EXPO2014, Reference Altomare, Cuocci, Giacovazzo, Moliterni, Rizzi, Corriero and Falcicchio21 Fullprof, Reference Rodríguez-Carvajal22 and WinPLOTR Reference Roisnel and Rodriguez-Carvajal23 were used. Peak shapes were fitted by the function of Pseudo-Voigt. For the search of symmetry relations between the boron phases we used the programs WYCKSPLIT, Reference Kroumova, Perez-Mato and Aroyo24 COMPSTRU, SETSTRU from the Bilbao crystallographic server. Reference Aroyo, Perez-Mato, Orobengoa, Tasci, de la Flor and Kirov25
Possible changes in the structure of recovered samples were investigated by Micro-Raman spectroscopy. Raman scattering was excited at 300 K with a 633 nm He–Ne laser line and detected with a LabRam HR–800 spectrometer (HORIBA Scientific, Longjumeau, France). Using 50× or 100× objectives, a laser beam was focused to a 3–5 µm spot on the surface of a crystal analyzed. The laser power was maintained at about 5 mW.
The microstructure and elemental composition of the samples was investigated with JEOL JSM 6390LV scanning electron microscope (JEOL Ltd., Tokyo, Japan) equipped with energy dispersive x-ray microanalysis system (EDX).
III. RESULTS AND DISCUSSION
A. The thermal behavior of α-t boron, synthesized by high-pressure pyrolysis of decaborane, at normal pressure
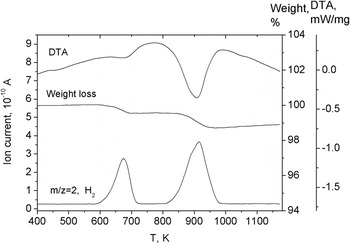
Powder samples of α-t boron were annealed in dynamic regime up to 770, 1020, and 1170 K in the flow of argon. In experiments, the weight loss, thermal effects, and gas emission from the samples were detected simultaneously. In the mass spectra of emitted gases, only the peaks with m/z equal to 2 and 18, corresponding to [H2] and [H2O] ions, were detected during the sample heating. Appearance of water vapor in analyzed gas is caused by the reaction of emitted hydrogen with residual oxygen. The presence of residual oxygen in the analyzer leads also to partial oxidation of boron samples, which is the most pronounced at the temperatures above 900 K (Fig. 1). In accordance to EDX microanalysis, oxidation of boron takes place mainly at the surface of powdered samples. The concentration of oxygen, measured in microcrystals taken from the bulk of recovered samples did not exceed 0.3 mass%. In accordance with thermal spectra of hydrogen emission from α-t boron samples (Fig. 1), the hydrogen release takes place within two separated temperature ranges: 600–720 and 820–970 K. The hydrogen release is accompanied with heat absorption and sample weight loss of 0.5 and 0.8 mass% respectively at the temperatures about 670 and 920 K.
Weight loss, thermal effects, and dehydrogenation of α-t boron.

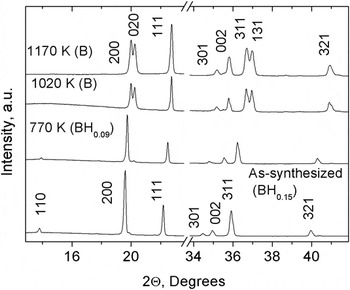
X-ray phase analysis of the samples annealed at temperatures up to 770, 1020, and 1170 K enables us to retrace phase and structural transformations in α-t boron after each hydrogen effusion (Fig. 2). Effusion of hydrogen from α-t boron in lower temperature range, 600–720 K, is accompanied with decrease of lattice parameters of tetragonal unit cell. The unit cell parameters of initial α-t boron are a = 9.053 Å, c = 5.130 Å, while after annealing they become equal to a = 8.999 Å and c = 5.051 Å. Hydrogen release at elevated temperatures, 820–970 K, ends with transformation into orthorhombic structure, whose lattice parameters are a = 8.894 Å, b = 8.784 Å, and c = 5.019 Å. The final stage of heating up to 1170 K does not change the orthorhombic structure of boron.
Phase transformations of α-t boron in the course of heating in argon atmosphere.

Repeated heating of the sample from room temperature to 1170 K did not result in hydrogen effusion from boron, or changes in the orthorhombic structure. According to x-ray diffraction analysis, the samples annealed at different temperatures, as well as the starting samples were single phase crystalline materials. The products of boron oxidation were either in amorphous form, or their concentration in the samples was under detection limit by x-ray phase analysis. Interestingly, the diffraction lines of boron phases after phase transformations were as narrow as those of starting α-t boron phase. It means that the newly formed phases are well crystallized with crystallite size exceeding 100 nm. The point is that formation of such crystallites in solid state requires atomic diffusion, which is very slow for boron at the temperatures of the phase transformations (680 and 920 K). Therefore, the most probable mechanism of phase transformations is very short collective displacements of boron atoms upon hydrogen effusion.
The release of hydrogen in two stages indicates its presence in the starting α-t boron phase in two different chemical states. Somewhat similar situation with hydrogen release was observed for hydrogenated films of amorphous boron. Reference Wang, Orimo, Tanabe and Fujii19,Reference Kodama, Oyaidzu, Sasaki, Kimura, Morimoto, Oya, Matsuyama, Sagara, Noda and Okuno20,Reference Annen, Beckmann and Jacob26 Two overlapped peaks of hydrogen release on thermal desorption spectra from hydrogenated amorphous boron films were detected at temperatures of about 580 and 800 K. Reference Annen, Beckmann and Jacob26 Hydrogen was supposed to be bound to boron with B–H–B (bridge) and B–H (terminal) bonds. In reality, however, the nature of hydrogen incorporation into the structure of amorphous boron is more complicated. For instance, effusion peaks in thermal emission spectra for hydrogenated amorphous boron film were detected by Kodama Reference Kodama, Oyaidzu, Sasaki, Kimura, Morimoto, Oya, Matsuyama, Sagara, Noda and Okuno20 at other temperatures, about 450 and 750 K. In other work by Wang, Reference Wang, Orimo, Tanabe and Fujii19 the spectrum of hydrogen release by amorphous boron, mechanically milled in hydrogen atmosphere, included three peaks, tentatively assigned to the release of quasifree hydrogen at about 300–400 K, terminal and bridging hydrogen at the temperatures around 500 and 720 K. In our case, two peaks in the spectrum of hydrogen release have specific positions at 680 and 920 K and clearly separated from each other. The samples of initial tetragonal boron and annealed samples were investigated with the use of Raman and IR absorption spectroscopy. Surprisingly, Raman spectra of initial α-t boron, Reference Ekimov and Zibrov5 as well as of boron phases after annealing were almost the same, while IR spectroscopy showed some modifications in spectra of annealed samples. The lines characteristic of В–Н–В (1700–2000 cm−1), В–Н (2550–2650 cm−1) bonds of decaborane, as well as H2 vibron (4200 cm−1) Reference Wang, Mao and Autrey27 were not detected in Raman spectra of all the samples studied. In IR absorption spectra, the presence of a very weak feature at 2500 cm−1 can be found in spectrum of initial tetragonal boron only as a sign of terminating hydrogen. Since mass spectrometry certainly detected hydrogen release from tetragonal boron phases, we suppose that concentration of hydrogen in a specific chemical state of 0.5–0.8 mass% is critical for its detection by Raman or IR spectroscopy. Thus, we report here the first experimental evidence on hydrogen intake into crystalline boron under high pressure. Consequently, α-t boron phase, obtained by high-pressure decomposition of decaborane, can be considered as a boron-rich hydride with composition close to B51.5H7.7.
Taking into account published data on removing hydrogen from hydrogenated amorphous boron, Reference Wang, Orimo, Tanabe and Fujii19,Reference Kodama, Oyaidzu, Sasaki, Kimura, Morimoto, Oya, Matsuyama, Sagara, Noda and Okuno20,Reference Annen, Beckmann and Jacob26 as well as our data obtained we concluded that α-t boron loses hydrogen almost completely at temperatures above 1000 K.
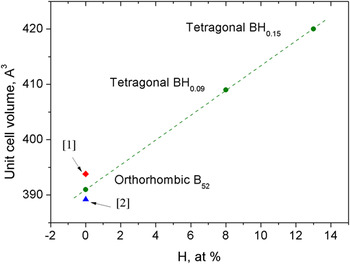
In Fig. 3 we present the unit cell volume of tetragonal and orthorhombic boron structures obtained in our work, as well as predicted by Hayami Reference Hayami and Otani1 and Zhu Reference Zhu, Oganov, Glass and Stokes2 as a function of hydrogen content. Hydrogen concentrations in tetragonal boron phases were calculated on the basis of mass losses derived from TG curve in Fig. 1. It is seen that the unit cell volume of experimentally obtained orthorhombic phase of B52 type agrees with predicted values.
Unit cell volume depending on the hydrogen content (calculated on the weight loss). Green circles—our experiments. Blue triangle—from Ref. Reference Zhu, Oganov, Glass and Stokes2. Red diamond—from Ref. Reference Hayami and Otani1.

B. Crystal structure refinement for orthorhombic boron
The structure of orthorhombic boron phase, obtained by dehydrogenation of α-t boron at a temperature of 1020–1170 K in argon atmosphere, was studied by the Rietveld analysis of powder x-ray diffraction data.
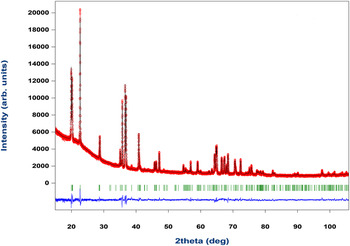
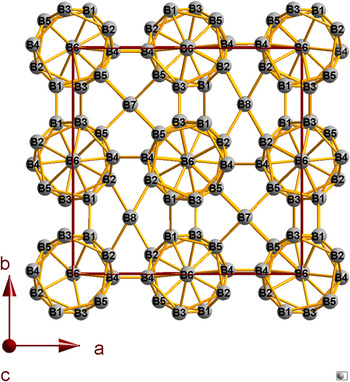
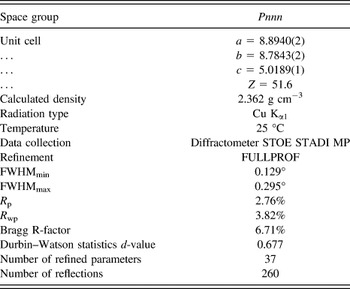
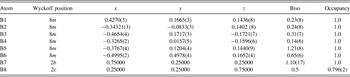
The starting model for the structure refinement can be obtained by two different ways: First, the program EXPO2014 Reference Altomare, Cuocci, Giacovazzo, Moliterni, Rizzi, Corriero and Falcicchio21 was used for ab initio structure determination. Diffraction pattern was indexed on an orthorhombic cell with N-TREOR algorithm included into EXPO (a = 8.894 Å b = 8.784 Å, c = 5.019 Å, Pnnn (№48)) and 260 reflection intensities were extracted. Structure solution by direct methods within EXPO2014 produced 8 atoms in an asymmetric unit: six atoms in 8m positions, one atom in 2c position and one atom in 2b position. This model was refined using both EXPO (R p = 3.871%, R wp = 5.62%, with occupancy of all positions equal to 100%) and FULLPROF Reference Rodríguez-Carvajal22 programs. The results of the Rietveld refinement by FULLPROF are presented in Figs. 4 and 5, the atom coordinates, cell parameters, and agreement factors are given in Tables I and II.
Measured and calculated XRD patterns for orthorhombic boron and their difference. Vertical ticks mark positions of Bragg reflections.

A unit cell of the orthorhombic boron B52 as seen from the direction of the c-axis. B7 and B8 atoms occupy 2b and 2c Wyckoff positions respectively.

The results of data refinement for orthorhombic boron.

Refined relative atomic coordinates, Biso (Isotropic displacement temperature parameter in Å2) and cite occupancies for orthorhombic boron.

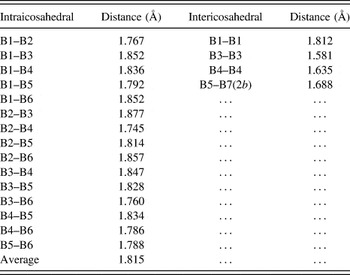
An average bond length within boron icosahedra is 1.815 Å (see Table III), which is close to that of α-t boron in our previous work (1.811 Å). Reference Ekimov and Zibrov5 It appears that the structure transformation, taking place upon hydrogen release from α-t boron, does not affect much the structure of icosahedra.
Interatomic distances within and between icosahedra.

In the work by Hayami, Reference Hayami and Otani1 the structure of orthorhombic boron is derived from tetragonal phase by distortion of tetragonal cell at the group-subgroup transformation from P42/nnm (no. 134) to Pnnn (no. 8). Pnnn (no. 48) is a maximal nonisomorphic subgroup of P42/nnm (no. 134). Wyckoff position 4c of tetragonal boron, P42/nm, is split into two positions: 2a and 2c of Pnnn subgroup. The most stable structure occurs, when 2c position of orthorhombic cell is occupied by 2 boron atoms, while 2a cite remains vacant.
Based on this assumption, we constructed the second starting model for the Rietveld refinement by group-subgroup symmetry transformation from P42/nnm (no. 134) to Pnnn (no. 48) (using WYCKSPLIT program on the Bilbao Crystallographic server Reference Kroumova, Perez-Mato and Aroyo24 ). Atomic coordinates of tetragonal boron (B1–B5 atom positions, P42/nnm spacegroup) were taken from our previous work Reference Ekimov and Zibrov5 ; 4g position was not considered. As the result of splitting, two 16m positions of P42/nnm give rise to four 8m of Pnnn, two 8m positions of tetragonal P42/nnm produce two 8m of Pnnn, 2b position turns into 2b, and 4c of tetragonal boron is split into 2a and 2c positions of Pnnn. At this stage, we have excluded 2a position from our model, as discussed above. The resulting model was refined using FULLPROF. Reference Rodríguez-Carvajal22 Both models, one resulting from the symmetry transformation and the other obtained by ab initio calculations, converge to the same general structure, presented in Tables I, II and Fig. 5 (refined atomic coordinates obtained from the two models agree to within the error). So, orthorhombic boron structure can be regarded as a distorted structure of tetragonal boron, the maximal displacement of boron atoms during the phase transformation being less than 0.15 Å. There is a question about the boron content in orthorhombic cell. The number of boron atoms in the elementary cell of α-t boron was 51.5 according to Reference Ekimov and Zibrov5 : 48 atoms belong to B12 icosahedra, 2 atoms take 2b position, while the rest occupied, mainly, 4c position. Under the assumption that there is no diffusion mobility of boron atoms in the samples at 1170 K (the melting temperature of boron is ∼2500 K Reference Brazhkin, Taniguichi, Akaishi and Popova28 ) the cell content must retain after the phase transition. The predicted number of atoms in orthorhombic boron was 52. Reference Hayami and Otani1 In present work occupancy of B1–B7 atoms (see Table II) is 100%, that is 50 atoms in all positions aside from 2c. Refined occupancy of 2c position (B8 in Table II) is about 80% (1.6 atoms) with R-factors shown in Table I, including Bragg R-factor = 6.71%. If we fix occupancy of 2c position at 100% level during the Rietveld refinement, (52 atoms per cell) we get approximately the same R-factors, except Bragg R-factor = 6.95% (it shows slightly better fit of the data for the model with 1.6 atoms in 2c). Still, based on the Rietveld refinement of powder diffraction data, it is rather difficult to decide between 51.6 and 52 atoms per cell. In Tables I and II we presented the data corresponding to 51.6 atoms pert cell, with the sample density 2.362 g cm−3.
C. Theoretical consideration of phase transition to orthorhombic structure
The structure of hydrogenated α-t boron and the process of dehydrogenation have been theoretically studied by density-functional theory (DFT) calculation. Details of the calculations method are the same as in (Ref. Reference Uemura, Shirai, Eckert and Kunstmann17). Using the primitive unit cell, our calculations show that the structure of as-synthesized hydrogenated α-t boron is approximately B51H7 with five H atoms at 8j site and two H atoms at 4g site of P42/nnm space group. Interestingly that these sites are not characteristic for occupation with boron atoms. Since a pair of H atoms at 8j sites has the center of mass at 4c site, the most stable site of boron in α-t boron structure, there appears possibility for alternative occupation of 4c site with pair of hydrogen atoms. Though the structure of pure α-t boron with boron atoms at 4g site is unstable, Reference Uemura, Shirai, Eckert and Kunstmann17 filling this site with hydrogen, on the contrary, enhances stability of the structure.
By calculating the formation energy for various compositions of B51Hm, we suggested the most plausible scenario for the dehydrogenation of as-synthesized α-t boron at normal pressure. According to these calculations, the hydrogen evolution at 680 K involves hydrogen atoms located at two 8j and two 4g sites, resulting in the formation of a metastable phase B51H3, where three H atoms remain at 8j sites. Finally, these three H atoms leave the structure at higher temperatures of 920 K. Full explanation of the phase and structural transformations will be given elsewhere.
The most interesting question is how the structure of as-synthesized α-t boron transforms into orthorhombic upon complete dehydrogenation. By comparing the atom positions in the orthorhombic cell with corresponding positions in the hydrogenated α-t boron cell, Reference Ekimov and Zibrov5 we confirm, that all B atoms essentially do not move in the process of the transformation. The difference in the lattice parameters a and b of the orthorhombic phase is 1.2% (hereafter we call this difference the orthorhombic distortion), which agrees well with the orthorhombic distortion of B52 phases calculated by Hayami Reference Hayami and Otani1 and Zhu. Reference Zhu, Oganov, Glass and Stokes2 For the most stable B52 structure reported by Hayami, Reference Hayami and Otani1 the orthorhombic distortion is 2.9%, while in the orthorhombic B52 phase predicted by Zhu Reference Zhu, Oganov, Glass and Stokes2 by evolutionary algorithm calculations, the difference of a and b lattice parameters is of 1% only.
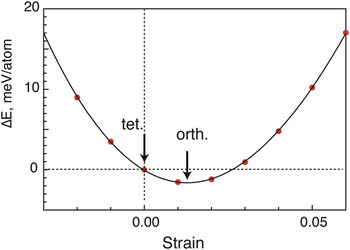
To analyze the tetragonal-to-orthorhombic transformation upon dehydrogenation, the adiabatic path between these two structures was retraced. Starting from the staggered structure configuration of pure α-t B52 with two boron atoms at 4c sites with coordinates (1/4, 1/4, 3/4) and (3/4, 1/4, 1/4) (P42/nnm space group, origin choice 2), an adiabatic potential was calculated toward the orthorhombic structure with the same atomic arrangement. Let L 0 = (a 0, b 0, c 0) be the lattice parameter of the tetragonal lattice, then L 1 = (a 1, b 1, c 1) is that of the orthorhombic lattice. In the direction δL = L 1 − L 0, we deformed the lattice by changing strain ε (the diagonal components of strain tensor, ε = ε δL/|δL|) and calculated the total energy as a function of ε. For each value of strains, the atomic positions were optimized; the calculated adiabatic curve is shown in Fig. 6. We found that the orthorhombic B52 with orthorhombic distortion of 1.8% is the lowest-energy structure with energy of only 2 meV per atom smaller than of pure α-t B52; there is no energy barrier toward the orthorhombic phase (see Fig. 6). This means that the pure α-t phase B52 spontaneously transforms into the orthorhombic form. A similar relation was found between a pure tetragonal B51 with occupation of a B atom at a 4c site and the corresponding orthorhombic structure.
Adiabatic curve connecting pure α-t B52 and orthorhombic B52. The change in energy ∆E is plotted as a function of strain ε.

Thus, consistency of experimental results with theoretical DFT calculations supports the idea that pure α-t boron B52 is stable in the form of orthorhombic structure. It remains unclear however, why the staggered configuration of two boron atoms at 4c sites appear in the hydrogenated parent α-t boron upon the high-pressure decaborane pyrolysis. Perhaps, the incomplete occupation of symmetry-equivalent sites is involved in the structure formation similar to that for boron carbide. Reference Shirai, Sakuma and Uemura29–Reference Ektrarawong, Simak, Hultman, Birch and Alling31
IV. CONCLUSIONS
The structure of orthorhombic B51.5–52 boron represents an ingenious solution of long standing controversy on the synthesis and structure of pure α-t boron. Total energy of orthorhombic B52 was calculated to be smaller than that of α-t B50 phase, which makes its synthesis more feasible. Here, we report for the first time on preparation of orthorhombic boron phase with composition close to B51.5–52, space group Pnnn, a = 8.8940(2) Å, b = 8.7843(2) Å, c = 5.0189(1) Å, by normal-pressure dehydrogenation of α-t boron synthesized at high pressures in B–H system.
ACKNOWLEDGMENT
This work was supported by the Russian Foundation for Basic Research, Projects 15-02-05603.