Nomenclature and Abbreviation
-
 ${L_0}$
-
length of the conical flow field
-
$\beta $
-
shock wave angle of the conical flow field
-
${\delta _i}$
-
cone surface angle
-
$\varphi $
-
Deflection angle relative to the x-axis
- ICC
-
inlet capture curve
-
${L_s}$
-
length of the middle straight line section of ICC
-
${H_s}$
-
height of the middle straight line section of ICC
- θ
-
offset angle of the wing extension lines
- L
-
length of the wing extension lines
- VDNN-TL
-
variable-fidelity deep neural network surrogate model based on transfer learning
- NSGA-III
-
non-dominated sorting genetic algorithm III
- SOM
-
self-organising map
- FCT
-
front capture tube


1.0 Introduction
The waverider demonstrates significant aerodynamic advantages at high-speed flight [Reference Wang, Ding and Lei1]. The airbreathing waverider is a new and efficient aircraft design based on the traditional waverider. It utilises the interaction between shock waves and airflow during flight to significantly improve the lift and propulsion efficiency of the vehicle, which has led to widespread attention in the design of supersonic and hypersonic vehicles [Reference Erdem and Kontis2–Reference Gnani, Zare-Behtash and White10].
The typical layout of the airbreathing waverider involves placing the scramjet engine beneath the fuselage. The forebody not only provides favourable waverider characteristics but also serves as the pre-compression surface of the inlet, supplying high-pressure airflow to the engine [Reference Leng, Wang and Huang11]. This arrangement balances the aerodynamic shape of the vehicle with the inlet performance of the engine, but it also introduces severe internal-external flow coupling issues. Particularly under varying operating conditions, changes in the compression level of the forebody can affect the inlet airflow, leading to instability in the engine performance. Therefore, balancing the lift-to-drag ratio, aerodynamic efficiency and the total pressure recovery coefficient of the inlet is an important and challenging issue.
Many scholars have conducted research on the design of airbreathing waveriders. In terms of design methodology, airbreathing waveriders can generally be categorised into two types, namely one where the waverider functions only as the forebody to provide a compressed flow field for the inlet, and the other where a full waverider design is employed to achieve better overall aerodynamic performance. Currently, the research focus is on the more challenging full waverider design. The full waverider theory can date back to 1993, when O’Neill and Lewis [Reference O’Neill and Lewis12] proposed an innovative airbreathing hypersonic full waverider aerodynamic layout design and optimised the aerodynamic parameters. In this approach, the researchers first performed a flow field tracking analysis of the entire vehicle’s leading-edge curve and the inlet lip’s leading edge based on the axisymmetric conical flow field, thereby determining the waverider compression surface and the inlet shape of the vehicle. By defining the shapes of the inlet and nozzle, they ultimately achieved an integrated aerodynamic layout design. Xiang et al. [Reference Xiang, Liu and Qian13] used a geometric fusion method, first designing a complete waverider and then embedding a dual inward-flared truncated Busemann inlet into the upper surface of the vehicle using geometric fusion. They designed an adaptive wide-speed-range integrated dual waverider, ensuring that the aerodynamic performance of the shape and the inlet performance do not interfere with each other. Ding et al. [Reference Ding, Liu, Shen and Huang14] proposed a design method for the full waverider of all body components based on the characteristic line method. The reference flow field uses a three-dimensional axisymmetric conical flow, with the section line equations of the axisymmetric generating body provided. The reference flow field is then solved, followed by streamline tracking and configuration design. Wang [Reference Wang15] also used the characteristic line method to design a wide-speed-range airbreathing waverider based on the osculating cone principle. The configuration was divided into components for specific design, using the characteristic line method to generate vortex lift while balancing aerodynamic performance under subsonic conditions. Zhang et al. [Reference Zhang, Yan and Huang16] proposed a cone-guided airbreathing waverider design method based on a fixed Mach number, setting the engine lip curve at the edge of the conical shock wave flow field. The inlet configuration was obtained through streamline tracking, and the correctness of the configuration was verified using computational fluid dynamics (CFD). The lift-to-drag ratio of the airbreathing waverider configuration was then optimised using free-form deformation (FFD).
From the current state of research, the design theory of airbreathing waveriders is relatively well-developed, with many new design methods emerging. However, research on the configuration optimisation of airbreathing waveriders is limited, especially in terms of aerodynamic optimisation that considers both internal and external flows. Furthermore, there is insufficient analysis of the key factors that influence their aerodynamic and inlet performance. Data mining techniques can assist in optimisation by helping clarify the relationship between the configuration and performance, as well as the aerodynamic performance of both internal and external flows.
Data mining can effectively analyse samples or data generated from optimisation, helping researchers clarify the relationships between design variables and disciplines, which aids in obtaining better results or acquiring knowledge generated during the optimisation process. Bandaru et al. [Reference Bandaru, Amos and Kalyanmoy17] conducted a comprehensive review of common data mining methods in multidisciplinary design optimisation, categorising them from different perspectives and revealing the characteristics and applicable scenarios of various data analysis techniques. Luo et al. [Reference Luo, Zhang and Mi18] successfully applied Kernel Principal Component Analysis (KPCA) to the multidisciplinary design optimisation of turbine disks. By reducing dimensions through KPCA, the structural representation, which originally required 38 parameters, was reduced to just seven KPCA coefficients, representing 91% of the structural information, significantly improving optimisation efficiency. Huang [Reference Huang19] studied the design space of 3D transverse jet optimisation and used Analysis of Variance (ANOVA) to explore the primary variables influencing the design. Cao et al. [Reference Cao, Tang and Zhu20] used the Shapley Additive Explanations (SHAP) interpreter to assess the importance of aerofoil control parameters. Based on the SHAP values of the variables, they categorised them into two groups, thus handling them separately during optimisation and improving efficiency. Shen et al. [Reference Shen, Huang and Yan21] improved the SHAP interpreter by mapping SHAP values onto the surface of the aircraft, revealing the impact of surface shape on performance and expanding the application scope of data mining tools. ISOMAP is a nonlinear dimensionality reduction technique and an extension of multidimensional scaling (MDS). Qiu [Reference Qiu22] used the ISOMAP method to study the feature space dimensionality reduction in 2D aerofoil aerodynamic design while satisfying geometric constraints to improve optimisation efficiency. Self-organising map (SOM) is a nonlinear projection algorithm for unsupervised learning [Reference Jeong and Shimoyama23], which reveals the inherent patterns of data through neural networks. Chiba et al. [Reference Chiba, Oyama and Obayashi24] applied SOM in the multidisciplinary design optimisation of transonic jet aircraft wings. By clustering optimisation results, they identified design variables that effectively improve the objective function and aerodynamic performance, as well as the key design feature of the reversed gull wing, proving that data mining techniques outperform traditional empirical methods in some aspects. Jeong et al. [Reference Jeong, Chiba and Obayashi25] used SOM to visualise multiple Pareto solution sets in the multidisciplinary design study of reusable rockets, helping designers understand the trade-offs between objective functions and ultimately make decisions.
This study first designs a novel wide-speed-range airbreathing waverider based on the osculating cone principle. To address the need for improved internal-external flow performance metrics of the airbreathing waverider, a new type of variable-fidelity surrogate model is employed to reduce data costs. By appropriately setting objectives and constraints, the integrated internal-external flow performance is enhanced. Additionally, data mining techniques are innovatively applied to the internal-external flow optimisation process of the airbreathing waverider, uncovering implicit information between variables and disciplines, thus generating design knowledge and accumulating experience for designers.
The structure of this paper is as follows: Section 2 introduces the principles of configuration design. Section 3 verifies the correctness of the configuration design. Section 4 focuses on the optimisation of the configuration, where Section 4.1 defines the optimisation tasks, Section 4.2 presents the optimisation results, and Section 4.3 analyses the optimisation results. Section 5 mainly discusses the reuse of intermediate data after the optimisation process, which forms optimisation knowledge and design experience. This helps us understand the mechanisms behind configuration changes, builds design experience and facilitates researchers in future design work. Section 6 summarises this paper.
2.0 Design method of wide-speed-range airbreathing waverider
The airbreathing waverider in this study is generated based on the osculating cone principle, consisting of the waverider forebody, waverider afterbody and the stretching body. The osculating cone theory was proposed by Sobieczhy et al. [Reference Sobieczhy and Dougherty26] and has since been continuously refined and developed [Reference Rodi27, Reference Chen, Deng and Guo28], and it is now relatively mature. Below, only the different parameterisation methods employed in this design are introduced. Figure 1 shows the parameters required for constructing the waverider forebody and the streamline tracing process from a side view. Figure 2 presents the parameters required for constructing the waverider aft body and elongated body using the osculating cone principle from a bottom view. The width of the waverider configuration is set based on the conical flow field. Figure 1(a) demonstrates the process of streamline tracing in the reference flow field, where point A is located at the waverider leading edge and point B is located at the trailing edge.
 ${L_0}$
is the length of the conical flow field, which is specified as
 ${L_0}$
=1m in this study.
 $\beta $
is the shock wave angle of the conical flow field, and
 ${\delta _i}$
is the cone surface angle. Therefore, the width of the flow field can be determined by the value of
 $\beta $
. Once the reference flow field is determined, the waverider configuration width can be determined by specifying the deflection angle
 $\varphi $
relative to the x-axis. Figure 1(b) shows a parametric diagram of the waverider bottom surface. The coordinates of edge point D can be expressed by the following equation.
 \begin{align} \left\{ \begin{array}{l}{x_s} = {L_0} \cdot \tan (\beta ) \cdot \cos (\varphi ) \\[3pt] {y_s} = {L_0} \cdot \tan (\beta ) \cdot \sin (\varphi )\end{array} \right. \end{align}
Schematic of osculating cone design principle.

Schematic of key curves on the bottom surface of the airbreathing waverider.

The upper edge line Front Capture Tube (FCT) of the waverider determines the configuration of the upper surface, and it is expressed using a B-spline curve of order 6. 7 control points are specified to control the B-spline curve. Since the upper edge line is symmetric about the x-axis, only 4 control points are actually needed, as shown in Fig. 2(b) at points
 ${n_1}$
,
 ${n_2}$
,
 ${n_3}$
and
 ${n_4}$
.
To ensure continuity in the middle part of the bottom of the waverider, a straight segment is added in the middle of the inlet capture curve (ICC), with a length of
 ${L_s}$
, and a distance of
 ${H_s}$
from the y-axis, satisfying the following relationship.
 \begin{align} \left\{ {\begin{array}{*{20}{c}}{{L_s} = p \cdot {y_s}} \\[3pt] {{H_s} = q \cdot {x_s}}\end{array}} \right. \end{align}
In the equation, p and q are design variables, representing the length and height ratio of the straight segment in the ICC, respectively. The remaining part of the ICC is represented by a quadratic curve, which is tangent to the straight segment. The curve expression is given by
 \begin{align} x = \frac{{{x_s} - {H_s}}}{{{{({y_s} - {L_s})}^2}}} \cdot {(y - {L_s})^2} + {H_s} \end{align}
For the conical flow field
 ${{\rm{O}}_i}$
, as shown in Fig. 1(b), this design specifies that all conical flow fields have the same shock angle
 $\beta $
, but different Mach numbers are assigned to achieve a wide-speed-range waverider design. According to the conclusion in Ref. (Reference Zhang29), a gradual increase in Mach number from the edge to the centre helps improve the volumetric efficiency and overall aerodynamic performance. Assuming the Mach number variation range for the mission is
 $\left[ {M{a_{\min }},M{a_{\max }}} \right]$
, the number of osculating conical flow fields on one side of the symmetry plane is
 $N$
+1. The Mach number corresponding to the conical flow fields
 ${{\rm{O}}_i}$
is set in an arithmetic progression.
 \begin{align} M{a_i} = M{a_{\min }} + \frac{i}{N}(M{a_{\max }} - M{a_{\min }}),{\rm{ }}i = 0, \cdots N. \end{align}
Based on the determination of the waverider forebody, the configuration of the waverider aftbody and the stretching body can be determined by specifying the angle θ and length L of the wing extension lines on both sides, as shown by the green line in Fig. 2. The blue line represents the edge line of the stretching body bottom surface, and the red line represents the ICC curve. It is worth mentioning that the points on the wing extension lines are assigned to the conical flow field labeled as
 ${{\rm{O}}_0}$
during the streamline tracing process, which corresponds to the outermost conical flow field.
In this study, the speed range of the wide-speed-range airbreathing waverider is set to Ma 8–10. With the above parametric design, an additional 10 design variables are needed to determine the configuration of the airbreathing waverider. Table 1 lists the design sections and the variation ranges corresponding to each variable. To present the waverider configuration obtained in this design, Fig. 3 shows the wide-speed-range airbreathing waverider configuration at Ma 8–10 conditions, where all variables are set to the median values to derive the wide-speed-range airbreathing waverider configuration, with three key components of the airbreathing waverider labeled: the waverider forebody, waverider aft body and elongated body, which, when assembled, form a waverider configuration with an inlet structure, and both the forebody and aft body of the configuration exhibit waverider characteristics, achieving full waveriding performance.
Design parameters and value ranges for the airbreathing waverider

Style of wide-speed-range airbreathing waverider.

3.0 Configuration validation through numerical computation
To validate the accuracy of the wide-speed-range airbreathing waverider design and compute its aerodynamic performance, numerical simulations were conducted on the configuration obtained by setting all the variables to their middle values in the previous section. The CFD computations in this study used three-dimensional coupled implicit Reynolds-averaged Navier–Stokes (RANS) equations, with the fluid modeled as a calorically perfect gas, and the dynamic viscosity determined using Sutherland’s law based on temperature. Based on the validation results from sample cases, the Realizable k-
 $\varepsilon $
turbulence model was selected, with the full y+ model used for wall treatment. The wall was set as adiabatic with a no-slip condition and free-stream boundary conditions were applied. The convective and diffusive fluxes were computed using the Monotonic Upstream-centered Scheme for Conservation Laws (MUSCL) third-order discretisation scheme, with the coupling flux discretised using the Advection Upstream Splitting Method (AUSM) scheme. The solver used the incomplete lower and upper (ILU) relaxation scheme for iterative correction.
3.1 Case study validation
The aerodynamic calculations of the airbreathing waverider involve both the external flow field and the engine internal flow field, and the accuracy of the numerical methods needs to be validated separately for each. For the high-speed external flow field case validation, we validated the same computational method on a hypersonic vehicle model in Ref. (Reference Leng, Feng and Huang30). The following specifically discusses the case study validation of the internal flow simulation.
Herrmann et al. [Reference Herrmann and Koschel31] measured the pressure distribution inside the high-speed inlet using ground-based wind tunnel experiments and used schlieren imaging to display the internal shockwave structure, providing a reference for validating the internal flow numerical computation. Based on the inlet configuration style and parameters from the wind tunnel experiments, a similar 2D configuration was created and meshed using an unstructured polyhedral grid. The resulting mesh is shown in Fig. 4. The mesh was refined near the wall, and prism layers were added. In the far-field, the mesh size was increased appropriately to reduce computational cost.
Schematic of 2d inlet polyhedral unstructured mesh.

Table 2 lists the parameter settings for the experimental conditions. The external flow case validation demonstrated the advantages and accuracy of the Realizable k-
 $\varepsilon $
turbulence model. This model is also used in the current case, with the first layer of the prism mesh set to be y
+=30. To validate mesh independence, three sets of meshes with different scales were used for comparison, with mesh counts of 13,697, 25,354, and 59,632. The pressure distributions on the upper and lower inlet walls for different mesh scales are shown in Fig. 5. The points in the figure represent experimental data, while the different lines correspond to results obtained using grids of varying sizes. Overall, the trends in the results from the three grids are consistent and align well with the trends exhibited by the experimental data, which confirms the validity of the computational method used in this study. In detail, there are some discrepancies between the results obtained from different computational methods. Specifically, the black and red dashed lines largely overlap, indicating that the results from the medium and fine grids show minimal differences. This suggests that the grid size used in the calculations meets the required resolution, and further increasing the grid density will not significantly alter the results. On the other hand, the results obtained using the coarse grid (blue dashed line) show noticeable deviations from the other two, and the fit with the experimental data is not as good. This indicates that the coarse grid has lower computational accuracy and fails to capture all the details of the flow field.
Experimental condition parameters for the inlet

Comparison of inlet wall pressure distributions at different grid scales.

3.2 Configuration correctness validation
A similar polyhedral type of unstructured mesh is used, as shown in Fig. 6. To balance computational accuracy and efficiency, the mesh is refined near the aircraft, while the far-field regions have an appropriately enlarged mesh size. The angle-of-attack is kept at 0°, and numerical simulations are conducted under conditions of H = 28km, Ma = 8 and H = 32km, Ma = 10. The pressure distribution contours on the aircraft’s bottom and symmetric plane are shown in Figs 7 and 8, respectively.
Computational mesh schematic.

Pressure distribution contour on the bottom surface of the waverider at different Mach numbers.

As shown in Fig. 7, under the conditions of Ma = 8 and Ma = 10, the shock wave is able to stay attached to the bottom surface of the airbreathing waverider, enveloping high-pressure gas, which causes the separation of high-pressure gas from the bottom surface and the top surface, thereby enhancing the lift of the waverider. However, at the edges, a gap exists between the shock wave and the bottom surface of the vehicle, leading to a small amount of high-pressure gas flowing from the bottom surface to the top surface. This phenomenon can be explained by three factors. First, the waverider was designed using inviscid flow equations, so when subjected to viscous flow conditions, the resulting airflow deviates from the ideal state. Second, the configuration in this design is based on the wide-speed-range condition, so to balance the overall performance across different Mach numbers, performance at specific speeds may be compromised. Third, the shock wave is assumed to be of zero thickness in the design, but in viscous numerical simulations, the shock wave has a certain thickness, which similarly introduces design errors. Additionally, the edge overflow at Ma = 8 is smaller than that at Ma = 10 because, in this wide-speed-range waverider design, the Mach number distribution of the osculating cone flow field increases gradually from the edge to the centre. Therefore, the edge of the configuration corresponds to the osculating cone flow field at Ma = 8, which results in smaller edge overflow under M = 8 conditions. Next, by observing the high-pressure airflow inside the inlet and within the shock wave on the bottom surface, it can be noted that the pressure corresponding to the same position varies. At Ma = 10, both the external flow field of the vehicle and the internal flow field of the inlet experience higher pressures, as the higher Mach number generates stronger shock waves, leading to more significant gas compression effects.
Figure 8 shows the pressure distribution on the symmetric plane of the vehicle, where the relative position of the shock wave generated by the waverider forebody and the inlet lip can be observed. In the ideal case, the shock wave should reach the inlet lip exactly, forming a shock closure and increasing the intake volume of the airbreathing engine. However, as shown in the figure, under both Mach number conditions, the shock wave shifts downward to varying degrees, creating a gap between the lip and the shock wave, resulting in a loss of intake, which is also caused by viscous effects and the wide-speed-range configuration design. Nevertheless, from the figure, it can be observed that the distance between the shock wave and the lip is not large, allowing most of the air captured by the waverider forebody to still enter the inlet, where multiple shock wave reflections occur, aiding in the compression of air and its thorough mixing with fuel. It is worth mentioning that this design did not strictly consider the internal configuration of the inlet but focused on the external shape of the wide-speed-range airbreathing waverider and the inlet entrance design. The internal design of the inlet will need to be completed later, based on the specific requirements of the airbreathing engine.
Pressure distribution contours on the symmetric plane of the waverider at different Mach numbers.

By analysing the pressure distribution around the waverider, it can be observed that under viscous conditions, there is only a slight overflow at the edges of the vehicle, and the deviation between the shock wave and the inlet lip is minimal, verifying the correctness of the design configuration presented in this paper.
4.0 Multidisciplinary design optimisation of airbreathing waverider
4.1 Optimisation problem
The lift-to-drag ratio and the inlet total pressure recovery coefficient are selected as the indicators for external and internal flow performance, respectively, and a multidisciplinary design optimisation of the configuration’s performance under two operating conditions is conducted, which can be expressed as follows.
 \begin{align} \left\{ \begin{array}{l} {\rm{find}} \, x \\[3pt]{{\textbf{min}} } {-L}/{D_{Ma \, 8}}, {-L}/{D}_{Ma{{\, 10}}}\\[3pt]{\rm{s}}{\rm{. t}} {\rm{. }} \;\;\;\;{x} \in \prod _{i =1}^{10}{{X}_i}\\[3pt]\qquad {\lambda _{Ma{\rm{\, }}8}} \ge 0.58\\[3pt]\qquad {\lambda _{Ma{\rm{\, }}10}} \ge 0.46\end{array} \right. \end{align}
Where
 $x$
represents the 10 configuration design variables, and
 ${{X}_i}$
represent the range of the design variables, as shown in Table 1.
 $\lambda $
represents the total pressure recovery coefficient, with the subscripts Ma = 8 and Ma = 10 referring to the conditions of H = 28 km, Ma = 8 and H = 32 km, Ma = 10, respectively.
For the calculation of the lift-to-drag ratio, this study excludes the base drag and internal drag of the inlet, focusing on the aerodynamic performance of the vehicle’s shape. The total pressure recovery coefficient is defined as the ratio of the local total pressure to the freestream total pressure, and it is calculated using the area integration method in this study.
 \begin{align} \lambda = \frac{{\int {{P_0}\rho udA} }}{{\int {{P_{0({\rm{inlet}})}}\rho udA} }} \end{align}
Where
 ${P_0}$
represents the total pressure,
 $\rho $
represents the gas density,
 $u$
represents the axial flow velocity inside the inlet and
 $A$
represents the cross-sectional area of the inlet at the corresponding calculation position.
4.2 Optimisation results
This study adopts a Variable-fidelity Deep neural network surrogate model based on transfer learning (VDNN-TL) [Reference Leng, Feng and Huang30] to reduce the modeling cost, with low-fidelity and high-fidelity data obtained from CFD calculations under inviscid and viscous conditions, respectively. The Latin Hypercube Sampling (LHS) method was used to extract 150 configurations as low-fidelity samples and 60 as high-fidelity samples. Each low-fidelity sample took approximately 5 minutes to compute, while each high-fidelity sample took about 20 minutes. The total time spent constructing the surrogate model in this study was approximately 32.5 hours.
Seventy per cent of the sample set was selected as the training set and 30% as the testing set to build the VDNN-TL surrogate model mapping 10 design variables to four performance parameters. Figure 9 shows the regression plots of the surrogate model’s prediction performance, with the correlation coefficients R2R^2R2 of the four performance parameters being 0.998, 0.997, 0.889 and 1.0, respectively. It can be observed that the surrogate model’s prediction of the lift-to-drag ratio under Ma = 8 conditions is slightly less accurate, while the prediction accuracy for the other performance parameters is very high. There are several possible reasons for this phenomenon, such as computational errors or uneven sampling points in the training and validation sets of the model. We further compare the samples in the test set for this performance parameter, as shown in Fig. 10. Although there are some discrepancies in the predictions for certain configurations, the deviations are small and the overall trend of the lift-to-drag ratio is accurately captured. Therefore, the accuracy of the surrogate model built in this study is sufficient to meet the optimisation requirements.
Regression plot of the surrogate model predictions for four performance metrics.

The Non-dominated Sorting Genetic Algorithm III (NSGA-III) multi-objective design optimisation algorithm is adopted. Compared to NSGA-II, NSGA-III improves adaptability to high-dimensional multi-objective optimisation problems by introducing reference points, enabling better distribution of solutions in high-dimensional objective spaces [Reference Deb and Himanshu32]. The population size of the algorithm is set to be 100, with a mutation probability of 0.1, a crossover probability of 1.0 and 30,000 generations of evolution. Due to the inherent errors in the evaluation of the surrogate model, the constraint requirements were appropriately increased during optimisation to ensure that the obtained configurations met the constraints. The total pressure recovery coefficient for Ma = 8 was adjusted from no less than 0.58 to no less than 0.59, and for Ma = 10, it was adjusted from no less than 0.46 to no less than 0.48 (since it was found during calculations that meeting the total pressure recovery coefficient under this condition was more difficult). The Pareto front distribution of the two objective functions after optimisation is shown in Fig. 11. From the distribution of solutions, it can be observed that the lift-to-drag ratio under Ma = 8 and Ma = 10 conditions has some degree of interdependence. However, the range of variation in performance metrics across the solution set is less than 0.01, suggesting that the lift-to-drag ratio performance under both conditions should be mutually reinforcing, with consistent trends. A blank region appears in the bottom-right corner of the solution set, primarily caused by the constraint on the total pressure recovery coefficient, which renders some solutions infeasible.
Parameter values for the optimised configuration

Comparison of surrogate model predictions and actual values on the test set.

Schematic of the pareto front distribution for optimisation objectives.

4.3 Results analysis
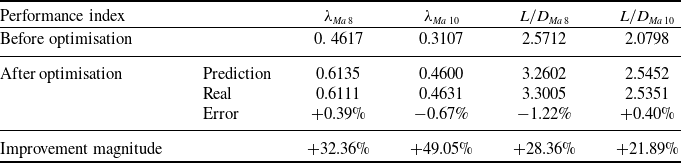
A configuration at the middle position of the Pareto solution set was selected for analysis and is marked in red in the figure. Table 3 lists the parameter values of this configuration. Compared to the parameter value ranges in Table 1, it can be observed that p takes the lower bound of the range, while q is close to the upper bound. The resulting airbreathing waverider configuration is shown in Fig. 12. Compared to the initial configuration in Fig. 3, it is evident that the overall length of the waverider has significantly increased, and the inlet cross-sectional area has notably enlarged. CFD calculations were performed on the configurations before and after optimisation to evaluate four performance indicators. The comparison with the surrogate model predictions is shown in Table 4. It is evident that the surrogate model has high prediction accuracy for
 ${\lambda _{Ma{\rm{ }}8}}$
,
 ${\lambda _{Ma{\rm{ 10}}}}$
and
 $ { {L/D}_{Ma{\rm{\, }}10}}$
of the optimised configuration, with evaluation errors less than 1%. The prediction error for
 $ { {L/D}_{Ma{\rm{\, }}8}}$
is slightly larger but remains within 2%, validating the accuracy of the surrogate model used in this study. At the same time, comparing the optimised configuration with the initial one, it was found that all four performance indicators improved by more than 20%, especially the total pressure recovery coefficient of the inlet, which increased by more than 30%. This is because the baseline configuration before optimisation was simply designed using the mean values of the design parameter ranges, which made it difficult to ensure good performance. Through optimisation, significant performance improvements were achieved, demonstrating the success of the optimisation process.
Optimised waverider configuration.

Figure 13 shows the pressure distribution contour of the symmetric plane for the optimised configuration. Compared to the pressure distribution contour of the original configuration in Fig. 8, it is evident that the number of shockwave reflections in the inlet is significantly reduced, from 4 in the initial configuration to 2. This reduction leads to a significant decrease in the total pressure loss in the inlet caused by the shock waves. The reduction in shock wave reflections can be attributed to two factors. First, the more slender structure of the optimised waverider reduces the angle of the incoming shock wave, which significantly increases the distance each shock wave travels during reflection. Second, the proportion of the inlet length relative to the fuselage length is significantly reduced, allowing the shock waves to exit after fewer reflections. Additionally, the shortening of the inlet reduces the total pressure loss due to friction within the inlet, thereby ensuring that the total pressure recovery coefficient meets the optimisation requirements.
Comparison of performance metrics before and after optimisation, and surrogate model prediction errors

Pressure distribution contours on the symmetric plane of the optimised configuration at different Mach numbers.

5.0 Data mining and analysis
The Pearson correlation coefficient is a statistical method used to measure the strength and direction of the linear relationship between two variables. Its value ranges from -1 to 1, where -1 indicates a perfect negative correlation, 1 indicates a perfect positive correlation, and 0 indicates no linear relationship. It quantifies this relationship by calculating the ratio of the covariance of the two variables to the product of their standard deviations. Based on the data from the optimisation sample set, the Pearson correlation coefficient is used to analyse the correlation between design variables and performance indicators, as shown in Fig. 14. Figure 14(a) shows the correlation coefficients. Positive values represent positive correlation, negative values represent negative correlation and the larger the absolute value, the stronger the correlation. It can be observed that the cone shock angle
 $\beta $
and the wing extension length L have a strong negative correlation with the total pressure recovery coefficient and a strong positive correlation with the lift-to-drag ratio. Therefore, a smaller shock angle and shorter wing extension length result in a higher total pressure recovery coefficient for the inlet but lead to a decrease in the lift-to-drag ratio. In fact, the cone shock angle
 $\beta $
and the wing extension length L mainly affect the total pressure recovery coefficient by changing the inlet length. The wing extension length L determines the height of the airbreathing waverider, and the shock angle
 $\beta $
determines the degree to which the waverider’s lower surface bends downward relative to the horizontal line. These two factors together determine the length of the waverider, which is the length of the inlet. A shorter inlet length generally leads to lower total pressure loss within the inlet, thereby helping to improve the total pressure recovery coefficient.
Correlation heatmap of design variables and performance metrics.

SOM maps coloured by different performance metrics.

Figure 14(b) further shows the p-values corresponding to the correlation coefficients. The p-value represents the probability of observing the extremity of the correlation coefficient in the data, assuming the null hypothesis is true (i.e. the two variables are not correlated). A smaller p-value indicates stronger evidence that there is a significant correlation between the two variables. In this study, the significance level α is chosen as 0.05. Only values with p ≤ 0.05 are displayed in the figure, so the coloured areas in Fig. 14(b) indicate significant correlations between the two variables. It can be observed that, except for the cone shock angle
 $\beta $
and the wing extension length L, the height ratio of the middle section of the ICC curve q, the third control point of the B-spline curve
 ${x_{{n_3}}}$
, and the span angle of the edge points on both sides of the airbreathing waverider
 $\varphi $
have a significant impact on the total pressure recovery coefficient of the inlet under both operating conditions. Combining with Fig. 14(a),
 ${x_{{n_3}}}$
and
 $\varphi $
is negative on the total pressure recovery coefficient, while the influence of q is positive. Based on the physical meaning of the parameters, it can be understood that the upward displacement of the upper surface of the airbreathing waverider corresponding to control point
 ${x_{{n_3}}}$
, the downward shift of the inlet lip, and the reduction in the lateral width of the waverider all contribute to improving the total pressure recovery coefficient of the inlet. At the same time, the effect of q on the lift-to-drag ratio is also positive, which explains why the optimised value of q is close to the upper bound of its range.
Based on the analysis of the relationship between key design variables and performance metrics, the self-organising map (SOM) method is further employed to analyse the interrelationships among the performance indicators. SOM is an unsupervised learning neural network model that maps high-dimensional data onto a lower-dimensional (typically two-dimensional) grid using a competitive learning algorithm. SOM adjusts the weights of grid nodes so that similar data points become adjacent on the grid, revealing the underlying structure and patterns of the data. Figure 15 shows the SOM map coloured by the four performance metrics. It can be observed that the total pressure recovery coefficient
 ${\lambda _{Ma{\rm{ }}8}}$
under Ma = 8 and
 ${\lambda _{Ma{\rm{ 10}}}}$
under Ma = 10 conditions exhibits good consistency. Similarly, there is also strong consistency between the lift-to-drag ratio
 ${{L/D}_{Ma{\rm{\, }}8}}$
and
 $L/D_{Ma{\rm{\, }}10}$
under both conditions. However, it can be observed that there is a clear trade-off between the total pressure recovery coefficient and the lift-to-drag ratio. A larger lift-to-drag ratio tends to lead to a lower total pressure recovery coefficient, indicating a conflict between the internal flow and external flow performance of the airbreathing waverider. Improving the total pressure recovery coefficient of the inlet leads to a loss in the lift-to-drag ratio of the aircraft’s external flow. This finding also explains why, in the Pareto solution set, the performance indicator of
 ${\lambda _{Ma{\rm{ 10}}}}$
are just meeting the constraint conditions. This is a compromise in total pressure recovery coefficient performance made in favour of achieving a higher lift-to-drag ratio.
6.0 Conclusions
This paper proposes a superimposed design method based on the osculating cone principle and successfully constructs an airbreathing waverider configuration. By organically integrating the waverider forebody, afterbody and extension body, this method not only endows the vehicle with excellent aerodynamic performance but also meets the stringent total pressure requirements of the inlet for a scramjet engine, offering a viable configuration design path for wide-speed-range high-efficiency flight missions.
Compared with conventional approaches, the proposed method demonstrates strong generality and scalability. It effectively addresses the complex coupling between internal and external flows, while balancing lift-to-drag ratio and total pressure recovery performance of the inlet during the optimisation process. The influence patterns of key design parameters identified in this study provide data-driven design knowledge for hypersonic configuration development and facilitate future multi-objective collaborative optimisation efforts.
Moreover, this work introduces data mining techniques and, for the first time, applies SOM analysis in the optimisation of airbreathing waverider configurations, uncovering trade-off patterns between internal and external flow performance from multidimensional data. This discovery holds both theoretical and practical significance for advancing integrated design of hypersonic vehicles.
Although the optimisation conditions in this study do not fully reflect the configuration-specific characteristics – since the objectives and constraints were derived from publicly available data – the optimisation framework can be further refined and expanded in future work to meet specific mission requirements. Nevertheless, this does not undermine the generality and adaptability of the proposed method, whose framework can be extended to the configuration design of other types of hypersonic vehicles.
Data availability
The data that support the findings of this study are available from the corresponding author upon reasonable request.
Acknowledgements
The authors would like to express their thanks for the support from the National Natural Science Foundation of China (No. 12472338).
Author contributions
Jun-xue Leng: Conceptualisation (equal); Formal analysis (lead); Investigation (lead); Methodology (lead); Validation (lead); Visualisation (equal); Writing – original draft (lead). Can-can Zhou: Data curation (equal); Investigation (supporting); Resources (supporting); Software (equal); Visualisation (equal). Wei Huang: Conceptualisation (equal); Funding acquisition (lead); Project administration (lead); Supervision (equal); Writing – review & editing (lead). Zhen-tao Zhao: Formal analysis (supporting); Investigation (supporting); Methodology (supporting); Validation (equal). Zan Xie: Conceptualisation (equal); Funding acquisition (equal); Project administration (equal); Software (equal); Supervision (equal).
Competing interest
The authors declare there is no conflict of interest regarding the publication of this paper.