





Impact statement
Non-functional slack filling (or packaging that is intentionally underfilled) is a poorly documented tactic used by global manufacturers. Using data contributed by community scientists, this article highlights slack filling practices in food and non-food items from 24 countries and explores existing and proposed mechanisms for limiting plastic packaging waste.
Introduction
Plastic pollution is a worsening environmental crisis, with frequent and concerning predictions regarding the quantity of plastic being produced and inappropriately managed, and the associated consequences for species and ecosystems (Persson et al., Reference Persson, Carney Almroth, Collins, Cornell, de Wit, Diamond, Fantke, Hassellöv, MacLeod, Ryberg, Søgaard Jørgensen, Villarrubia-Gómez, Wang and Hauschild2022; Cottom et al., Reference Cottom, Cook and Velis2024). The United Nations Environment Programme predicts plastic waste in aquatic ecosystems could triple by 2040 without proper interventions (UNEP, 2021). Plastic production and disposal are also significant and simultaneous contributors to other crises, such as climate change. For example, plastic production is highly dependent on fossil fuels, with CO2 emissions associated with the production, use and disposal of conventional plastics forecast to account for 19% of the global carbon budget by 2040 (compared with only ~3% today; PEW, 2020). Plastic production also causes immeasurable social harm to disadvantaged and disempowered communities (Ford et al., Reference Ford, Jones, Davies, Godley, Jambeck, Napper, Suckling, Williams, Woodall and Koldewey2022; Lavers et al., Reference Lavers, Bond and Rolsky2022), with much of the waste from Western countries shipped thousands of kilometres and then “offloaded” on developing countries that often have less regulation to ensure safe disposal (Tran et al., Reference Tran, Goto and Matsuda2021; Lavers et al., Reference Lavers, Bond and Rolsky2022). In developing countries, open burning of plastics is used as a waste management tool, which is hazardous to human health and pollutes the air with toxins and CO2 (Pathak et al., Reference Pathak, Nichter, Hardon, Moyer, Latkar, Simbaya, Pakasi, Taqueban and Love2023). Thus, at every stage of its life cycle, from extraction and refining to disposal, plastics contribute to environmental and social harm by exacerbating inequality and global warming, and threatening natural systems (González et al., Reference González, Radvany and Azoulay2023).
The impact of this waste generation also has economic implications for society. Global plastic production has more than quadrupled in only 40 years (Kaza et al., Reference Kaza, Yao, Bhada-Tata, van Woerden and Levine2018). Following this trend, the estimated global cost of municipal solid waste management is predicted to increase by 60.5% by 2040, costing global economies US$61 billion under a business-as-usual scenario (Kaza et al., Reference Kaza, Yao, Bhada-Tata, van Woerden and Levine2018). Plastics’ largest market is packaging (accounting for 35%–40% of global production (Geyer, Reference Geyer and Letcher2020; UNEP, 2021)), an application whose growth was accelerated by a global shift from reusable to single-use containers (Geyer et al., Reference Geyer, Jambeck and Law2017). In Australia, >3.9 million tonnes of plastic were consumed in 2022 (O’Farrell et al., Reference O’Farrell, Caggiati-Shortell, Rhode and Harney2024), with 37% of the average consumers’ waste being single-use packaging (~24 kg/person/year; PACIA, 2013). With around 98% of single-use plastic products (SUPs) produced from fossil fuel-based feedstock, packaging is now the largest contributor to single-use plastic waste, with ~85% ending up in landfill, as unregulated waste, or incinerated (Andrades et al., Reference Andrades, Martins, Fardim, Ferreira and Santos2016; Velis and Cook, Reference Velis and Cook2021; Pellengahr et al., Reference Pellengahr, Ghannadzadeh and van der Meer2023). Much of this waste has a high likelihood of contaminating the surrounding environment (Chen et al., Reference Chen, Awasthi, Wei, Tan and Li2021). Proposals to limit this risk and recover at least some of the material and waste management costs often focus on recycling; however, despite decades of public education and government investment in infrastructure, global recycling rates remain low (typically <10%; Antonopoulos et al., Reference Antonopoulos, Faraca and Tonini2021; OECD, 2022). Furthermore, there are unresolved issues with the safety, lifespan and durability of products made from recycled plastics (Turner and Filella, Reference Turner and Filella2021; Geueke et al., Reference Geueke, Phelps, Parkinson and Muncke2023).
While consumers can play a role in reducing plastic demand and/or consumption (e.g., product choice, beach clean-ups; Kandziora et al., Reference Kandziora, van Toulon, Sobral, Taylor, Ribbink, Jambeck and Werner2019; Rabiu and Jaeger-Erben, Reference Rabiu and Jaeger-Erben2024), large-scale actions implemented at the state, national or international level (e.g., changes to government policy and enhanced wastewater treatment) typically result in the greatest impact (Nikiema and Asiedu, Reference Nikiema and Asiedu2022). Implementing changes to plastic packaging can sometimes be difficult as the packaging chosen for certain products is influenced by marketing choices, including brand identity (Ghorbani and Westermann, Reference Ghorbani and Westermann2025) and maintaining product integrity (i.e., functional slack filling). However, growing awareness of the waste crisis, combined with outcry over deceptive packaging practices (Bauer et al., Reference Bauer, Dörnyei and Krauter2023); for example, package downsizing or “shrinkflation” has brought the need for sustainable packaging principles and product design to the forefront (Conklin and Marzen, Reference Conklin and Marzen2023). Non-functional slack filling (or underfilling; see Box 1) is one of the most common forms of deception because the packaging is designed to suggest a certain amount of content when, in fact, much of the package is filled with air rather than the product (Wilkins et al., Reference Wilkins, Beckenuyte and Butt2016). Substantial effort has been made to reduce or eliminate the use of non-functional slack filling, including through litigation (Zogby et al., Reference Zogby, Patterson and McBeth2020), legislation (e.g., European Union packaging regulation 2025/40; EUR-Lex, 2025), strategic corporate purchasing (Pak et al., Reference Pak, Galbreth and Ferguson2022) and the development of best-practice packaging design guidelines (CGF, 2021). However, globally, consumers are up to five times more sensitive to price than they are to package size, which is why many manufacturers choose package downsizing over price increases (Evangelidis, Reference Evangelidis2024; Kim, Reference Kim2024). Thus, non-functional slack filling exacerbates the plastic crisis, contributing to unnecessary plastic production and waste while potentially misleading consumers about product quantity.
Definition of slack fill and non-functional slack fill based on the United States of America Code of Federal States.
Following the guidelines of the United States of America Code of Federal States, slack fill is defined as “the difference between the actual capacity of a container and the volume of product contained therein.” Non-functional slack fill is the empty space in a package that is filled to less than its capacity for reasons other than:
-
1. Protection of the contents of the package;
-
2. The requirements of the machines used for enclosing the contents in such package;
-
3. Unavoidable product settling during shipping and handling;
-
4. The need for the package to perform a specific function (e.g., where packaging plays a role in the preparation or consumption of a food), where such function is inherent to the nature of the food and is clearly communicated to consumers;
-
5. The fact that the product consists of a food packaged in a reusable container where the container is part of the presentation of the food and has value which is both significant in proportion to the value of the product and independent of its function to hold the food, for example, a gift product consisting of a food or foods combined with a container that is intended for further use after the food is consumed; or durable commemorative or promotional packages; or
-
6. Inability to increase level of fill or to further reduce the size of the package (e.g., where some minimum package size is necessary to accommodate required food labelling (excluding any vignettes or other nonmandatory designs or label information), discourage pilfering, facilitate handling or accommodate tamper-resistant devices).
Given the potential benefits of reducing plastic packaging, from an environmental, consumer and economic perspective (Conklin and Marzen, Reference Conklin and Marzen2023; Matthews et al., Reference Matthews, Tanninen, Togiani, Ollikainen, Leminen and Varis2024), it is surprising how few data are available regarding slack filling in the waste management literature (Wilkins et al., Reference Wilkins, Beckenuyte and Butt2016). Here, we provide much-needed data on the prevalence and severity of non-functional slack filling in a range of consumer products sold in 24 countries during 2024–2026.
Methods
Consumer items were purchased for this study through a citizen (community) science campaign spanning May 2024–April 2026. Citizen scientists were recruited through existing volunteer networks of Tangaroa Blue Foundation and the International Waste Platform. Citizen scientists were asked to document instances of both slack fill and non-functional slack fill (defined in Box 1) across four product categories. The categories were chosen to reflect a range of human and non-human food products (e.g., confectionery) as well as products not destined for consumption (e.g., cleaning). Citizen science is increasingly used to expand the geographic or temporal scope of research studies, or to enhance community participation in science, and has successfully documented patterns in individual plastic consumption (Whitman et al., Reference Whitman, Bowyer, Nieto-Garcia, Georgiou, Evans and Fletcher2025) and the provenance of beach debris (e.g., Smith et al., Reference Smith, Banister, Fraser and Edgar2018). To ensure quality and consistency in the volunteer-generated dataset (Lewandowski and Specht, Reference Lewandowski and Specht2015), volunteers received training (via video), followed a detailed set of written instructions (see Supplemental Methods), and were required to record their data within a structured survey (i.e., Google document form) that was subject to quality control checks by the research team (JLL and LH). As individual products and manufacturers are not legally required to declare whether any excess packaging was employed for functional or non-functional reasons, the classification of items into slack fill or non-functional slack fill categories was made by two research team members (JLL and LH). This decision was primarily based on the assumed fragility of items (Box 1, Criteria 1 and 4).
To avoid bias in product type or packaging shape/material (e.g., hard vs. soft plastic), citizen scientists were instructed to undertake their weekly grocery shopping as normal, and select items based on what they had purchased for household use (i.e., opportunistic sampling). Allowing the citizen scientists (volunteers) to utilise items they would normally purchase was also key to ensuring their participation in the slack fill project did not incur a financial burden.
Measurements (e.g., width of the packaging, height including the tear strip, product mass, etc.; see Supplementary Methods) were recorded using equipment readily available within each citizen scientist’s home: a kitchen cooking scale (± 0.1 g) and measuring tape/ruler (± 1 mm). Functional and non-functional slack fill for each product was calculated as the empty space located above the product at the time of opening the new package. Empty space was measured as the distance between the top of the package and the top of the contents (± 1 mm; see Supplementary Methods). As slack fill is a three-dimensional issue, we also present an estimate of the volumetric size of each item. The relative percentage, as opposed to absolute size, was estimated using the length, width and depth measurements for the portion of each item that was classed as slack fill, calculated as a percentage of the total packaging available.
Additional information printed on the packaging, including the brand, was also noted, and photographs were taken of each product from all angles (i.e., front, side, back, top-down). Items were grouped according to four broad categories: cleaning products (e.g., dishwashing liquid, laundry detergent), confectionery (e.g., candy, chocolate), human food (e.g., dried nuts, yoghurt) and domestic animal food (dry kibble and treats for cats/dogs).
To investigate whether there was a significant difference in the proportion of non-functional slack fill in products sampled in developing and developed countries, as defined by the United Nations (UNIDO, 2025), a Mann–Whitney U test was used. All statistical analyses were completed in jamovi version 2.6.44 (Jamovi, 2026) and plots were generated using R version 4.4.1 (R Core Team, 2025). All values are reported as mean, median and interquartile range (IQR; 25th and 75th percentiles).
Results
Data on non-functional (Figure 1 and Supplementary Figure S1) and functional slack fill (Supplementary Figure S2) were provided by citizen scientists from 24 countries (Supplementary Table S1) for a total of 366 and 17 products, respectively. For each of the four product categories, between 21 and 251 items were sampled for non-functional slack fill (Table 1 and Supplementary S2). In four instances, an item with the same brand and description was measured independently, twice, by volunteers (Supplementary Table S3). In each instance, the item was measured in a different country and/or the product exhibited unique characteristics (Supplementary Table S3). Thus, the items were retained in the analysis and treated as independent measurements.
Map showing the number of products audited for functional and non-functional slack fill (total n = 371) from each of the 24 countries included in this study. Note: The scale bar shows the number of items measured in each country.

Figure 1. Long description
The document begins with a paragraph stating that following the guidelines of the United States of America Code of Federal States, slack fill is defined as the difference between the actual capacity of a container and the volume of product contained therein. It defines non-functional slack fill as empty space filled for reasons other than the following six points.
* 1. Protection of the contents of the package.
* 2. The requirements of the machines used for enclosing the contents in such package.
* 3. Unavoidable product settling during shipping and handling.
* 4. The need for the package to perform a specific function, such as preparation or consumption of a food, where such function is inherent to the nature of the food and clearly communicated to consumers.
* 5. The product consists of a food packaged in a reusable container where the container is part of the presentation and has significant value independent of its function to hold the food, such as gift products or commemorative packages.
* 6. Inability to increase level of fill or further reduce package size due to requirements for food labeling, discouraging pilfering, facilitating handling, or accommodating tamper-resistant devices.
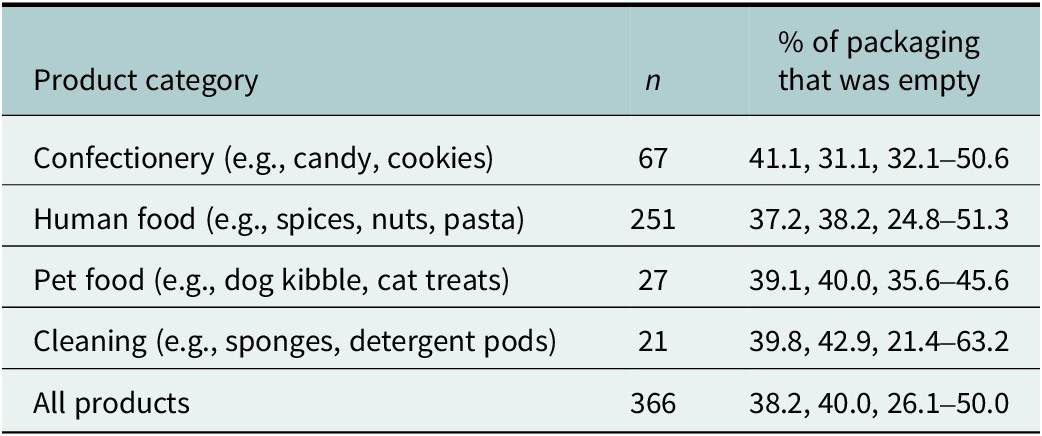
Summary of non-functional slack fill for products included in this study (mean, median and IQR). Slack fill is reported as the proportion of packaging located above the products’ contents that was empty. Dimensions for each item are provided in Supplementary Table S2, n = sample size

Table 1. Long description
The table consists of three columns: Product category, n, and percent of packaging that was empty (reported as mean, median, and I Q R).
* Confectionery (e.g., candy, cookies): n equals 67. Empty packaging: 41.1, 31.1, 32.1 to 50.6.
* Human food (e.g., spices, nuts, pasta): n equals 251. Empty packaging: 37.2, 38.2, 24.8 to 51.3.
* Pet food (e.g., dog kibble, cat treats): n equals 27. Empty packaging: 39.1, 40.0, 35.6 to 45.6.
* Cleaning (e.g., sponges, detergent pods): n equals 21. Empty packaging: 39.8, 42.9, 21.4 to 63.2.
* All products: n equals 366. Empty packaging: 38.2, 40.0, 26.1 to 50.0.
Most products were packaged in soft plastics (70.8%, n = 258) or mixed materials (e.g., soft plastic with a foil liner; 8.7%, n = 32; Supplementary Table S2), with 51.9% (n = 152) of items classed as being packaged in a pouch. The stated product volume (i.e., quantity stamped on the package) and measured volume differed in 83.0% of items, with 63 items (20.1%) containing slightly less product (6.4 ± 13.6 g) than what appeared on the label. Only 31.8% of items (n = 114) were in packaging that could be resealed once opened. Sixty-eight percent (n = 214) of items did not have any writing or logos printed on the packaging that provided consumers or waste managers with information on polymer type or appropriate disposal methods.
Only 17 products purchased by citizen scientists had functional slack filling. Due to the small sample size, the raw data are presented in Supplementary Table S2 but excluded from the analysis. None of the products were vacuum sealed or otherwise packaged to eliminate excess material. Across the 366 products with non-functional slack filling, the excess packaging material associated with the empty space equated to 38.2% of the overall packaging (Table 1) and an average of 76.1 mm (median 76.0, IQR 45.0–100.0) of excess material (Figures 2 and 3; Supplementary Figure S1). Using the average package width across the 366 products (133.3 mm; median 130.0, IQR 97.0–159.0), we estimate slack filling generated 3,664 m2 of excess packaging material across all items.
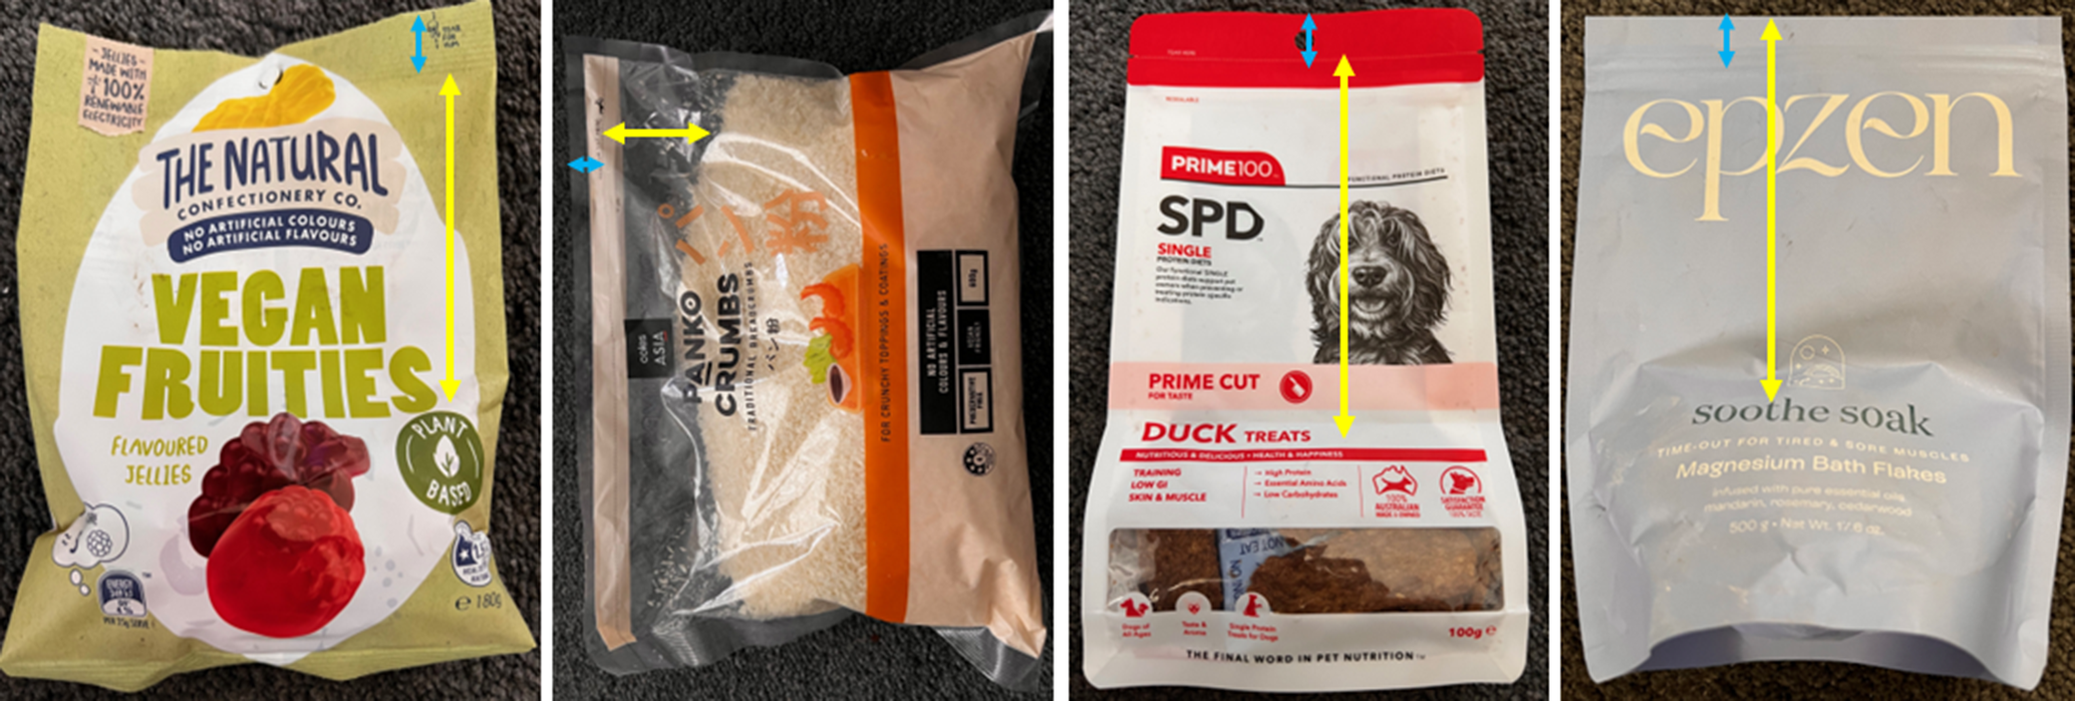
Examples of products purchased by a citizen scientist based in Australia. Note: The location for measuring non-functional slack fill (yellow arrow) and the packaging’s tear-strip (blue arrow) are shown. One product per category (left to right): confectionery, human food, pet food and cleaning/sanitary.

Figure 2. Long description
A world map uses shades of blue to represent data values for Series 1. A vertical color bar legend on the far right indicates a range from 1 in light blue to 67 in dark blue.
* In the West, Australia and the United States are shaded in the darkest blue, indicating the highest values.
* Canada, Argentina, and France are shaded in a medium blue.
* In the East, Russia, China, India, and Indonesia are shaded in light blue.
* South Africa and New Zealand also appear in light blue.
* The majority of Africa, the Middle East, and Central Asia are shaded in light gray, indicating no data or a value of zero.
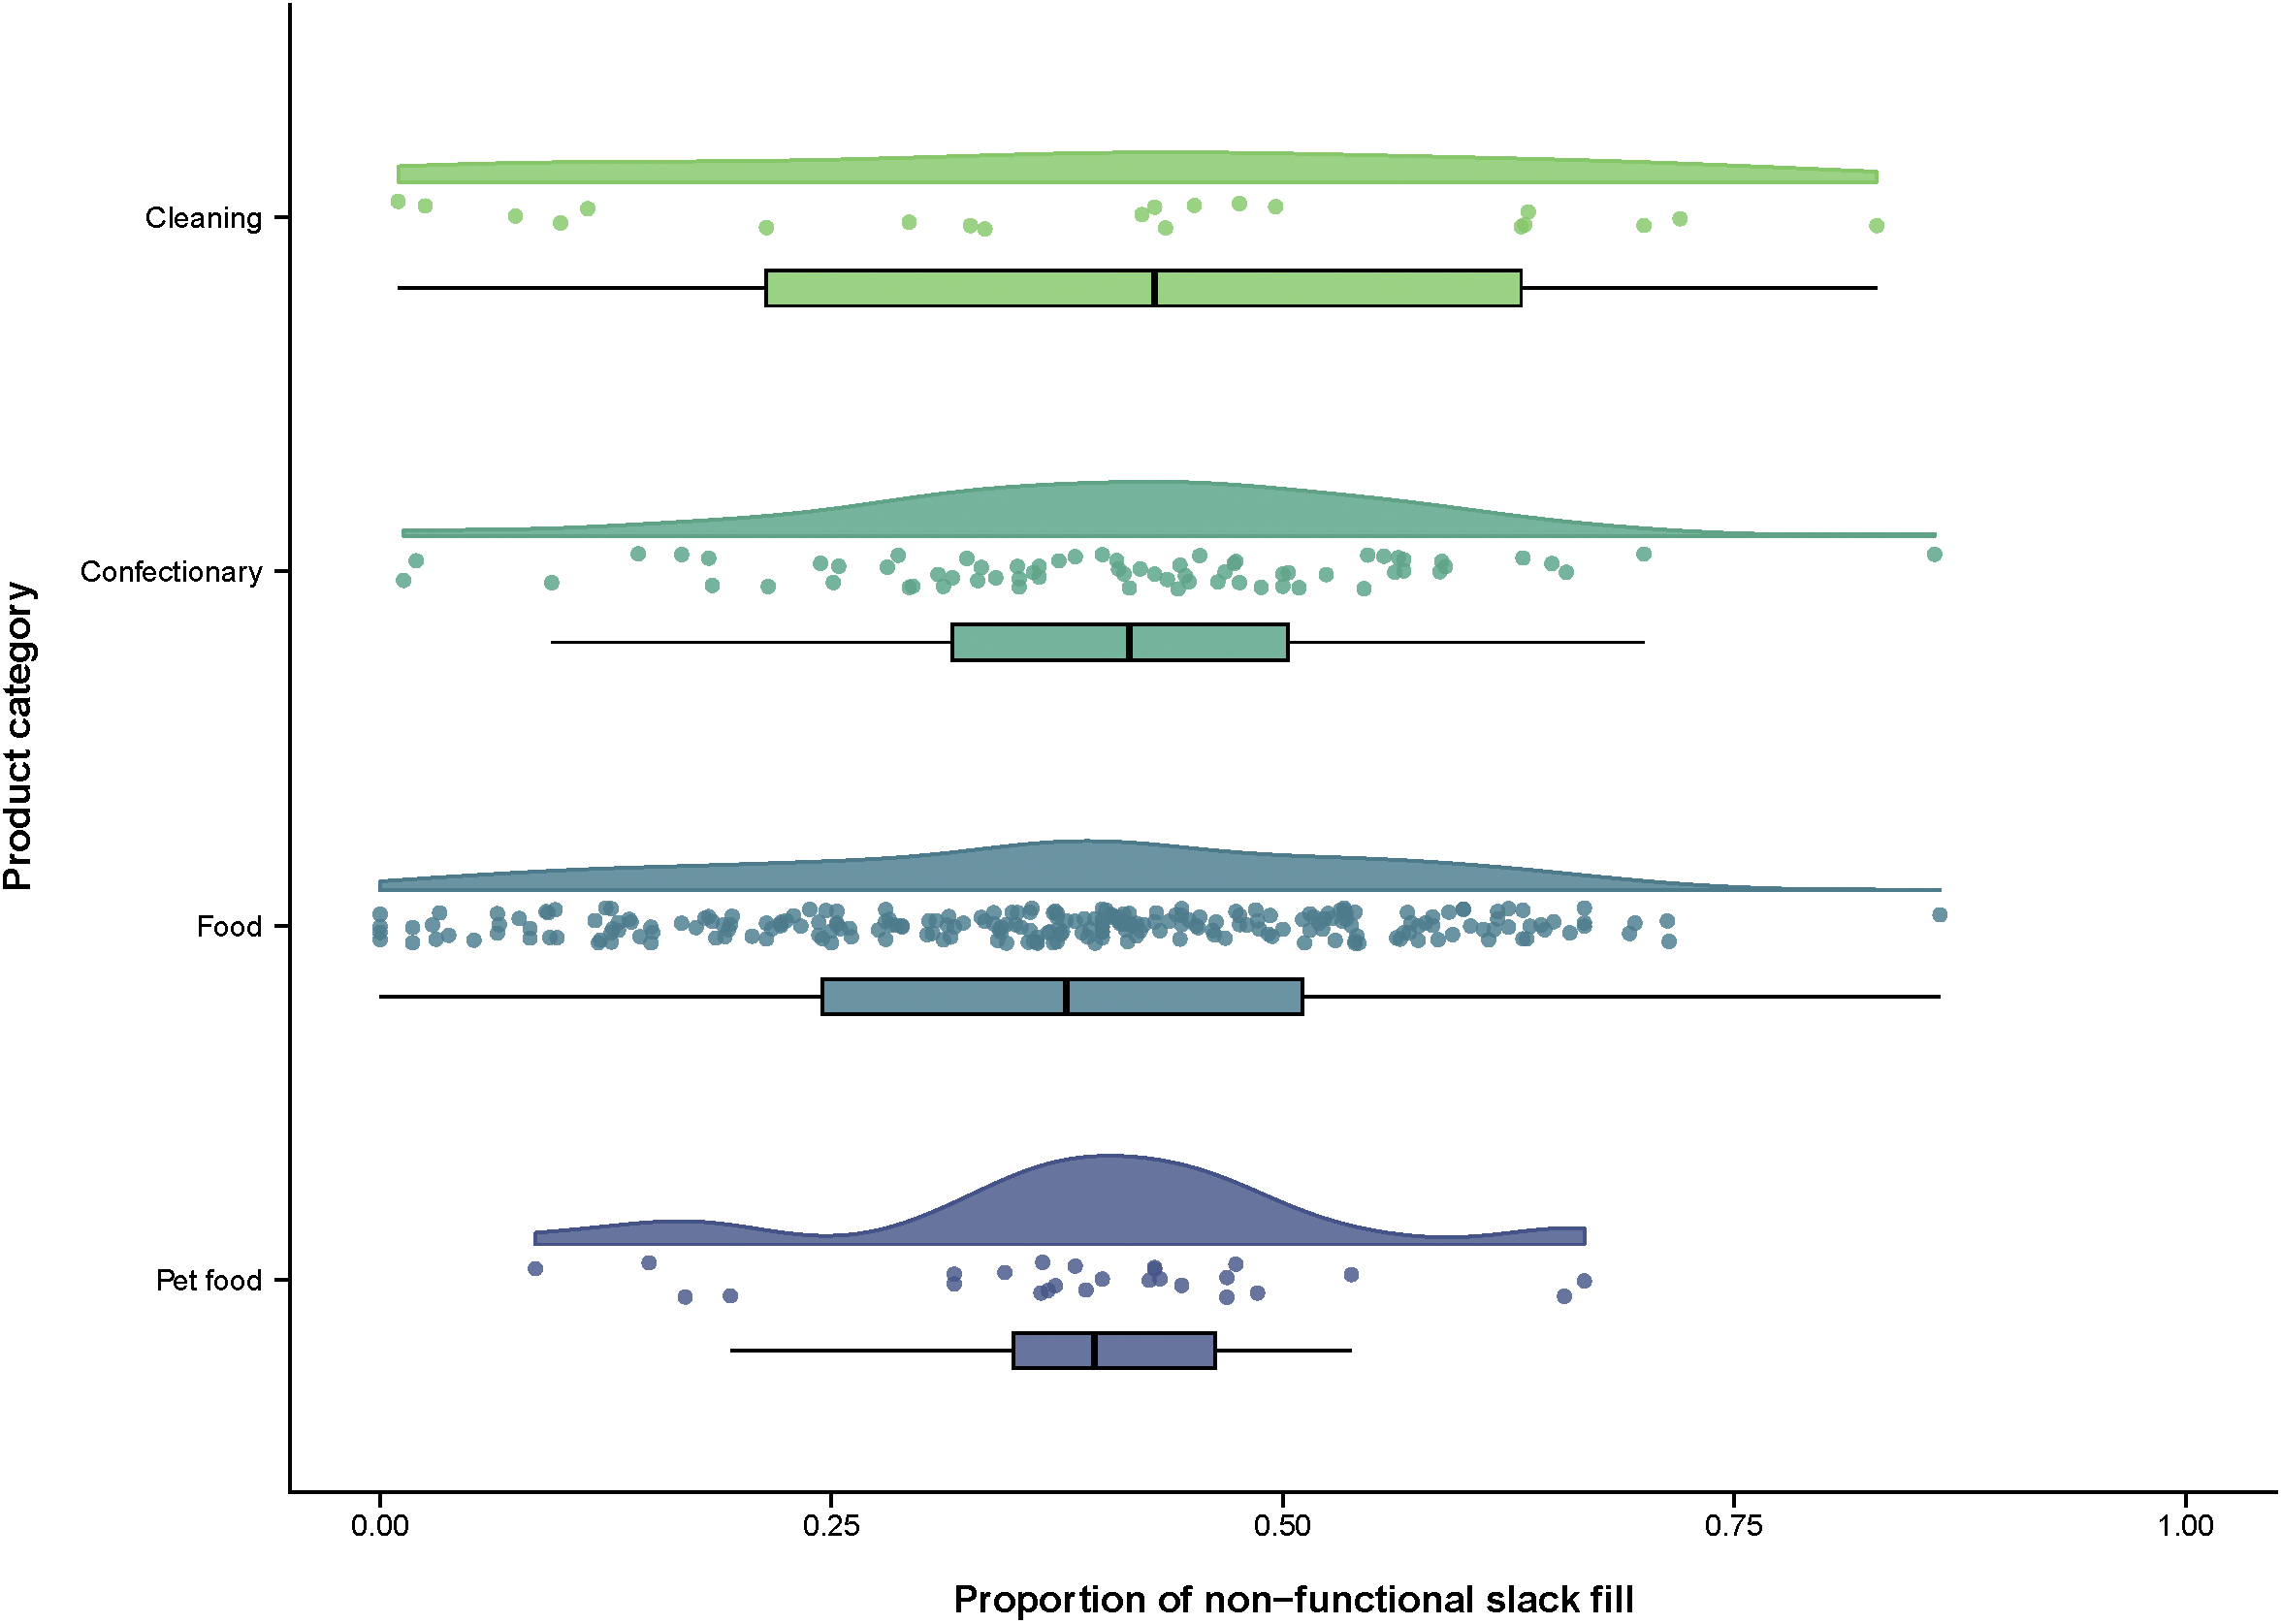
Confectionery items had the highest amount of non-functional slack fill, with 41.1% of packaging considered to be surplus (Cleaning: 39.8%, Pet food: 39.1%, Human food: 37.2%; Table 1). Overall, the slack fill for 36 items exceeded 60% of the total packaging (Figure 3, Supplementary Table S2). While the developing country sample is underpowered (n = 72 products), we found no statistical difference in the amount of non-functional slack fill (as a proportion of empty space) between products sampled in countries classified as developed (n = 296 products; Median 0.395, IQR: 0.245–0.500) and developing (Median 0.400, IQR: 0.228–0.477; U = 9,564, p = 0.318).
Raincloud plot showing the distribution of the proportions (%) of non-functional slack fill recorded for the 366 products included in this study. Note: Individual items are shown with coloured circles. The sample size for each of the four product categories is listed in Table 1 and the median value is depicted by the vertical black line.

Figure 3. Long description
The four panels show different types of flexible packaging with double-headed arrows indicating empty space.
* Panel 1: A bag of The Natural Confectionery Co. Vegan Fruities. A short blue vertical arrow at the top seal indicates the header space. A long yellow vertical arrow extends from the top seal down to the level of the candy contents, marking the slack fill.
* Panel 2: A clear plastic bag of Panko Crumbs. A short blue horizontal arrow indicates the side seal width. A yellow horizontal arrow shows the empty space between the side seal and the start of the breadcrumb contents.
* Panel 3: A stand-up pouch of Prime 100 S P D Duck Treats. A short blue vertical arrow marks the top seal. A long yellow vertical arrow extends from the seal down to the top of the visible treats in the window.
* Panel 4: A pouch of Epzen Soothe Soak Magnesium Bath Flakes. A short blue vertical arrow marks the top seal. A long yellow vertical arrow extends from the top seal down to the settled level of the bath flakes.
Discussion
This study highlights the prevalence of excess, non-functional packaging across multiple countries and various product categories, with particularly large quantities of excess packaging present in confectionery items (Table 1, Figure 3). Addressing this problem presents an important opportunity to redesign products in a way that reduces excessive and largely avoidable amounts of unnecessary plastic production and waste without compromising product integrity or consumer experience. Rarely are solutions so obvious; implementing changes to existing U.S. based slack fill policy, and expanding it to include other countries, will tackle some of the urgent changes and government commitments highlighted in numerous national policy documents (Global Plastics Policy Centre, 2024), including Australia’s National Waste Policy Action Plan (2024) (e.g., continued phase out of problematic and unnecessary plastics; DCCEEW, 2024), the European Union Packaging Waste Regulation 2025/40 (e.g., Article 24, Obligation related to excessive packaging; EUR-Lex, 2025), and during the recent Global Plastics Treaty negotiations (e.g., Article 3, prevention and reduction of “unnecessary” waste; UNEP, 2025).
Established in 2020, the “Golden Design Rules” provide clear, but voluntary, guidance on packaging design that optimises plastic production and recycling while minimising waste (CGF, 2021). Of particular note is Golden Design Rule #3, which aims to “Eliminate excess headspace [non-functional slack-filling] for all flexible pack types, such that the maximum headspace is 30% or less across the product categories outlined in the rule.” More than 5 years later, our results indicate non-functional slack fill accounts for 37–41% of the packaging used to store and transport most products around the globe (Table 1 and Supplementary Table S2, Figure 3 and Supplementary Figure S1), with 72% of the 366 sampled items exceeding the Golden Design Rule target of ≤30% slack-fill. Thus, there is an urgent need for new, more effective and enforceable policies that address this little-known but critical issue. More efficient packaging design can lessen the impact and scale of numerous environmental and social issues, including marine pollution and the waste management crisis (Shittu et al., Reference Shittu, Arnautovic, Lockrey, Vince, Vogel, Bhattacharya, Stanes, Garofano, Retamal and Harkness2024; Thompson et al., Reference Thompson, Courtene-Jones, Boucher, Pahl, Raubenheimer and Koelmans2024; Supplementary Table S4). Macroplastics, including packaging items, are the main source of microplastics as products break up over time due to exposure to UV radiation, wave action and other environmental factors (Thompson et al., Reference Thompson, Courtene-Jones, Boucher, Pahl, Raubenheimer and Koelmans2024). By addressing non-functional slack fill and designing more efficient packaging, the total volume of plastic available to potentially enter the environment is reduced. For example, a recent study examining the efficiency of plastic drink bottles found that a 20% shift in beverage product sales from small to midsize containers reduced the consumption of polyethylene terephthalate (PET) plastic by >1% (or 9,978 tons) per year in the United States (Becerril-Arreola and Bucklin, Reference Becerril-Arreola and Bucklin2021). Reduced plastic consumption also has other flow-on effects, with excess plastic packaging harming the environment through unnecessary fossil fuel consumption (Lavers et al., Reference Lavers, Bond and Rolsky2022; Tangri, Reference Tangri2025). While transport is thought to be only a minor contributor to the overall emissions life cycle of plastics, Australia imports more than 60% of finished and semi-finished goods, with only 9% of plastic use based on virgin resin manufactured locally in Australia (O’Farrell and Pickin, Reference O’Farrell and Pickin2023). Our data suggest limiting non-functional slack fill could reduce the total amount of packaging material by at least 15%–30%, and in some cases >80% (Supplementary Table S2), meaning more products could be transported in fewer trips, saving on carbon emissions.
The reduction in packaging waste through limiting slack fill would also benefit local communities and governments by reducing the burden on waste collection services (Supplementary Table S2). Fewer materials to collect, transport and process means reduced operational costs for local governments and waste management companies (Hossain et al., Reference Hossain, Islam, Ghose and Sahajwalla2022). Less slack fill, and therefore less packaging overall, could potentially translate into reduced costs for waste disposal and recycling, which are often borne by municipalities and passed on to taxpayers (Huang et al., Reference Huang, Wang, Ahmad, Ahmad, Ivanovich Vatin, Mohamed, Deifalla and Mehmood2022). Additionally, reducing the volume of plastic waste (e.g., through recycling and regulating non-functional slack fill) can help extend the lifespan of landfills, delaying the need for costly expansions or the creation of new waste disposal sites (Evode et al., Reference Evode, Qamar, Bilal, Barceló and Iqbal2021; Anderson and Gbor, Reference Anderson and Gbor2024) and reduce the risk of litigation for plastics manufacturers (Zogby et al., Reference Zogby, Patterson and McBeth2018; Conklin and Marzen, Reference Conklin and Marzen2023). Waste management is particularly challenging when dealing with soft plastics and packaging comprised of mixed materials (e.g., plastics and foil; de Mello Soares et al., Reference de Mello Soares, Ek, Östmark, Gällstedt and Karlsson2022). For example, in 2011 Australia introduced the REDcycle collection programme as a mechanism to recover soft plastics. However, the programme was discontinued in 2022 due to the difficulties associated with processing mixed materials as well as a lack of markets for both the collected material and recycled products that were produced (Hossain et al., Reference Hossain, Islam, Ghose and Sahajwalla2022; Shittu et al., Reference Shittu, Arnautovic, Lockrey, Vince, Vogel, Bhattacharya, Stanes, Garofano, Retamal and Harkness2024). Plastic collection programmes have also been suspended in the United States (e.g., the Stina plastic film Drop-off Directory shut down in 2023) and the United Kingdom (e.g., Tesco’s soft-plastics take-back scheme was cancelled in 2024) due, in part, to concerns around recovered product being landfilled or incinerated rather than recycled (EIA, 2024). More than 95% of the products purchased in Australia and included in this study were packaged in materials that continue to pose substantial waste management challenges for Australian municipalities (Supplementary Table S2; Shittu et al., Reference Shittu, Arnautovic, Lockrey, Vince, Vogel, Bhattacharya, Stanes, Garofano, Retamal and Harkness2024), and yet ~38% of this material likely could have been avoided through improvements to slack fill regulations (Table 1).
Finally, the identification of simple yet promising opportunities to reduce unnecessary plastic packaging will be essential to the High Ambition Coalition’s participation in the Global Plastics Treaty, of which Australia is a member. Under the ‘Product design’ section and Annex X of the revised draft of the treaty (UNEP, 2023), there are clear expectations around the need for all signatories to commit to “comply with minimum design and performance criteria” and “reduce the use of plastics across the value chain, including in product packaging.” Once in force, parties to the treaty will also be required to “adopt and enhance sustainable product design and performance criteria, by production improvement such as volume reduction [and] simplification of packaging” (UNEP, 2023). Our data suggest we have a long way to go, with basic information on the polymer type of packaging missing from 64% of items and only 32% of products having resealable packaging (i.e., the packaging helps maintain product freshness after opening and/or could be reused).
Our findings underscore the need for international standards, international, national and local regulations and industry innovation to tackle non-functional slack filling. However, choosing an effective policy instrument will be crucial for tackling this sustainability problem; in particular, regulations will need to include enforceable reduction targets, not voluntary measures which have been demonstrated to be ineffective in Australia, Canada and elsewhere (Dylan and Chochla, Reference Dylan and Chochla2022; Jones and Head, Reference Jones and Head2024). According to the U.S. Environmental Protection Agency, achieving a significant reduction in plastic waste and the associated environmental harm will require a source reduction approach, including a “change in the design…of materials or products (including packaging) to reduce their amount or toxicity before they become municipal solid waste” (EPA, 2020). By focusing on this aspect of packaging design, significant reductions in plastic waste and pollution could be achieved, contributing to the broader goals of the Global Plastics Treaty, the UN Sustainable Development Goals, and moving towards a safer, more sustainable and efficient use of plastics.
While the environmental benefits of reducing excessive packaging are clear, the economic benefits also cannot be ignored. For example, extra packaging is associated with concerns around increased household waste and environmental harm, and as a consequence, leads many consumers to avoid overpackaged products (Elgaaïed-Gambier, Reference Elgaaïed-Gambier2016; Bauer et al., Reference Bauer, Dörnyei and Krauter2023). However, a potential barrier to avoiding excessive packaging is the unavailability of non-overpackaged products (Elgaaïed-Gambier, Reference Elgaaïed-Gambier2016). While our results indicate excess packaging is widespread, we were not able to provide data on all product types (e.g., medicinal, stationery) and have relatively few data for pet food and cleaning products (n = 26 and 21 respectively) and items packaged in polystyrene or hard plastic (n = 2 and 17 respectively). As we were unable to account for all of the non-functional slack filling criteria (e.g., settling during transit; Criteria 4, Box 1), our estimates of non-functional slack filling may be biased high. Consumers’ ability to make informed choices around packaging is only possible when products are available in alternative packaging (Elgaaïed-Gambier, Reference Elgaaïed-Gambier2016), and our results demonstrate a clear need for more data and low-packaging options, globally.
Open peer review
To view the open peer review materials for this article, please visit http://doi.org/10.1017/plc.2026.10062.
Supplementary material
The supplementary material for this article can be found at http://doi.org/10.1017/plc.2026.10062.
Acknowledgements
Citizen science programmes succeed because of the investment and passion of dedicated individuals. We are especially thankful for support received from Alicia Loh (Our Sea of East Asian Network), Nathalie Fournier, Heather Lindgren, Facundo Escobar, Andreas de Beer (Sustainable Seas Trust), Willow McIntyre, Olga Mironenko (IWP Russia), Dr. Jane Mulcock, Dr. Ingrid Pollet (Adrift Lab), Matthew Youd (Tangaroa Blue), Drs Jack Rivers-Auty (Adrift Lab), Bianca Keys (Adrift Lab), Elaine Zheng (Rendu Ocean), Louise Lavers and Asher Potter-Butler. Grateful to Dr. Alix de Jersey (Adrift Lab) for contributing data and assisting with Figure 3. Anonymous reviewers generously volunteered their time to provide constructive feedback on previous versions of this manuscript.
Author contribution
J.L.L. and L.H. wrote the initial draft of the manuscript. All authors reviewed and approved the final version and contributed to data collection. J.L.L., L.H. and H.T. developed the method and approached participants. B.C. generated the map included as Figure 1.
Declaration of interest
The authors declare no conflicts of interest.
Data availability statement
The data used in this analysis are presented in Supplementary Tables S1 and S2.
Ethics statement
The authors have nothing to report.
Funding statement
Tangaroa Blue Foundation provided the funding for this research.



 Open access


Comments
Dear Editor,
Enclosed please find our manuscript entitled “Less is more: Quantifying non-functional slack filling and its role in reducing global packaging waste” for publication as a research article in Cambridge Prisms: Plastics.
Brief background: Non-functional slack filling (or packaging that is intentionally underfilled) is a tactic commonly used by manufacturers to increase profits while maintaining consumer confidence. Few quantitative data are available to demonstrate the environmental and social harm associated with this practice, including potential implications for municipal waste management.
Study aims: In this manuscript we present the results of a citizen science program that generated data on non-functional slack filling for >360 products from 24 countries. Our results demonstrate that non-functional slack fill is globally widespread, regardless of the product type (e.g., confectionary, human food) and on average, accounts for 39% of the total material used as packaging. We discuss the very relevant and timely implications for improving packaging policy, including via the ongoing Global Plastic Treaty negotiations.