Introduction
The structure of synapses between photoreceptor cells and bipolar cells in the vertebrate retina is unlike that of synapses elsewhere in the central nervous system. Specifically, each active zone in a photoreceptor terminal has a pair of strips of vesicle fusion sites straddling the base of a presynaptic ribbon, each active zone is presynaptic to a number of bipolar cells of several types as well as horizontal cells, and the clusters of postsynaptic glutamate receptors on bipolar cells are not directly across the synaptic cleft from an active zone (Dowling & Boycott, Reference Dowling and Boycott1966; Boycott & Dowling, Reference Boycott and Dowling1969; Raviola & Gilula, Reference Raviola and Gilula1975; Dowling, Reference Dowling1987; Boycott & Wässle, Reference Boycott and Wässle1991; Chun et al., Reference Chun, Grünert, Martin and Wässle1996; Hopkins & Boycott, Reference Hopkins and Boycott1997; Vardi et al., Reference Vardi, Morigiwa, Wang, Shi and Sterling1998, Reference Vardi, Duvoisin, Wu and Sterling2000; Haverkamp et al., Reference Haverkamp, Grünert and Wässle2000; Lenzi & von Gersdorff, Reference Lenzi and von Gersdorff2001; Wässle et al., Reference Wässle, Haverkamp, Grünert, Morgans and Kaneko2003; Heidelberger et al., Reference Heidelberger, Thoreson and Witkovsky2005).
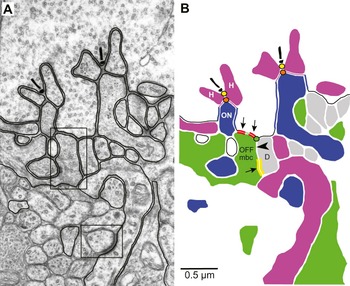
Instead, the contacts made by a cone synaptic terminal with each type of bipolar cell occupy characteristic locations with respect to the base of the presynaptic ribbon, some relatively near and others far, and the postsynaptic membranes at these contacts harbor characteristic types of glutamate receptor (Brandstätter et al., Reference Brandstätter, Koulen and Wässle1997; Morigiwa & Vardi, Reference Morigiwa and Vardi1999; Qin & Pourcho, Reference Qin and Pourcho1999; DeVries, Reference DeVries2000; Vardi et al., Reference Vardi, Duvoisin, Wu and Sterling2000; Brandstätter & Hack, Reference Brandstätter and Hack2001; Hack et al., Reference Hack, Frech, Dick, Peichl and Brandstätter2001; Haverkamp et al., Reference Haverkamp, Grünert and Wässle2001a,Reference Haverkamp, Grünert and Wässleb; Wässle et al., Reference Wässle, Haverkamp, Grünert, Morgans and Kaneko2003; DeVries et al., 2006). Specifically, in the fovea of macaque monkey retina, a cone terminal makes contacts with bipolar cell dendrites at three characteristic distances with respect to an active zone. The closest bipolar cell dendrites are invaginating central elements (Fig. 1A and blue-filled dendrites in Fig. 1B) provided by ON midget and ON diffuse bipolar cells. On those dendrites, clusters of metabotropic mGluR6 receptors are located within asymmetrically dense regions down the sides of the central element (along thick blue contour segments in Fig. 1B), where the cone terminal apposes the central element, less than 1 μm from the site of glutamate release at the base of a synaptic ribbon (yellow discs in Fig. 1B) (Nomura et al., Reference Nomura, Shigemoto, Nakamura, Okamoto, Mizuno and Nakanishi1994; Vardi et al., Reference Vardi, Morigiwa, Wang, Shi and Sterling1998, Reference Vardi, Duvoisin, Wu and Sterling2000; Ahmad et al., Reference Ahmad, Klug, Herr, Sterling and Schein2003).
OFF midget bipolar cell dendrites have similar symmetric densities at their tips (“Outer Densities”) and more proximally (“Inner Densities”), the latter not in contact with the cone terminal. In this photomicrograph (A) and schematic (B) of a cross section through a foveal cone terminal, two ribbon synaptic units are visible. Each has a synaptic ribbon on the presynaptic side, its arciform density (centered on an active zone) at its base marked by a yellow disc, and a triad of postsynaptic elements: two (purple-filled) lateral elements provided by horizontal cells (H) and a (blue-filled) central element provided by an ON bipolar cell (ON). Where postsynaptic elements invaginate the terminal, the presynaptic surface apposes lateral elements and the sides of invaginating central elements. At the latter location, the membrane is asymmetrically thickened, as marked by blue contour segments. At the bottom of the invaginations, the basal portion of the presynaptic surface contacts the (green-filled) dendrites of its OFF midget bipolar cell (OFF), which contain one or more Outer Densities, regions with symmetrically thickened dense membranes marked by red contour segments. Similar regions on the OFF midget bipolar cell dendrites, Inner Densities (yellow bars), are located down inner clefts (black arrowhead) from the basal surface. Its partner at the Inner Density is a (gray-filled) diffuse bipolar cell dendrite (D). The path along synaptic clefts from the active zone to an Outer Density bifurcates at the orange disc at the apex of a central element (apical point). The path to an Inner Density bifurcates again at the green disc (rim point). The hybrid synaptic contour that connects the black, blue, purple, red, and green contour elements is called hybrid because it incorporates contour segments provided by the cone terminal (black, blue, red, and green) and contour segments over central elements provided by ON bipolar cells (purple). The region in the upper box in (A), showing Outer and Inner Densities, and the region in the lower box in (A), showing a desmosome-like junction, are shown enlarged in Figs. 3A and 3E, respectively.

The next closest bipolar contacts made by a cone terminal are “basal contacts” (region including the red contour segments in Fig. 1B) with the tips of the dendrites of its OFF midget bipolar cells (green-filled dendrites) (Kolb et al., Reference Kolb, Boycott and Dowling1969) in what has been called the “triad-associated” position, adjacent to the central element (Kolb, Reference Kolb1970; Boycott & Hopkins, Reference Boycott and Hopkins1991, Reference Boycott and Hopkins1993; Hopkins & Boycott, Reference Hopkins and Boycott1997; Klug et al., Reference Klug, Herr, Ngo, Sterling and Schein2003; Schein et al., 2011). In this case, one or more clusters of AMPA-type ionotropic GluR receptors within each basal contact (Haverkamp et al., Reference Haverkamp, Grünert and Wässle2001b; Puller et al., Reference Puller, Haverkamp and Grünert2007) are marked by regions with symmetrically dense membranes (red contour segments) that we here call “Outer Densities.” Not marked in this schematic are asymmetrically dense basal contacts with the tips of the dendrites of some ON diffuse bipolar cells, also in the triad-associated position (Calkins et al., Reference Calkins, Tsukamoto and Sterling1996). The contacts farthest from the active zone are symmetrically dense basal contacts with the dendrites of OFF diffuse bipolar cells (gray-filled dendrites, one marked D in Fig. 1B). As a rule in macaque retina, the sign-inverting synapses onto ON bipolar cells have asymmetric densities, whereas the sign-preserving synapses onto OFF bipolar cells have symmetric densities (Raviola & Gilula, Reference Raviola and Gilula1975; Ahmad et al., Reference Ahmad, Klug, Herr, Sterling and Schein2003).
Clusters of glutamate receptors are not confined to membranes directly apposed to the cone terminal. For example, desmosome-like junctions (lower box in the micrograph in Fig. 1A) between horizontal cell processes deep within the outer plexiform layer are rich in GluR2/3 and GluR4 (AMPA) and GluR6/7 (kainate) receptors (Haverkamp et al., Reference Haverkamp, Grünert and Wässle2000, Reference Haverkamp, Grünert and Wässle2001a,Reference Haverkamp, Grünert and Wässleb; Puller et al., 2007). Since glutamate receptors are characteristically clustered in particular locations, the locations of clusters may be systematically related to their functions. Such geographical systems of densities on bipolar cells are of interest because each system may harbor a particular type of receptor. In this paper, we characterize such a system, the “Inner Densities” (yellow bars in Fig. 1B) on the dendrites of OFF midget bipolar cells. These symmetric densities are similar in appearance to the Outer Densities in triad-associated contacts, but they are located more proximally on the dendrites, not directly apposed to the membrane of the cone terminal. Therefore, we also identify the likely path and distance for diffusion of glutamate to these Inner Densities.
Materials and methods
Detailed methods for preparing a retina from an adult (6 kg), male, Macaca fascicularis monkey for electron microscopy are reported elsewhere (Tsukamoto et al., Reference Tsukamoto, Masarachia, Schein and Sterling1992; Herr et al., Reference Herr, Klug, Sterling and Schein2003; Schein et al., 2011) and were in accord with assurance number A3332-01 from the Institutional Animal Care and Use Committee of the Massachusetts Eye and Ear Infirmary. From this material, we created and imaged onto negatives a series of 319 consecutive, ultrathin, radial (cross) sections for electron microscopy of a region of the fovea corresponding to ~1 deg of eccentricity (Calkins et al., Reference Calkins, Schein, Tsukamoto and Sterling1994). We base the work here on the same 16 L/M-cone and 2 S-cone terminals that we describe in the companion paper (Schein et al., 2011), terminals that we reimaged in the electron microscope onto film at 5000× and printed at 3.5× enlargement or reimaged at 10,000× onto film and printed at 2.5× enlargement.
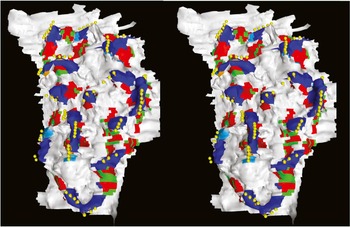
We used digital serial reconstruction to visualize in three dimensions (Smith, Reference Smith1987) cone terminals and the complete dendritic arbors of OFF midget bipolar cells and their contacts with cone synaptic terminals, including Outer Densities and Inner Densities. To measure distances from an active zone to Outer and Inner Densities, we created “hybrid synaptic surfaces” from “hybrid synaptic contours.” A hybrid synaptic contour is composed of the basal surface of the cone terminal (black contour segments in Fig. 1B), the regions of apposition between the cone terminal and the central elements (blue contour segments for a midget bipolar cell, as in this case in Fig. 1B, and cyan contour segments for an ON diffuse bipolar cell), and regions of apposition between the tips of central elements and lateral elements (purple contour segments in Fig. 1B) provided by horizontal cells. We describe the contour as hybrid because it excludes cone terminal membrane in apposition to lateral elements but instead includes the purple contour segments that do not represent cone terminal membrane. We then reconstructed a “hybrid synaptic surface” as shown in Fig. 2 from a series of hybrid synaptic contours (Herr et al., Reference Herr, Klug, Sterling and Schein2003; Klug et al., Reference Klug, Herr, Ngo, Sterling and Schein2003; Schein et al., Reference Schein, Sterling, Ngo, Huang and Herr2004). The hybrid synaptic surface thus represents the extracellular space in which glutamate can diffuse along the surface of a cone terminal.
The hybrid synaptic surface of cone terminal #28 was assembled from hybrid contours as described in the text and illustrated in Fig. 1. The placement of the stereopartners assumes convergent viewing, permitting the reader to view the surface from inside the terminal. For that reason, each string of yellow spheres, marking the base of a synaptic ribbon and thus centered on an active zone, generally obscures the more inwardly placed string of (orange) apical points, centered within a (blue) region over a midget bipolar cell’s central element or a (cyan) region over an ON diffuse bipolar cell’s central element. Adjacent to central elements, the (green) basal contacts with the OFF midget bipolar cell include (red) Outer Densities.

Each yellow disc in Fig. 1B marks the base of a synaptic ribbon and thus the active zone centered on the base. For the one on the left in Fig. 1B, at the bottom of the neck between two lateral elements, the bottom marked by an orange disc in Fig. 1B, the synaptic cleft—thus the diffusion path of glutamate—bifurcates at the apex (“apical point”) of the (blue-filled) central element. [These apical points were called “bifurcation points” in the reconstructions of rod photoreceptor ribbon synapses in Migdale et al. (Reference Migdale, Herr, Klug, Ahmad, Linberg, Sterling and Schein2003).] The synaptic cleft or path extends over each side of the central element, providing access for glutamate to the cluster of mGluR6 receptors in the asymmetric density (blue contour segments) in the region of apposition between the invaginating central element and the cone terminal. The path extends along the surface of the terminal to a basal contact with two red contour segments, each marking a symmetric Outer Density between the terminal and the (green-filled) OFF midget bipolar cell dendrite. (Red contour segments, representing Outer Densities within the basal contacts, often occupy most of the basal contact, leaving only a little of the rest of the basal contact to be marked by green contour segments.) At the green disc, called the “rim point,” some glutamate could turn down (inward) from the basal surface and extend down the “inner cleft” (black arrowhead) to reach the symmetric Inner Density (yellow bars) on the OFF midget bipolar cell dendrite.
We tiled wire-frame models of the hybrid surface with triangles using the ContourFitter program (Meyers et al., Reference Meyers, Skinner and Sloan1992). The edges of these triangles were ~0.03 μm long within the plane of a section, the distance between digitized points. We then measured two kinds of geodesic distance (Wolfson & Schwartz, Reference Wolfson and Schwartz1989). (A geodesic distance is the shortest distance between two points on a curved surface. For a sphere, geodesics lie on great circles.) The first geodesic distance, to an Outer Density, is entirely on the (tiled) hybrid synaptic surface of the cone terminal (Fig. 2), from the apex of a central element (orange disc in Fig. 1B) to the center of an Outer Density (red contour) on the dendrites of an OFF midget bipolar cell. The second geodesic distance, to an Inner Density, is the sum of the distance on the tiled hybrid synaptic surface of the cone terminal from an orange disc to the nearest rim of the dendrite of the OFF midget bipolar cell (green disc) plus the distance on the tiled surface of the OFF midget bipolar cell dendrite from the rim point (green disc) to the center of the Inner Density (yellow bars).
We generated three-dimensional surfaces from the tiled wire-frame models of the hybrid synaptic surface (Meyers et al., Reference Meyers, Skinner and Sloan1992). To visualize these surfaces of cells, contacts, and densities, we used Geomview (http://www.geomview.org/) and rendered these objects with the Blue Moon Rendering Tools (http://en.wikipedia.org/wiki/Blue_Moon_Rendering_Tools). We also measured surface areas from the tiled surfaces. With SPSS 15.0 software, we ran Shapiro–Wilk tests for normality of distributions and Mann–Whitney U nonparametric tests to determine if distributions were significantly different.
All three cone types, L, M, and S, are presynaptic to OFF midget bipolar cells (Klug et al., Reference Klug, Herr, Ngo, Sterling and Schein2003) in macaque fovea. Fig. 1 of Schein et al. (2011) shows the locations of non-S-cone terminals #17 and #25, the foci of several figures in this paper, and S-cone terminal #35, for which some data are reported here.
Data from images
We scanned electron photomicrographs for figures with an Agfa scanner at 1200 dpi. Outside of linear adjustment for brightness and contrast in Adobe Photoshop 7.0, we did no retouching or other image manipulation.
Results
Inner Densities and Outer Densities
The basal surface of the synaptic terminal directly apposes the tips of dendrites of OFF midget bipolar cells, the green-filled dendrites in Fig. 1B. These basal contacts contain regions of membrane with symmetrically dense thickening, the red contour segments in Fig. 1B. The black arrows in Fig. 3A–3D point to examples of these Outer Densities at higher magnification.
Outer Densities (black arrows) and Inner Densities (white arrows) appear similar in cross section (A–D), but desmosome-like junctions (E–G) are denser and wider. These micrographs are all shown at the same magnification.

Dendrites of OFF midget bipolar cells also exhibit symmetric Inner Densities with similar appearance more proximally, along the sides of their dendrites (yellow contour segments in Fig. 1B). The white arrows in Fig. 3A–3D point to examples of these Inner Densities in the same figure as the Outer Densities. Visually, the thickness of a well–cross-sectioned Inner Density—its symmetrically thickened membranes, the cleft between its membranes, and its total width—appears to be the same as that of an Outer Density. By contrast, Outer and Inner Densities differ greatly in appearance from desmosome-like junctions that are farther inward in the outer plexiform layer (lower box in Fig. 1A; Fig. 3E–3G, at the same magnification as Fig. 3A–3D) (Haverkamp et al., Reference Haverkamp, Grünert and Wässle2000, Reference Haverkamp, Grünert and Wässle2001a; Puller et al., Reference Puller, Haverkamp and Grünert2007). The spans of the Outer and Inner Densities are considerably less than those of the desmosome-like junctions.
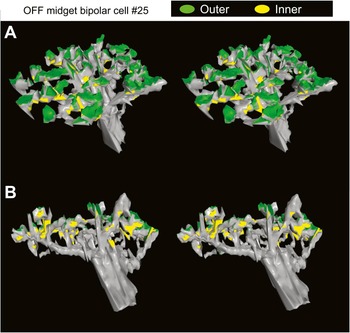
The two stereo views in Fig. 4, derived from reconstruction of the dendritic arbor of an OFF midget bipolar cell (#25), show the locations of basal contacts (harboring Outer Densities) versus Inner Densities at the scale of the whole dendritic arbor. Viewed mainly from the side but slightly above the horizontal plane (as from outer segments of photoreceptors), the dendritic arbor in Fig. 4A shows many of the basal contacts (green) that harbor Outer Densities but few of the Inner Densities (yellow). By contrast, when the same dendritic arbor is viewed from slightly below the horizontal plane (as from nuclei of bipolar cells) (Fig. 4B), few of the basal contacts (green) are visible, whereas many of the Inner Densities (yellow) can be seen. This OFF midget bipolar cell, with 49 basal contacts containing 68 Outer Densities, has a similar number (72) of Inner Densities, thus a total of 140 symmetric densities.
The crown-shaped dendritic arbor of OFF midget bipolar cell #25 has many basal contacts harboring Outer Densities and many Inner Densities. The placement of the stereopartners assumes convergent viewing. (A) This stereo view of the dendritic arbor from the side but slightly above the horizontal plane (outward within the retina, as from the photoreceptor outer segments) shows many basal contacts (green) and few Inner Densities (yellow). (B) This stereo view of the same dendritic arbor from the side but slightly below the horizontal plane (inward within the retina, as from the bipolar nuclei) shows few basal contacts (green) and many Inner Densities (yellow). This dendritic surface may be used to measure the distance along an inner cleft (filled arrowheads in Fig. 1B) from an Inner Density to the rim point (green disc in Fig. 1B) at the basal surface of the cone terminal.

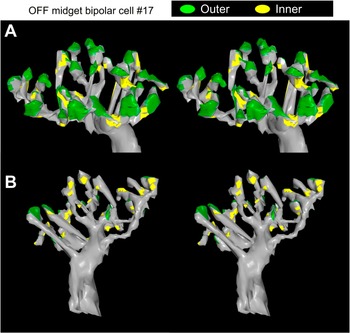
Similarly, the stereo views in Fig. 5A and 5B of the dendritic arbor of another OFF midget bipolar cell (#17) show primarily basal contacts (green) that harbor Outer Densities from a side view slightly above the horizontal and primarily Inner Densities (yellow) from a side view but tilted slightly below the horizontal. This OFF midget bipolar cell, with fewer (30) basal contacts containing fewer (41) Outer Densities, has a similar number (49) of Inner Densities, thus a total of 90 symmetric densities.

Differences between Outer and Inner Densities
Although Outer and Inner Densities look alike in their symmetric thickening and thickness, the average area of an Outer Density, 0.09 ± 0.05 μm2 (mean ± s.d.; N = 112), is approximately 3 times that of an Inner Density, 0.03 ± 0.02 μm2 (N = 123), for OFF midget bipolar cells postsynaptic to cone terminals #25 and #17 (Fig. 6). None of the four distributions in Fig. 6 is normal by Shapiro–Wilk tests; in light of the great difference in their average areas, it is not surprising that Mann–Whitney U nonparametric tests show that the areas of the Outer Densities between non-S cones and OFF midget bipolar cells #25 and #17 are different from those of Inner Densities (details of statistics in the legend of Fig. 6). The corresponding areas of the Outer and Inner Densities for the OFF midget bipolar cell postsynaptic to S-cone terminal #35, 0.11 ± 0.08 μm2 (N = 47) and 0.04 ± 0.03 μm2 (N = 49), are similar to those of non-S-cone terminals.
Outer Densities (filled bars) are larger in area [0.09 ± 0.05 μm2 (n = 109)] than Inner Densities (open bars) [0.03 ± 0.02 μm2 (n = 123)]. For the distributions of areas of 68 Outer and 74 Inner Densities of OFF midget bipolar cell #25 and for the distributions of areas of 41 Outer and 49 Inner Densities of OFF midget bipolar cell #17, Shapiro–Wilk statistics are 0.927, 0.710, 0.857, and 0.828, respectively, all corresponding to P < 0.0005; thus, none of the four distributions are normal. The distributions of areas of Outer Densities for #25 and #17 are not different [Mann–Whitney U statistic Z = −0.569, corresponding to P (two-tailed) = 0.569]. Likewise, the distributions of areas of Inner Densities for #25 and #17 are not different [Mann–Whitney U statistic Z = −1.209; P (two-tailed) = 0.227]. However, the areas of Outer Densities are greater than those of Inner Densities for both #25 (Mann–Whitney U statistic Z = −7.921; P < 10−6) and #17 [Mann–Whitney U statistic Z = −6.236; P (two-tailed) < 10−6].

Paths and distances to Outer and Inner Densities
As illustrated in Fig. 1A and 1B, to reach mGluR6 glutamate receptors along the sides of central elements and AMPA glutamate receptors in the basal contacts, glutamate released from presynaptic membrane near the presynaptic ribbon diffuses inward within the “neck” between the two lateral elements to reach the tip of the central element, where the path bifurcates over the two sides of the central element. For measurement of geodesic distance on the hybrid surface (Fig. 2), this point of bifurcation at the apex of the central element may be regarded as the “origin” or “source” of glutamate. These “apical points” are marked by orange discs in Fig. 1B.
In almost all cases, the basal contacts are in the triad-associated position, adjacent to central elements (fig. 7 of Schein et al., 2011). The diffusion path therefore follows the basal surface, toward the Outer Density within the basal contact. In order to measure the geodesic distances from the center of an Outer Density to the nearest apical point (orange disc) associated with a synaptic ribbon, we created hybrid synaptic surfaces like the one in Fig. 2 from hybrid synaptic contours like the one in Fig. 1. For cone terminal #25, the geodesic distance from the center of an Outer Density within a basal contact to the center of the nearest string of apical points atop a central element averages 0.85 ± 0.23 μm (N = 65) (Fig. 7A). For cone terminal #17, corresponding distances average 0.80 ± 0.24 μm (N = 41). These distances are not significantly different from each other (legend of Fig. 7A).
The geodesic distance from the apex of a central element to an Inner Density is slightly greater than that to an Outer Density. Released at an active zone associated with a synaptic ribbon (a yellow disc in Fig. 1B; a string of yellow spheres in Fig. 2), the diffusion path of glutamate runs down the neck (~0.15 μm) between a pair of lateral elements (Fig. 1A) to bifurcate at the string of points at the apex of the central element (an orange disc in Fig. 1B; a string of orange spots in Fig. 2). (A) From the apex of the central element, the path runs ~0.8 μm within the synaptic cleft over a central element (blue regions in Fig. 1B; blue and cyan regions in Fig. 2) to reach outer basal contacts (green regions in Fig. 2) harboring Outer Densities (red regions in Fig. 2). These two distributions of distances to Outer Densities are not normal (Shapiro–Wilk statistics of 0.821 for #25 and 0.854 for #17, both corresponding to P < 0.0005), and the distance distribution for #25 is not different from that for #17 (Mann–Whitney U statistic Z = −1.191; P = 0.233). (B) From the apex of the central element, the path runs ~1.2 μm within the synaptic cleft over a central element (blue regions in Fig. 1B; blue and cyan regions in Fig. 2), passes basal contacts with Outer Densities (green and red regions in Figs. 1B and 2), turns inward at a rim point (green disc in Fig. 1B), and continues down inner clefts (indicated by the black arrowhead in Fig. 1B) to reach an Inner Density (yellow contour segments in Fig. 1B). The distribution of distances to Inner Densities for #25 is normal (Shapiro–Wilk statistic of 0.972; P = 0.153) but that for #17 is not (Shapiro–Wilk statistic of 0.928; P = 0.003). The distance distribution for #25 is not different from that for #17 (Mann–Whitney U statistic Z = −1.589; P = 0.112).

To reach the Inner Density, a longer diffusion path continues past the basal contact to reach another bifurcation, the green disc in Fig. 1B, which marks the rim of the dendrite of the OFF midget bipolar cell where it is adjacent to the dendrite of a diffuse bipolar cell. At the bifurcation, the path runs inward, along the (inner) cleft between the two dendrites to the Inner Density.
The geodesic distance from the center of an Inner Density to the center of the nearest string of apical points atop a central element is thus the sum of that from the center of an Inner Density to a rim point (green disc in Fig. 1B), measured on reconstructions of the OFF midget bipolar cell (e.g., Figs. 5 and 6), and the geodesic distance from the rim point to the nearest apical point, measured on the hybrid surface of the cone terminal (e.g., Fig. 2). These distances, averaging 1.28 ± 0.40 μm for 72 Inner Densities on OFF midget bipolar cell #25 and 1.15 ± 0.38 μm for 49 Inner Densities on OFF midget bipolar cell #17 (Fig. 7B), are also not significantly different from one another (legend of Fig. 7B). Not surprisingly, these average distances to Inner Densities (1.28 and 1.15 μm), incorporating the extra leg along an inner cleft from the Inner Density to the rim point (Fig. 1), are significantly longer than those to Outer Densities (0.85 and 0.80 μm) (Z = −6.183, P < 10−6 for #25; Z = −4.772, P = 1 × 10⁻⁶ for #17 by Mann–Whitney U test).
Partners at Inner Densities
At a “typical” synapse, one would expect to find synaptic vesicles on the presynaptic side and synaptic densities on one or both sides. There are no synaptic vesicles on the presynaptic (cone terminal) side of the Outer Densities, so it is not surprising that we do not find synaptic vesicles at the site of the Inner Densities either. Nonetheless, if Inner Densities consistently marked the site of the synapse made by a specific presynaptic neuron onto the OFF midget bipolar cell dendrite, one would expect the partner neuron to be consistently one type of cell. For this reason, we identified the partner cells of the Inner Densities of three OFF midget bipolar cells by tracking them in the series of electron photomicrographs. Some Inner Densities were large enough to have more than one partner, so we identified more partners than Inner Densities.
As in the example in Fig. 1, most of the partners were diffuse bipolar cells (D in Figs. 1 and 8). (For this purpose, we did not distinguish OFF from ON diffuse bipolar cells.) In addition, a significant number of partners were the central elements of ON midget bipolar cells (ON in Fig. 8), fewer were horizontal cells (H), and only one was another OFF midget bipolar cell (OFF). It is likely that this distribution of partner dendrites simply reflects proximity: OFF midget bipolar cell dendrites rise in the outer plexiform layer to make basal contacts in the triad-associated position, next to the invaginating central elements provided by ON midget bipolar cell dendrites on the one side and next to dendrites of diffuse bipolar cells that rise to basal contacts in triad-associated and nontriad-associated positions on the other side. Thus, partner neurons are of diverse types. By contrast, the two partners of desmosome-like junctions are mainly horizontal cell dendrites (Haverkamp et al., Reference Haverkamp, Grünert and Wässle2000).
The neuronal partners of OFF midget bipolar cells at the sites of Inner Densities are diverse. We identified the 204 partners of 171 Inner Densities.

In addition, we find Inner Densities between pairs of dendrites that do not include an OFF midget bipolar cell dendrite. These sit between the same elements—the dendrites of diffuse bipolar cells, ON midget bipolar cells, and horizontal cells—that can partner with OFF midget bipolar cell dendrites. For these reasons, it seems unlikely that an Inner Density represents a synapse made by the partner neuron onto an OFF midget bipolar cell dendrite. Indeed, a symmetric (and therefore sign-preserving) synapse made by an ON bipolar cell partner would be of the “wrong” sign. Instead, if Inner Densities represented patches of glutamate receptors, the glutamate could come from the same source that supplies Outer Densities, namely, the active zones associated with synaptic ribbons.
Numbers of Inner Densities for two groups of non-S-cone OFF midget bipolar cells
In the companion paper (Schein et al., 2011), we reported results of reconstruction of 16 OFF midget bipolar cells postsynaptic to 16 non-S cones from high-magnification electron micrographs. These cone/OFF midget bipolar cell circuits appeared to be in two groups of eight, one group including #25 with large numbers of basal contacts and of Outer Densities, the other group including #17 with small numbers (Schein et al., 2011). Here, we report that the numbers of Inner Densities fall into the same two groups (Fig. 9). Within each group, the number of Inner Densities is weakly correlated with that of basal contacts (Fig. 9A, legend: R 2 = 0.12 for the group with small numbers, R 2 = 0.13 for the group with large numbers), and the number of Inner Densities is even less correlated with that of Outer Densities (Fig. 9B, legend: R 2 = 0.005 and 0.02). On the basis of these three uncorrelated or weakly correlated variables—numbers of basal contacts, Outer Densities, and Inner Densities—and the squared Euclidian distances between the points, the 16 cones were grouped into the same two clusters by hierarchical clustering with the between-group linkage procedure (Fig. 9C). The large (rescaled) distance to join the two clusters, compared to the distance to join the individual cones into each cluster, is strong evidence for two clusters, not one and not three or more.
Numbers of basal contacts (BC), Outer Densities (OD), Inner Densities (ID), and Outer + Inner (total) Densities (CD). Concentric symbols represent two instances of the same set of numbers. (A) Number of ID compared with that of BC. For the group with small numbers, #ID = 0.97 × #BC + 19.4 (R 2 = 0.12); for the group with large numbers, #ID = 0.42 × #BC + 54.5 (R 2 = 0.13). (B) Number of ID compared with that of OD. For the group with small numbers, #ID = −0.087 × #OD + 57.5 (R 2 = 0.005); for the group with large numbers, #ID = 0.087 × #OD + 68.2 (R 2 = 0.02). (C) On the basis of a hierarchical clustering analysis and taking into account the numbers of BC, OD, and ID, the rescaled dendrogram shows two clusters. (D) CD compared with number of BC. For the group with small numbers, #CD = 2.16 × #BC + 25.8 (R 2 = 0.39); for the group with large numbers, #CD = 1.33 × #BC + 79.1 (R 2 = 0.28).

Discussion
Inner Densities may represent clusters of glutamate receptors
The dendrites of OFF midget bipolar cells in the fovea of macaque retina exhibit Inner as well as Outer Densities. The Inner Densities are smaller in area; otherwise, the two kinds of densities are identical in appearance and dimension. Immunocytochemistry of macaque retina shows that several GluR subunits of the AMPA type of glutamate receptor are present in basal contacts in the triad-associated position, colocalized with the contacts of OFF midget bipolar cells (Haverkamp et al., Reference Haverkamp, Grünert and Wässle2001b; Puller et al., Reference Puller, Haverkamp and Grünert2007), consistent with findings of other basal contacts near central elements in other species (Nelson & Kolb, Reference Nelson and Kolb1983; Qin & Pourcho, Reference Qin and Pourcho1999; DeVries, Reference DeVries2000; Brandstätter & Hack, Reference Brandstätter and Hack2001; DeVries et al., Reference DeVries, Li and Saszik2006; Li & DeVries, Reference Li and DeVries2006). Inner Densities might harbor a different glutamate receptor. If the Inner Densities are indeed synaptic, then the three synaptic tiers of Haverkamp et al. (Reference Haverkamp, Grünert and Wässle2000)—central elements, basal contacts, and desmosome-like junctions—would increase to four. Alternatively, Inner Densities could have some other role in glutamate cycling, or they could even be simply structural. It would be helpful to know if they exist in the retinas of other mammals or outside of mammals.
In squirrel retina, different physiological types of OFF bipolar cell have different pharmacological types of glutamate receptors, with affinities that must be able to accommodate the concentrations and time course of glutamate found by receptors at different distances from the active zone (DeVries, Reference DeVries2000; DeVries et al., 2006). From a point source and diffusion in a disc, the volume into which a substance diffuses increases as the square of distance, so concentration falls as the square of distance. Following release at an active zone and diffusion down the neck between the two lateral elements, the concentration of glutamate ought to drop by a factor of 2 when its path bifurcates at the apex of a central element (orange disc in Fig. 1B) (Rao-Mirotznik et al., Reference Rao-Mirotznik, Buchsbaum and Sterling1998), assuming that glutamate diffuses just as readily down the two sides of the central element.
From the apical point, the distance to an Outer Density is ~0.8 μm, whereas the distance to an Inner Density is ~1.2 μm. Based on relative diffusion distances, the concentration of glutamate at the Inner Density should be about half (0.8/1.2)2 of that at the Outer Density. Moreover, the path to the Inner Density bifurcates a second time at the rim point (green disc in Fig. 1B), where the OFF midget bipolar cell dendrite (green filled in Fig. 1B) abuts a basal contact with a diffuse bipolar cell (gray filled, marked D, in Fig. 1B), so the concentration of glutamate ought to drop by another factor of 2, giving an overall reduction in glutamate concentration at an Inner Density as compared to an Outer Density by a factor of 4. (This calculation assumes that glutamate diffuses just as readily down the two paths and is not more rapidly taken up or bound in one or the other paths.) This factor might be enough to require different versions of the glutamate receptor with different affinities on the surface of the dendrite of the OFF midget bipolar cell at the two different sites.
Sampling the output of the cone
A foveal L- or M-cone ON midget bipolar cell provides ~16 of the ~20 central elements postsynaptic to a cone terminal (Herr et al., Reference Herr, Klug, Sterling and Schein2003; Schein et al., 2011). Among foveal L and M cones of macaque monkey, it is unusual for a ribbon synaptic unit (Migdale et al., Reference Migdale, Herr, Klug, Ahmad, Linberg, Sterling and Schein2003) to contain more than one central element, but when it does, the central elements are provided by different cells (e.g., one ON midget bipolar cell and one ON diffuse bipolar cell) (Herr et al., Reference Herr, Klug, Sterling and Schein2003). Therefore, each ON midget bipolar cell samples the output of the active zones associated with ~16 different ribbons. However, the number of mGluR6 glutamate receptor clusters is somewhat higher than 16: For some central elements, the asymmetrically dense regions on the two sides coalesce to give one cluster; for other central elements, the dense regions remain apart, giving two clusters.
Even though the total number of basal contacts onto an OFF midget bipolar cell is approximately two per ribbon (Fig. 9), some active zones are associated with none of these basal contacts (Fig. 2; fig. 8A of Klug et al., Reference Klug, Herr, Ngo, Sterling and Schein2003; fig. 7 of Schein et al., 2011), and only some central elements are adjacent to exactly two triad-associated basal contacts provided by an OFF midget bipolar cell (Schein et al., 2011). Each basal contact may contain more than one Outer Density, and when added to the number of Inner Densities—approximately equal to the number of Outer Densities—the total number of densities is ~100 or ~140 (Fig. 9D), many times the number of sampled active zones (~20).
By averaging over a large number of active zones, each of which independently reflects the membrane potential of the cone terminal, ON and OFF midget bipolar cells could average the quantal noise associated with the small number of quanta released at an individual active zone (Schein & Ahmad, Reference Schein and Ahmad2005, Reference Schein and Ahmad2006). This mechanism would be expected to reduce quantal noise by the square root of number of sampled active zones.
The number of glutamate receptors is finite, and the number of collisions of glutamate molecules with glutamate receptors is finite, both factors potentially adding noise to measurement of glutamate concentration. The concentration of glutamate is higher at the receptor clusters on ON midget bipolar cells lining the central element, so those clusters of lower affinity metabotropic glutamate receptors might make do with fewer glutamate receptors. The lower concentration at more distant clusters on OFF midget bipolar cells might require more ionotropic glutamate receptors, presumably provided by their larger number of receptor clusters, as well as receptors with higher affinity for glutamate.
The diffusion time for glutamate to reach Outer Densities, slightly less than 1 μm away from the apex of the central element, is roughly 1 ms, only slightly less than that of the glutamate that reaches Inner Densities, slightly more than 1 μm away. The small difference is likely to be inconsequential, but it may slightly stretch out the time course of the response in OFF midget bipolar cells (DeVries, Reference DeVries2000; DeVries & Saszik, 2006).
Acknowledgments
We thank Vanessa Preciado for help with figures; Dr. Yoshihiko Tsukamoto, Patricia Masarachia, and Sally Shrom for preparing the electron microscope material; and Kazuki Uema and Lisa Travis for printing. S.S., K.K., I.T.N., and T.M.H. were supported by the NIH grant EY11153 and by a grant from the UCLA Academic Senate; P.S. was supported by the NIH grant EY08124; S.H. was supported by the National Institute of Mental Health Training grant MH15795-18 and NIH grant EY11153.