INTRODUCTION
Wheat (Triticum aestivum L.) is the most important crop in the world with a total production of 671 million metric tons in 2012 (FAOSTAT 2015). It is estimated that the average global wheat yield need to increase from 2·8 t/ha in 2005/07 to 3·8 t/ha in 2050 for future food security in the world (He et al. Reference He, Xia, Peng and Lumpkin2014). Meanwhile, global mean surface air temperature is predicted to increase by 2·0–5·4 °C by the end of this century (IPCC 2007). Warming is anticipated to be most likely during the seasons when wheat is typically grown (Easterling et al. Reference Easterling, Horton, Jones, Peterson, Karl, Parker, Salinger, Razuvayev, Plummer, Jamason and Folland1997): thus, even moderate warming is likely to affect wheat production greatly. Crop breeding has been recommended as an effective adaptation strategy to climatic warming for crop production (Lobell et al. Reference Lobell, Burke, Tebaldi, Mastrandrea, Falcon and Naylor2008; Ronald Reference Ronald2011). Thus, learning the differences in warming impacts on wheat growth between old varieties and new ones can provide important information to assist advances in wheat breeding and agronomic innovation.
Great efforts have been made in recent years to understand the mechanisms underlying the contributions of crop breeding to the enhancement of crop resilience and adaptability to global warming. Combing observed records with crop modelling, Liu et al. (Reference Liu, Wang, Yang and Wang2010) speculated that historical genetic improvement might have mitigated the warming-led reductions in the length of wheat and maize growth periods, consequently maintaining or even enhancing crop yields in the North China Plain. Based on historical data analysis, Chen et al. (Reference Chen, Qian, Deng and Zhang2012) also thought that warming-led increases in rice and maize yields were mainly attributed to the genetic improvement in the length of crop growth period in Northeast China. According to crop modelling and field experiment observations, Chen et al. (2013) found that modern maize hybrids showed less reduction in yield potential under a warming climate than old cultivars in Northeast China. These studies suggest that genetic improvement may have mitigated the negative impacts of warming on crop production. Since warming can reduce the low temperature limitations to crop growth and development, recent evidence from field experiments has shown that predicted warming might have benefited winter wheat production (Hou et al. Reference Hou, Ouyang, Li, Wilson and Li2012; Tian et al. Reference Tian, Chen, Chen, Deng, Song, Zheng, Hoogmoed and Zhang2012; Fang et al. Reference Fang, Su, Liu, Tan and Ren2013). Thus, crop breeding might have simultaneously enhanced the ability of wheat to exploit the positive effects rather than only mitigating the negative impacts of warming on wheat growth. To date, however, convincing evidence from field experiments is still lacking.
China is one of the largest countries in terms of wheat production and consumption, and the North China Plain is the major region of wheat cropping in the country. The mean air temperature in the plain has increased by >0·8 °C during the last 20 years and is predicted to further increase by c. 1–1·5 °C by 2050 (Cheng et al. Reference Cheng, Liu and Ma2011). The sowing date of winter wheat has been delayed by 1·5 days/decade and the length of the growth period has been shortened by 3·1 days/decade in the North China Plain for the period 1981–2009 (Xiao et al. Reference Xiao, Tao, Liu, Shi, Wang, Liu, Zhang and Zhu2013); despite this, wheat grain yield has increased by 162·4% since 1980, and hundreds of new wheat varieties with high biotic and abiotic adaptabilities have been approved and released in this region (Zheng et al. Reference Zheng, Zhang, Yin, Wang, Han, Chen, Huang, Tang, Xia and He2011). However, little is known about the contributions of crop breeding to the enhancement of wheat adaptability to warming under field conditions. Therefore, a warming experiment using a free-air temperature increase (FATI) facility with ten leading wheat varieties was initiated under field conditions. The tested varieties were approved and released during 1950–2009 in the North China Plain. The objectives of the present study were to detect the differences in warming impacts on wheat phenology and productivity among the different varieties, so as to learn the contributions of historical breeding to wheat adaptability to global warming.
MATERIALS AND METHODS
Experimental site
The experiment was conducted in Xinxiang county, Henan Province, China (35°18′N, 113°54′E, 95 m asl), in the centre of the North China Plain, the major region of Chinese winter wheat cropping area. The current experiment was performed with a FATI facility from October 2011 to June 2012. The FATI facility, which has been widely used to study plant responses to warming at the ecosystem scale (Wan et al. Reference Wan, Luo and Wallace2002), was designed according to a previous experiment conducted in East China (Tian et al. Reference Tian, Chen, Chen, Deng, Song, Zheng, Hoogmoed and Zhang2012). The mean annual precipitation of the experimental site is 656·3 mm (with 246·6 mm during the winter wheat growing season), and mean annual air temperature is 14·0 °C with 2400 sunshine hours and 220 frost-free days. The soil is a cumulated irrigated fluvo-aquic soil in the soil taxonomy classification system of the USA (Soil Survey Staff 1999). Relevant soil properties such as organic matter content, pH, total N, available N, available P and available K were 22·1 g/kg, 7·7, 1·1 g/kg, 117·0 mg/kg, 29·2 mg/kg and 113·1 mg/kg, respectively.
Experimental design and treatments
The experimental design was a split-plot with three replications. Main plots consisted of warmed (W) and non-warmed (NW), while sub-plots consisted of ten leading varieties of winter wheat released during 1950 to 2009 in the experimental area (Table 1). Two leading varieties from each era were selected for the study (Table 1). The varieties were planted in a randomized complete block design. The split-plot design is applicable here because the sampling area had uniform and reliable warming effects. In order to compare the differences in warming impacts on wheat varieties among eras, the varieties released during 1950–1989 were classified as old varieties, while those released during 1990–2009 were classified as new varieties in the present study.
Warming effects on the actual air temperatures of wheat canopy in the warmed and the non-warmed plots under the FATI facility

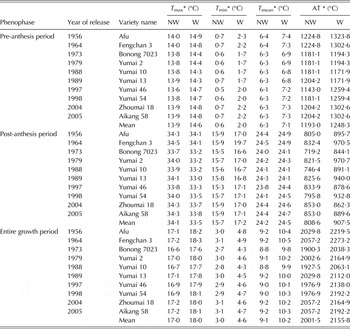
* T max, T min, T mean and AT represent average values of the actual daily maximum temperature, daily minimum temperature, daily mean temperature and accumulated temperature (>0 °C), respectively.
One 1500 W infrared heater (180 cm long and 20 cm wide; Jiangsu Tiande Special Light Source Co., Ltd., China) was suspended 1·5 m above the field surface in every warmed plot. A ‘dummy’ heater of the same size as the infrared heater was suspended at the same height in every non-warmed plot to imitate the potential shading effects caused by the heater. In order to avoid heat contamination, the distance between warmed plots and non-warmed plots was 5 m. The treatment was conducted from sowing to harvest, therefore covering the entire growth period.
Crop management
Wheat seeds of the tested varieties were sown on 19 October 2011, following the recommended density of 180 plants/m2 and maintaining spacing of 20 cm between rows. Fertilizers were used for each treatment at the rate of 240 kg N/ha, 120 kg P2O5 /ha and 100 kg K2O /ha, respectively. All P and K fertilizers and half of the N fertilizer were applied as basal dressing 2 days prior to sowing. The remaining N fertilizer was added as a side dressing at the jointing stage, i.e. growth stage (GS) 31 (Zadoks et al. Reference Zadoks, Chang and Konzak1974). Common irrigation and other agronomic managements were also provided in all treatments with the same regime. Due to the irrigation, there was no soil moisture limitation to wheat growth in any plot.
Sampling and measurement methods
Temperatures and soil moisture monitoring
During the entire growth period, air and soil temperatures were monitored at 30 min intervals using a digital monitoring system (ZDR241, Hangzhou Zheda Electronic Instrument Co. Ltd., China). Two temperature monitors were positioned in the centre of the plot, under the infrared and dummy heaters: one in the canopy and one 5 cm deep in the soil. Soil samples were collected from surface layers (0–5 cm and 5–10 cm) of each treatment at wheat anthesis (GS64) and maturity (GS93). Five cores (2·5 cm in diameter) were taken from each replicate plot and mixed to form one composite sample. The composite samples were weighed wet, dried for 48 h in a fan-assisted oven set at 105 °C and weighed again to determine the soil water content (Ferraro & Ghersa Reference Ferraro and Ghersa2007).
Plant sampling and determinations
At anthesis, plant samples of 0·1 m2 were taken for determination of dry matter production and green leaf area. Flag leaf area per stem (FLA) was calculated using the following formula (Zhao Reference Zhao1986; Li et al. Reference Li, Kang and Zhang2004):
 $$FLA = \displaystyle{ \eqalign{&\{ [ \left( {{L_1} \times {B_1}} \right) + \left( {{L_2} \times {B_2}} \right) + \ldots + \left( {{L_{n - 1}} \times {B_{n - 1}}} \right) \cr &\quad + {\left( {{L_n} \times {B_n}} \right) ] \times 0 {\cdot} 75} \} } \over n}$$
where L and B are the length and breadth of flag leaf, respectively, n is the total number of leaves harvested and 1, 2, 3, … n−1 and nth leaf.
After maturity, 0·2 m2 plants were harvested for determination of total biomass production, grain yield and yield components.
Statistical analysis
Analysis of variance (ANOVA) for a split-plot design was used to examine the effects of warming, varieties and their interaction in the experiment. The means were compared using Least Significant Differences (LSD) and significant differences were determined at P < 0·05. All statistical analyses were conducted using SPSS 13.0 statistical software (SPSS Inc, Chicago, IL, USA).
RESULTS
Warming effects of the free-air temperature increase facility
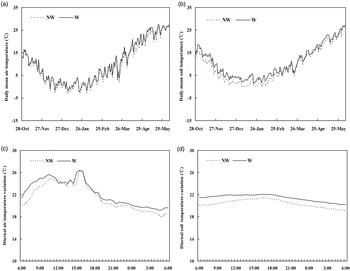
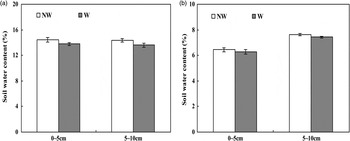
According to the similar seasonal variations in daily mean air temperature on the wheat canopy and soil temperature at the 5 cm layer between the warmed and non-warmed plots (Figs 1(a) and (b)), the field warming facility was stable and mimicked the local climate pattern well. Similar trends for diurnal variations of air temperature and soil temperature were also found between warmed and non-warmed plots (Figs 1(c) and (d)). Although this warming reduced soil water content at the surface layers of 0–5 cm and 5–10 cm by 4·4 and 5·2% at the anthesis stage (Fig. 2(a)) and by 2·1 and 2·3% at the maturity stage (Fig. 2(b)), respectively, the reductions were not significant compared with the non-warmed treatment. The warming impacts on the temperatures and soil moisture indicate that the FATI facility was suitable for studying winter wheat responses to climatic warming under field conditions in North China Plain.
Seasonal variation of daily mean air temperature on wheat canopy (a) and daily mean soil temperature at 5 cm layer (b), and diurnal variation of air temperature on wheat canopy (c) and soil temperature at 5 cm layer (d) in the warming (W) and non-warmed (NW) plots. The diurnal variations were monitored at anthesis.

Soil water contents at 0–5 cm and 5–10 cm layer at anthesis (a) and at maturity (b) in the warming (W) and non-warmed (NW) plots. Data are means ± 1 s.e.

Over the entire growth period, the FATI facility increased the daily maximum temperature (T max), minimum temperature (T min), mean temperature (T mean) and accumulated temperature (AT, >0 °C) in the wheat canopy by an average of 1·0, 1·6, 1·1 and 154·3 °C, respectively (Table 1). According to the actual air temperatures in the wheat canopy, T min was higher during pre- and post-anthesis in the warmed plots than the non-warmed plots. However, the T max was higher during the pre-anthesis period and lower during the post-anthesis period in the warmed plots than the non-warmed plots.
Warming impacts on wheat phenology
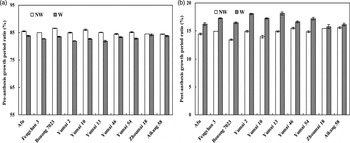
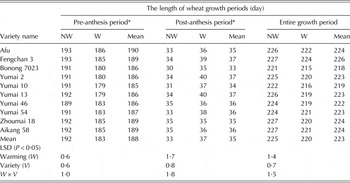
Significant differences were found in the impacts of warming on the length of wheat growing period between the pre- and the post-anthesis periods (Table 2). For all the varieties tested, warming significantly (P < 0·05) advanced the anthesis and maturity dates, resulting in large reductions in the lengths of the pre-anthesis period and the entire growth period, by an average of 9 and 5 days, respectively. Warming-led reductions in the length of pre-anthesis were 10 and 7 days for the old varieties (released during 1950–1989) and new ones (released during 1990–2009), respectively. Interestingly, warming significantly (P < 0·05) prolonged the length of the post-anthesis period, by an average of 5 and 2 days for the old varieties and new ones, respectively. There was no significant difference in the change of the entire growth period caused by warming among old and new varieties, and there was no obvious trend in the warming-led reductions in the length of wheat growth period. Moreover, there were differences in the percentage ratios of pre- and post-anthesis growth periods to the entire growth period among varieties (Fig. 3). Generally, the ratio of pre-anthesis growth period to the entire growth period decreased along with variety release year (Fig. 3(a)), while that of the post-anthesis growth period increased along with variety release year, according to the data of non-warmed treatments (Fig. 3(b)).
The percentage ratios of pre-anthesis period length (a) and post-anthesis period length (b) to the entire growth period for the tested varieties released during different eras. W, warming; NW, non-warmed. Data are means ± 1 s.e.

The length of wheat growth periods in the warming (W) and non-warmed (NW) plots under the FATI facility

* Pre-anthesis period is from the sown date to the anthesis, and post-anthesis period is from the anthesis to the maturity.
Warming impacts on leaf area
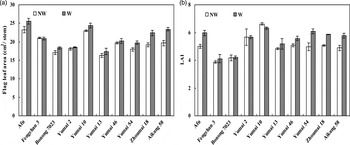
The differences in flag leaf size and post-anthesis green leaf area among the treatments are presented in Fig. 4. Warming improved leaf growth for all the varieties tested, though there were significant (P < 0·05) differences in the size of the effect among varieties. For all the varieties tested, warming enlarged flag leaf area by 7·9% (Fig. 4(a)), and increased post-anthesis leaf area index by 9·2%, on average (Fig. 4(b)). For old varieties, warming had no significant effect on the flag leaf area and leaf area index. However, warming significantly (P < 0·05) increased the flag leaf area and leaf area index, by 12·0 and 16·7% on average, in the new varieties.
Flag leaf area (a) and post-anthesis leaf area index (b) in the warming (W) and non-warmed (NW) plots. Data are means ± 1 s.e.

Warming impacts on biomass production
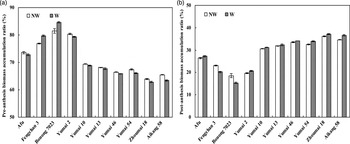
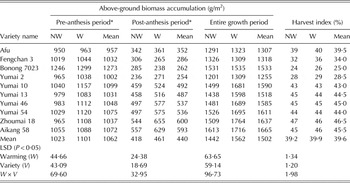
Experimental warming tended to increase accumulation of above-ground biomass during pre-anthesis and post-anthesis phases (Table 3). For all the varieties tested, the above-ground biomass accumulation during the pre-anthesis and post-anthesis phases were, on average, 7·6 and 10·1% higher in the warmed plots than non-warmed treatments, respectively. As a result, warming increased the total above-ground biomass by an average of 8·4% (i.e. 120·6 g/m2, P < 0·05). Warming-led increments in the pre-, post- and total above-ground biomass accumulations were 6·2, 2·8 and 5·6%, respectively, for the old varieties and 10·0, 16·3 and 12·1% for new ones. Meanwhile, warming-led increases in the above-ground biomass showed increasing trends with variety release year, and warming-led increases in above-ground biomass by, on average, 47·6 g/m2 per era. Based on the data of non-warmed treatments, historical variety improvement has significantly (P < 0·05) enhanced winter wheat biomass production (Fig. 5). Moreover, biomass accumulation was obviously different during pre- and post-anthesis periods. The ratio of pre-anthesis biomass accumulation decreased along with variety release year (Fig. 5(a)), while the ratio of post-anthesis biomass accumulation increased along with variety release year (Fig. 5(b)).
The percentage ratios of pre-anthesis biomass accumulation (a) and post-anthesis biomass accumulation (b) to the entire growth biomass accumulation for the tested varieties released during different eras. W, warming; NW, non-warmed. Data are means ± 1 s.e.

Wheat above-ground biomass accumulations during the pre- and post-anthesis periods and harvest index in the warming (W) and non-warmed (NW) plots under the FATI facility

* Pre-anthesis period is from the sown date to the anthesis, and post-anthesis period is from the anthesis to maturity.
Warming impacts on wheat yield
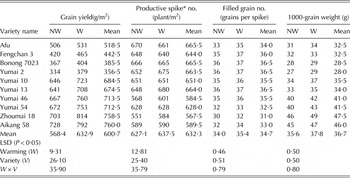
Positive effects of warming on grain yield, filled grain number and 1000-grain weight were found for all the varieties tested, while the impacts on productive spike number were not consistent (Table 4). For all varieties, warming significantly (P < 0·05) increased the filled grain number and the 1000-grain weight (by an average of 1·4 grains per spike and 2·3 g, respectively), resulting in a large average increase in grain yield of 11·4% on average (i.e. 64·6 g/m2, P < 0·05). Warming-led enhancement in the 1000-grain weight contributed most to the increase in grain yield. Warming-led increments in the grain yield were 10·3% for the old varieties and 12·7% for the new ones. Meanwhile, warming-led increases in the grain yield showed increasing trends with variety release year, and warming-led increases in grain yield increased by an average of 15·3 g/m2 per era.
Wheat grain yield and its components in the warming (W) and non-warmed (NW) plots under the FATI facility

* Productive spikes are the plants carrying grain at final harvest.
DISCUSSION
Some studies have shown that increasing air temperature may help crop biomass production and grain yield through mitigating low temperature limitations to plant vegetative development (Lobell Reference Lobell2007) and promoting the rate of photosynthesis in leaves (Turnbull et al. Reference Turnbull, Murthy and Griffin2002). In previous experiments under field conditions, significant increments in winter wheat productivity caused by warming were found in East China (Tian et al. Reference Tian, Chen, Chen, Deng, Song, Zheng, Hoogmoed and Zhang2012) and in North China (Chen et al. Reference Chen, Tian, Zhang, Zheng, Song, Deng and Zhang2014). However, other researchers predicted that warming might decrease crop yield due to warming-led reduction in crop growth duration (Lobell et al. Reference Lobell, Schlenker and Costa-Roberts2011; Wang et al. Reference Wang, Wang, Yang, Zhang and Yin2012). Since the number of varieties tested in previous studies was limited (Porter & Gawith Reference Porter and Gawith1999; Chavas et al. Reference Chavas, Izaurralde, Thomson and Gao2009), the previous findings might not fully represent the actual impacts of warming on winter wheat growth in China. Thus, the current experiment was conducted with ten leading varieties released since 1950. Although warming caused a significant reduction in the length of the wheat growth period, it increased wheat plant biomass production and grain yield significantly for all ten varieties. Similarly, other recent studies have also shown that predicted warming is likely to benefit winter wheat cropping in North China (Hou et al. Reference Hou, Ouyang, Li, Wilson and Li2012; Fang et al. Reference Fang, Su, Liu, Tan and Ren2013) and Central Asia (Sommer et al. Reference Sommer, Glazirina, Yuldashev, Otarov, Ibraeva, Martynova, Bekenov, Kholov, Ibragimov, Kobilov, Karaev, Sultonov, Khasanova, Esanbekov, Mavlyanov, Isaev, Abdurahimov, Ikramov, Shezdyukova and De Pauw2013), if there is no soil moisture limitation.
Based on a large field experiment, Ottman et al. (Reference Ottman, Kimball, White and Wall2012) summarized that wheat response to warming might depend on the background temperature and soil moisture conditions. Theoretically, the length of pre-anthesis period is mainly related to the accumulated temperature (AT) and the daily minimum temperature (T min), whereas post-anthesis length is more related to the daily maximum temperature (T max) (Slafer & Rawson Reference Slafer and Rawson1995; Porter & Gawith Reference Porter and Gawith1999). The optimum daily mean temperatures (T mean) are c. 15 and 20 °C for wheat development and growth during the pre- and post-anthesis periods, respectively. Temperatures below the optimum can delay anthesis, while temperatures>25 °C can force grain into maturing early (Slafer & Rawson Reference Slafer and Rawson1995; Shah & Paulsen Reference Shah and Paulsen2003; Liu & Kang Reference Liu and Kang2006). If daily mean temperature during the crop growing season is below the optimum c. 15 °C for wheat growth, a moderate increase in air temperature can benefit wheat growth if soil moisture is not limiting. At the current experimental site, the mean air temperature during winter wheat growing seasons is below 10 °C, and the wheat fields are irrigated. Therefore, a temperature increase of just 1·1 °C for an entire growth period of winter wheat could mitigate the low temperature limitation and increase the AT required for anthesis, resulting in a significant reduction in the length of the pre-anthesis period. On the other hand, early flowering in warmed plots caused decreases in post-anthesis T max. Consequently, this moderate increase in air temperature can shift the post-anthesis phase to more optimal temperature conditions (Porter & Gawith Reference Porter and Gawith1999), resulting in an extension of the post-anthesis period for grain filling an important requirement for increased yield.
Moreover, both pre-anthesis frost/chilling and post-anthesis high temperatures occur frequently, constraining winter wheat growth in this region (Shah & Paulsen Reference Shah and Paulsen2003; Liu & Kang Reference Liu and Kang2006; Lobell & Ortiz-Monasterio Reference Lobell and Ortiz-Monasterio2007; Zhong et al. Reference Zhong, Mei, Li, Yoshida, Zhao, Wang, Han, Hu, Huang, Huang and Sun2008). The main reason for the positive effects of predicted warming on wheat production can probably be attributed to the moderate level of warming and its mitigation effects on low temperature limitation to wheat growth. Firstly, warming by 1·1 °C for an entire growth period could not increase air temperature to the heat stress level for wheat grain filling during post-anthesis phase, however, this warming could shift the filling period to a time with more optimal temperature conditions, due to earlier anthesis. Secondly, this warming can relieve low temperature limitation to wheat plant development, which is evidenced by warming-led increases in the flag leaf area and post-anthesis green leaf area for all varieties tested in the present study. In previous experiments under field conditions, there were no significant effects on the rate of flag leaf photosynthesis among warmed and non-warmed treatments, while warming significantly increased the flag leaf area and total area of green leaves at anthesis (Tian et al. Reference Tian, Chen, Chen, Deng, Song, Zheng, Hoogmoed and Zhang2012, Reference Tian, Zheng, Chen, Chen, Deng, Song, Zhang and Zhang2014). Since these leaves are the most important organs for post-anthesis biomass production and grain filling (Bonnett & Incoll Reference Bonnett and Incoll1992; Ntanos & Koutroubas Reference Ntanos and Koutroubas2002), warming-led positive effects on wheat leaves can greatly enhance biomass production and grain yield. Meanwhile, shifting anthesis forward by 9 days due to warming advanced the post-anthesis period to a time with relatively lower maximum temperatures as compared to the non-warmed control. Thus, warming-led earlier anthesis might have indirectly mitigated rather than worsened the high temperature limitation to grain filling, which is partially confirmed by the significantly higher values of grain weight.
Some studies have shown that breeding might have increased crop adaptability to climate change through mitigating warming-led reductions in the crop growth period (Chapman et al. Reference Chapman, Chakraborty, Dreccer and Howden2012; Chen et al. Reference Chen, Chen, Chen, Gao, Yang, Yuan, Zhang and Mi2013; Liu et al. Reference Liu, Zhu, Tang, Cao and Wang2013). Other studies have reported that crop breeding might have enhanced crop adaptability through improving crop resistance to biotic and abiotic stresses (Zhang et al. Reference Zhang, Chen, Liu, Pei and Sun2005; Tanien et al. Reference Tanien, Samonte and Mcclung2008). In the present study, warming caused a significant reduction in the length of the entire growth period for all varieties of wheat tested, and no significant differences in the reduction were found among varieties. There has been no obvious prolongation of the length of the entire wheat growth period during past decades, suggesting that crop breeding might have not mitigated the warming-led reduction in wheat growth duration in the North China Plain. However, wheat biomass production and grain yields were all significantly increased by warming for all the tested varieties, and the warming-led increments increased along with the variety release year. Moreover, the warming-led increments in post-anthesis biomass production and 1000-grain weight contributed most to the warming-led increases in biomass production and grain yield, and wheat biomass production and grain yield were significantly higher in the new varieties than the old ones. The ratios of post-anthesis period length increased significantly along with the variety release eras. The current results indicate that historical breeding might have helped wheat exploit warming-led positive effects on post-anthesis growth in the North China Plain.
In a summary, the results indicated that new wheat varieties have higher adaptability to recent and future warmer climates, and an active adaptation to global warming might have occurred through variety breeding during the past decades in the North China Plain. Theoretically, increasing air temperature could affect crop production positively or negatively. The main potential negative impact of warming is shortening the length of plant growth period, and the major potential positive effect is mitigating low temperature limitation to plant development and growth. At the present study site, warming caused a large reduction in the entire wheat growth period with a great increment in wheat productivity for all the varieties tested, released in different eras. The warming-led increment in productivity increased significantly along with variety release year, while there was no obvious trend in the warming-led reduction in wheat growth period among the eras. According to the data of the non-warmed treatments, crop breeding did not prolong the length of wheat growth period during recent decades. However, wheat productivity (i.e. biomass production and grain yield) showed a great increasing trend during 1950–2009. The present study demonstrates that historical crop breeding may have benefited winter wheat, exploiting the positive effects of warming on wheat plant development. The present findings can give important references to the assessment of warming impacts on wheat production in China and East Asia. Future efforts need to be focused on wheat breeding and agronomic innovation to make full use of warming-led positive effects rather than to only avoiding or mitigating the negative impacts.
This work was supported by the National Basic Research Program of China (2010CB951501), the National Key Technology Support Program of China (2011BAD16B14), the Chinese Nature Science Foundation (31201179, 30771278) and the Innovation Program of Chinese Academy of Agricultural Sciences. We are grateful to Dr Mannaf and Dr Islam for their constructive suggestions and revision on this manuscript.