





1. Introduction
Shark dermal scales exhibit notable distinctions from those found in bony fish. They are tiny (0.2–0.5 mm in size, figure 1) and display considerable variation in shape and size (Reif Reference Reif1985). These unique structures, known as shark denticles, are believed to have the ability to reduce drag, consequently enhancing cruising efficiency and burst speed when hunting prey. The exploration of denticles’ hydrodynamic functions can be traced back to the early 1980s (Bechert, Hoppe & Reif Reference Bechert, Hoppe and Reif1985; Reif Reference Reif1985) and has progressed in tandem with efforts to visualize, characterize and control turbulent wall-bounded flows. While the streamwise-oriented ridges on their crown resemble the recognized drag-reducing riblets, researchers have not agreed upon the mechanisms of the hydrodynamic advantages of shark skin. Experimental tests with real shark skin rarely show drag reduction for boundary layer flows (Bechert et al. Reference Bechert, Hoppe and Reif1985; Oeffner & Lauder Reference Oeffner and Lauder2012). Similarly, recent direct numerical simulations (DNS) of turbulent channel flow over shark denticle replicas reported an increase in drag (Boomsma & Sotiropoulos Reference Boomsma and Sotiropoulos2016; Lloyd et al. Reference Lloyd, Mittal, Dutta, Dorrell, Peakall, Keevil and Burns2023; Wu & Savino Reference Wu and Savino2023).
Bonnethead shark (Sphyrna tiburo) denticles from near the anal fin. The prevailing direction of flow over these denticles is from left to right. Reproduced with permission from George Lauder. Copyright 2014, Lauder Laboratory, Harvard University (Wen, Weaver & Lauder Reference Wen, Weaver and Lauder2014).

Meanwhile, there has been a growing interest in investigating the potential of shark denticles to mitigate pressure drag by influencing flow separation. A series of studies by Lang and collaborators (Lang et al. Reference Lang, Motta, Hidalgo and Westcott2008, Reference Lang, Motta, Habegger, Hueter and Afroz2011; Santos et al. Reference Santos, Lang, Wahidi, Bonacci, Gautam, Devey and Parsons2021) focused on the denticle's ability to bristle (i.e. rotate up about its base in the epidermis such that the trailing edge flares outward into the flow), hypothesizing that bristling activated by reversed flow enhances turbulent transport of momentum. Evans et al. (Reference Evans, Hamed, Gorumlu, Doosttalab, Aksak, Chamorro and Castillo2018) and Doosttalab et al. (Reference Doosttalab, Dharmarathne, Evans, Hamed, Gorumlu, Aksak, Chamorro, Tutkun and Castillo2018) simplified the denticles as diverging pillars and placed an array of them on the lee sides of an expanding channel and an airfoil. They observed a delayed separation and a reduced separation region. It was hypothesized that a forward pore flow between the pillars creates local unsteady suction and blowing. However, the lack of data in the immediate vicinity of the denticles hinders conclusive proof of the hypotheses in these studies.
While the mechanisms underlying the modulation of separation by shark denticles remain unclear, studies have actively explored the impact of these structures on aerodynamic performance in various engineering applications. Denticle crown arrays (Wen et al. Reference Wen, Weaver and Lauder2014; Domel et al. Reference Domel, Saadat, Weaver, Haj-Hariri, Bertoldi and Lauder2018b; Guo et al. Reference Guo, Zhang, Yasuda, Yang, Galipon and Rival2021), real shark skin (Oeffner & Lauder Reference Oeffner and Lauder2012; Santos et al. Reference Santos, Lang, Wahidi, Bonacci, Gautam, Devey and Parsons2021) and sparsely distributed denticle replicas used as vortex generators (Arunvinthan et al. Reference Arunvinthan, Raatan, Nadaraja Pillai, Pasha, Rahman and Juhany2021; Chen et al. Reference Chen, Du, Li, Lv and Duan2023) have been applied to various separating flows. Diverse or contrasting results in the lift and/or drag have been observed. These studies often lacked an explanation for the observed changes in performance, possibly due to the difficulties in obtaining detailed flow measurements around and below the denticles. In this study we employ DNS to investigate the role of denticles during flow separation. In particular, we consider the complete denticle geometry including the neck. The simulation produces high-fidelity data on the local production of drag/thrust and flow fields at the sub-denticle scales. Correlations between the hydrodynamic performance indicators and the flow statistics are used to understand the physical mechanisms of drag modulation by shark denticles.
The paper is organized as follows. We first present the methodology and configuration in § 2. Mean velocity fields are compared in § 3.1 between a smooth bump and a bump covered with denticles, highlighting a reverse flow in the porous region formed by denticle necks under the crown. Correlations are then made between the reverse pore flow and the generation of a thrust in § 3.2. We proceed to discuss how this reversed pore flow is generated and sustained in § 3.3. Then in § 4 the necessity of having both the crown and the neck is justified by additional simulations with partial denticles, and the pore flow is discussed by Darcy flow characteristics. Finally, the concluding discussion and remarks are given in § 5.
2. Methodology
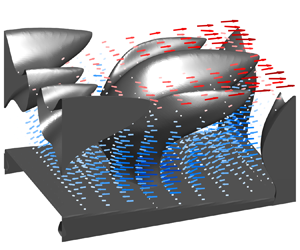
We perform DNS of turbulent channel flows with a parabolic bump placed on the bottom wall to induce flow separation. This configuration has been utilized in our previous studies of flow separation (Savino, Patel & Wu Reference Savino, Patel and Wu2023); thus, the behaviours of separation, reattachment and drag production for the smooth bump are well understood. Specifically, the separation point on the lee side of the parabolic bump can be modulated by flow conditions rather than occurring at a fixed point. This characteristic allows us to explore whether shark denticles delay or promote flow separation. The simulation is performed at  $Re = U_bH/\nu = 2500$. Here,
 $H$ is the channel half-height and
 $U_b$ is the bulk velocity. Without the bump and denticles, the channel flow yields a friction Reynolds number
 $Re_\tau = u_\tau H/\nu = 160$ (
 $u_\tau$ is the friction velocity). The bump is defined by
 $y=-a(x-4.0)^2 + h$, where
 $x$ and
 $y$ are streamwise and wall-normal coordinates. The two parameters are
 $a = 0.15$ and the bump height
 $h=0.25H$ (figure 2a).
(a) Computational configuration. An instantaneous flow field of case DT is shown, visualized by the isosurfaces of the second invariant of the velocity-gradient tensor and coloured by the distance from the bottom wall. Inset, three-dimensional (3-D) model of the shark denticle (Wen et al. Reference Wen, Weaver and Lauder2014). (b–d) Top and side views of the bump and denticle array.

Two primary simulations are performed and compared to clarify the roles of denticles. The smooth bump is used in case SM. The lee side of the bump is covered by a staggered array of stationary shark denticles in case DT. The decision to only cover the lee side of the bump is because the adverse pressure gradient (APG) here is more relevant to separating flows than the favourable pressure gradient (FPG) over the wind side, and a significant reduction in computation cost is achieved by covering only the former.
What differentiates our denticle array from previous studies are: first, the denticles do not protrude into the flow. In case DT the lee side of the bump is indented by the height of the denticles. This ensures that the crests of the denticles align precisely with the contour of the smooth bump in case SM, rather than protruding into the flow and introducing a vertical offset of the fluid and an extended streamwise recovery. The current treatment to indent the denticles is a more realistic representation of shark skin than if they were to protrude from the smooth bump surface. In nature, denticles cover the entire body of the shark and, thus, do not form a sudden protrusion at any particular location. That is, they do grow out of the skin but not into the flow. Rather, the flow develops over them. Thus, initiating the denticle patch anywhere in a developing flow will deviate from the natural scenario unless the region of interest is sufficiently downstream. Without the indention, the first row of the denticle array will trigger a shear layer similar to a forward-facing step that requires a significant distance to recover (Sherry, Jacono & Sheridan Reference Sherry, Jacono and Sheridan2010). Therefore, the functionality of the indented shark denticle in this study can be fundamentally different from when they are used as protruding vortex generators in some previous studies (Domel et al. Reference Domel, Domel, Weaver, Saadat, Bertoldi and Lauder2018a,Reference Domel, Saadat, Weaver, Haj-Hariri, Bertoldi and Lauderb; Arunvinthan et al. Reference Arunvinthan, Raatan, Nadaraja Pillai, Pasha, Rahman and Juhany2021; Chen et al. Reference Chen, Du, Li, Lv and Duan2023).
Second, we include the neck of the denticle – a slender, cylinder-like structure situated underneath the wide lid-like crown. In previous studies the cavity region between the denticle neck is rarely considered. For example, the DNS by Boomsma & Sotiropoulos (Reference Boomsma and Sotiropoulos2016) ignored the bottom half of the denticle, and the experiments of Domel et al. (Reference Domel, Saadat, Weaver, Haj-Hariri, Bertoldi and Lauder2018b) discarded the lower 60 %. As we will discuss in the results, the neck region is found to play an important role in drag modulation during flow separation.
Figure 3 shows the variation of the cross-sectional area of the denticle in the vertical direction, as well as the shapes of the cross-section at selected locations. Note that, the bottom 15 % of the denticle is not considered in this study, i.e. the ‘nominal base’ shown in figure 3 is the trimming section and the total height of the denticle is defined with reference to it. This is because the region below is commonly embedded in the underlying stratum spongiosum – the inner, dermal layer of shark skin. Starting from the base, the neck of the denticle is a diverging stem with a quatrefoil cross-section. The maximum cross-section is reached near 60 % of the denticle height, after which the ridges over the crown dominate. The slender base and neck occupy less than 25 % of the space of the widest part of the crown, forming a porous cavity region. Note that there is no distinct separation between the neck and crown in nature, as the two merge seamlessly to form the complete denticle. For our analysis, we designate the halfway point of the denticle height as the boundary between the crown and neck. This choice is motivated by the following reasons: (1) it is where the grooves over the crown start; (2) it is where the rate of expansion of the cross-sectional area begins to decrease (i.e. the second derivative of the cross-sectional area with respect to the vertical direction is zero); (3) as mentioned above, it is approximately where most previous studies trimmed at to obtain their crown-only configurations.
(a) Area of the horizontal cross-section of a single denticle at different heights. Side and front views of the denticles are superposed for reference. The fluid area fraction can be calculated by dividing the area by the product of the denticle spacing  $\delta _x \delta _z = 3.35 \times 10^{-3} H^2$. (b) Horizontal cross-section outline of several adjacent denticles at selected heights: (blue), base; (red), 25 %
 $\delta _h$; (dark green), 50 %
 $\delta _h$; (orange), 75 %
 $\delta _h$.

The height of the denticle is chosen to be  $\delta _h = 0.0488H$, half of that in the DNS by Boomsma & Sotiropoulos (Reference Boomsma and Sotiropoulos2016). The staggered denticle array (figure 2b) is arranged with an offset spacing of
 $\delta _x=1.032\delta _w$ and
 $\delta _z=1.142\delta _w$ (
 $\delta _w$ is the width of the denticle,
 $z$ denotes the spanwise direction). In wall units,
 $\delta _w^+ = 8.53$ and
 $\delta _h^+ = 7.81$. A total of 21 by 50 denticles cover the entire lee side of the bump. The three-dimensional (3-D) model of a representative denticle from Isurus Oxyrinchus (Shortfin Mako) provided by George Lauder is used (Wen et al. (Reference Wen, Weaver and Lauder2014), shown in the inset of figure 2a). It was scanned using micro-CT and made symmetric about the spanwise direction. The model and the spacing are the same as the study by Boomsma & Sotiropoulos (Reference Boomsma and Sotiropoulos2016).
The simulations are performed using an established solver of the incompressible Navier–Stokes equations on a Cartesian staggered grid (Keating et al. Reference Keating, Piomelli, Bremhorst and Nešić2004). Normalized by  $U_b$ and
 $H$, the governing equations read
 \begin{equation} \frac{\partial{u_i}}{\partial {x_i}}=0;\quad \frac{\partial{u_i}}{\partial {t}} + {u}_j\frac{\partial{u_i}}{\partial {x_j}}={-}\frac{\partial{p}}{\partial {x_i}} + \frac{1}{Re_b} \frac{\partial ^2 u_i}{\partial x_j^2} + f_i.\end{equation}
A second-order Adams–Bashforth scheme is employed for the convective terms while the diffusion terms are discretized using an implicit Crank–Nicolson scheme. The spatial derivatives are computed using a second-order accurate central difference scheme. The Poisson equation is solved with a pseudo-spectral method. The complex geometries of the embedded objects are represented by an unstructured surface mesh with triangular elements. The boundary condition on the body surface is applied by an immersed boundary method. At each time step, the forcing term  $f_i$ on the right-hand side of the momentum equation is assigned based on the volume of fluid (VOF) of each grid cell to satisfy the no-slip boundary condition (Scotti Reference Scotti2006; Yuan & Piomelli Reference Yuan and Piomelli2015). The solver has shown great success in our previous studies of surface structures in turbulence including sandgrain roughness (Wu & Piomelli Reference Wu and Piomelli2018; Wu, Piomelli & Yuan Reference Wu, Piomelli and Yuan2019), bumps (Savino et al. Reference Savino, Patel and Wu2023), etc.
The computational domain is  $22.4H$ by
 $2H$ by
 $3.045H$ in the streamwise (
 $x$), wall-normal (
 $y$) and spanwise (
 $z$) directions, respectively. Spanwise two-point correlations prove that fluctuating velocities are uncorrelated by half of the span both near the wall and in the separating shear layer. At the inflow, instantaneous velocity snapshots saved from an a priori channel flow at the same
 $Re_b$ (Savino & Wu Reference Savino and Wu2024) are used. The statistics of the inflow data closely match those from previous DNS (Lee & Moser Reference Lee and Moser2015, not shown). A convective boundary condition is used at the outflow.
Both cases use a grid with  $N_x \times N_y \times N_z = 2016 \times 415 \times 2016 = 1.7$ billion grid points. The finest grid spacing is determined by the denticle features, not the viscous scale. The grid is uniform in
 $z$, and stretched in
 $x$ and
 $y$ with local refinement around the bump. This resolution is comparable to that of Boomsma & Sotiropoulos (Reference Boomsma and Sotiropoulos2016). Outside of the refined region, the grid is gradually stretched. In wall units,
 $\Delta x^+<9.0$,
 $\Delta y^+_{1}<0.2$ and
 $\Delta z^+<0.25$. In regions distant from the wall, the maximum ratio between the Kolmogorov scale and the grid spacing is below 2 for
 $x/H \in [1.0, 9.0]$ and remains below 4 elsewhere. This guarantees the resolution of a significant portion of the dissipation spectrum. Grid convergence is verified by the DNS of open channel flows over denticle arrays (Wu & Savino Reference Wu and Savino2023; for a brief summary, refer to the Appendix). A single denticle is resolved by
 $38 \times 42 \times 35$ grid points in the
 $x$,
 $y$ and
 $z$ directions, respectively (refer to figure 4). The current (
 ${\sim }40^3$ over the region bounded by a denticle) and refined (
 ${\sim }70^3$) grids result in negligible changes in flow statistics and less than 1 % difference in drag. The simulations were performed with a constant time step
 $\Delta t = 2.1 \times 10^{-4} H/U_b$. After a statistically steady state was reached, snapshots were collected every
 $0.5H/U_b$ over
 $200 H/U_b$ to obtain the statistics. Each simulation costs 3400 CPU hours per
 $1.0H/U_b$ on 2016 AMD EPYC 7742 processors, with a clock speed of 2.25
GHz. In the following discussion, quantities are averaged in time and in the spanwise direction over the fluid domain (i.e. intrinsic, denoted by
 $\overline {({\,})}$ or capitalized variables) except where explicitly stated otherwise.
Grid mesh with reference to the side, front and top view of denticle outlines.

3. Results and discussions
3.1. Mean velocity characteristics
Figure 5 shows the mean separation region in the two cases. Compared with case SM, case DT has a mean separation bubble that is 12 % shorter. The separation point, identified as the location of  $U=0$ on the smooth bump or at the crest of the denticles, barely changes (
 $x/H = 4.60$). Therefore, the reduction of the separation region is due to an earlier reattachment downstream of the bump. This observation agrees with Evans et al. (Reference Evans, Hamed, Gorumlu, Doosttalab, Aksak, Chamorro and Castillo2018), Doosttalab et al. (Reference Doosttalab, Dharmarathne, Evans, Hamed, Gorumlu, Aksak, Chamorro, Tutkun and Castillo2018) and Santos et al. (Reference Santos, Lang, Wahidi, Bonacci, Gautam, Devey and Parsons2021). Newly observed is a reverse pore flow beneath the denticle crown prior to the onset of massive flow separation (figure 6a). This pore flow has a magnitude up to 0.025
 $U_b$, about half of the friction velocity of the undisturbed channel. Locally, it peaks in
 $y$ at
 $\sim$25 % denticle height, and in
 $x$ at the positions of the denticle necks. This represents the acceleration of the reverse pore flow as it passes between the necks. Interestingly, the reverse pore flow diminishes once the massive separation takes place. We will elaborate on its physical mechanism momentarily. Note that in our previous study of shark denticles in a zero-pressure-gradient (ZPG) turbulent channel (Wu & Savino Reference Wu and Savino2023, details in the Appendix), the mean pore flow appeared as a forward flow. The peak magnitude was only 0.007
 $U_b$, less than one-third of the reverse one observed here.
Mean separation region: blue, smooth case; red, denticle case. The outlines of the denticles and the bump are shown by the solid black lines for reference. The bump in the smooth case aligns with the envelope of the crown in the denticle case.

(a) Mean streamwise velocity over the denticle bump. (b) Mean streamwise force exerted by the denticles to the fluid. Positive values represent thrust. (c) Profiles of total force integrated in the wall-normal direction. Insets in (a,b) are zoomed-in views. The dashed line in (a,b) is the contour line of  $U=0$. The lines in (c) are the total force produced: (—
 ${\cdot }$—, blue), in case SM; (– – –, orange), in case DT by the denticles; ——, in case DT by the bump surface between denticles. The data of the dotted line (
 $\cdot \!\cdot \!\cdot \!\cdot \!\cdot \!\cdot$, dark green) in (c) is the summation of the drag produced by the denticles and bump in case DT, moving averaged with a sampling window equal to the streamwise spacing between denticles.

We named the process of accelerated reverse flow between the denticle necks a ‘channeling effect’. Its 3-D features are extracted by 3-D temporal averaging followed by ensemble averaging between the 50 denticles along the span (denoted by operator  $\langle \bar {{\ }}\rangle$). Figure 7 shows this ensemble-averaged velocity vector around the denticle at selected streamwise locations, coloured by
 $\langle \bar {U}\rangle$. The forward flow above the crown at
 $x/H=4.1$ and 4.3 and the prominent reverse pore flow in the cavity region are evident. The vector fields confirm that the reverse pore flow is accelerated by the gap between the necks, forming a jet that strikes the rear of upstream denticles. The staggered arrangement of denticle necks in the wall-parallel plane enables the channeling and acceleration of pore flow (and corresponding thrust generation). No flow separation is observed over the mildly curved front surface of the neck. At
 $x/H=4.6$ near the mean separation point, fluid is entering the cavity region via the slits between streamwise consecutive denticles. The reverse pore flow at this location is less intense than those upstream. By
 $x/H=5.0$, the reverse pore flow and the penetrating flow are very weak and the channeling effect is negligible.
Temporal- and ensemble-averaged velocity vector at selected locations (refer to the  $x$ axis). The arrows are coloured and sized by the streamwise component.

3.2. Drag reduction
The drag produced by the bump is the net outcome of the forces over the wind and lee sides of the bump, the latter of which is expected to be a thrust via the pressure directed upstream and the reversed skin friction by recirculation. While the wind-side drag changes little between the two cases, the thrust over the lee side of the bump increases by 230 % in case DT. The total drag reduction is about 4 % (the significant increase in thrust remains relatively small compared with the drag over the wind side in the current configuration). Here, we focus on the increase of thrust over the lee side since the drag on the wind side is irrelevant to the control functionality of the denticles during the flow separation.
To identify the thrust-generation mechanism, we visualize the distribution of  $\bar {f}_x$ in (2.1a,b) (total force including both pressure and viscous forces). Negative
 $\bar {f}_x$ indicates the solid is impeding the fluid's motion, thereby producing drag. Conversely, a positive
 $\bar {f}_x$ indicates a thrust. The distribution of
 $\bar {f}_x$ over the denticles is exhibited as contour in figure 6(b). Note that the surface of the bump that is not covered by the denticle base also contributes to the total force yet is not shown in this contour. It can be seen that the most significant thrust over the lee side occurs shortly downstream of the bump crest, same as the mean reverse pore flow. The coincidence between the reverse pore flow and the thrust can also be observed locally near the streamwise centre of the neck and approximately 25 % of the denticle height from the bump. This specific location corresponds to the widest cross-section of the neck, featuring backward-facing bulges on the spanwise sides of the neck (refer to figure 3b).
The ridges on the top of the crowns, on the contrary, generate drag up to the mean separation point. The alignment between the  $U=0$ line and the drag/thrust boundary of each denticle in the bump-normal direction indicates that the drag produced by the crown is due to skin friction. Note that the spanwise spacing of the ridges in wall units is
 $s^+=3.6$ in case DT, which is below the optimal riblet spacing for drag reduction (
 $\sim$16 viscous lengths, García-Mayoral & Jiménez Reference García-Mayoral and Jiménez2011). The excessive drag produced by the crown observed here, along with the drag increase in previous studies of denticle crowns in ZPG flows (Boomsma & Sotiropoulos Reference Boomsma and Sotiropoulos2016; Wu & Savino Reference Wu and Savino2023), indicates that the complex geometry of the crown may jeopardize the possible riblet drag reduction dynamics, and highlight the configuration-sensitive nature of drag reduction by denticle crowns.
Integrating  $\bar {f}_x$ in the vertical direction, the local drag/thrust profile along the bump is obtained and shown in figure 6(c). For case DT, the force is decomposed into (1) contribution from the parabolic bump surface that is not occupied by a denticle (i.e. between the denticles), and (2) contribution from the denticles. In case DT, thrust is generated in localized peaks at the positions of the necks, by both the bump surface unoccupied by the denticle (black line) and by the denticle structure (orange dashed line). Compared with these local peaks generated by the neck, thrust does not appear between denticle rows where the reverse pore flow is weaker. Thus, not only reverse pore flow but its acceleration between denticle necks appears to be responsible for appreciable thrust production. The total thrust at these peaks is two to five times larger in magnitude compared with case SM thrust at the same streamwise location. Applying a moving window average in the streamwise direction (window size equals the denticle spacing) to the total force in case DT, it can be seen the denticle array produces higher thrust than the smooth bump all over the lee side, especially near the bump crest where the smooth bump produces a drag by friction.
Although the denticles’ bases cover only 13 % of the bump surface area they account for 38 % of the total thrust generated. The channeling effect indicates that the accelerated pore flow in the spanwise gaps creates both a shear force on the side of the denticle necks and on the bump surface, as well as a pressure force when the accelerated reverse flow strikes the upstream denticle row and stagnates. This is confirmed quantitively through the visualization of the shear stresses and pressure on the denticle surface at  $x/H = 4.3$, as shown in figure 8. The shear stresses are shown as components resulting from the wall-normal and spanwise velocity gradients, i.e.
 $\tau _{xy} = 1/Re_b \partial \langle \bar {U} \rangle /\partial y$ and
 $\tau _{xz} = 1/Re_b \partial \langle \bar {U} \rangle /\partial z$, respectively. Furthermore, surface pressure relative to the pressure in the
 $z$–
 $y$ plane at the centre of the denticle base is shown, as the surface pressure differential on the wind and lee sides of the denticle will create a thrust or drag force. Note that the colour range for pressure is greater than it for the viscous stresses. It can be seen that at this location, the crown is producing a high friction drag, mainly
 $\tau _{xy}$. Here
 $\tau _{xz}$ due to the spanwise mean shear on the side of the denticle neck is the leading friction thrust in the neck region. Another major source of the thrust is the high pressure over the rear surface of the neck.
Contours of time- and ensemble-averaged shear and normal stresses over the denticle at  $x/H=4.3$. Results are shown for (a,d)
 $\tau _{xy}/U_b^2 = 1/Re_b \partial \langle \bar {U} \rangle /\partial y$, (b,d)
 $\tau _{xz}/U_b^2 = 1/Re_b \partial \langle \bar {U} \rangle /\partial z$, (c, f)
 $\langle \bar {P} \rangle /U_b^2$. Here
 $P_{ref}$, the mean pressure over the
 $z-y$ plane that passes the centre of the base, is subtracted to demonstrate the relative pressure on the front and back side of the denticle. (a–c) Front isometric view, (d–f) back isometric view. Neighbour denticles are omitted for clarity.

3.3. Formation and sustaining of the reverse pore flow
Understanding how the reverse pore flow is initiated and sustained will shed light on utilizing this mechanism to reduce drag in engineering applications. Figure 9 shows the bump-normal velocity at several virtual planes that are parallel to the bump at selected distances. Notably, negative normal flux is correlated with the slits between denticle rows in the streamwise direction. This inward injection effectively penetrates deep into the cavity region and is still evident at 20 % denticle height. Referring to the geometry of the denticles and the pattern of the denticle array (figure 2 and insets of figure 9), the slit is formed by the inclined bottom surface of the denticle crown and the rounded front of its downstream neighbours, shaping as a backward-upward-facing slit. Meanwhile, a positive normal velocity, which indicates the tendency of the pore flow to escape the cavity region, is observed between the necks of the denticles in the spanwise direction. It is strongest at 0.4 $\delta _h$ and becomes weaker above it as the neck merged into the wide crown. By
 $0.8\delta _h$, where the crown reaches its maximum spanwise width, this outward flux has reduced significantly in the spanwise gaps. It represents the blockage of leakage by adjacent crowns. Some leakage can be also observed downstream of the trailing edges of the crown in the slits, but is not comparable to the dominant inward flux.
Temporal- and ensemble-averaged velocity in the bump-normal direction. From bottom to top, planes at 20 %, 40 %, 60 % and 80 % denticle height, respectively (refer to upper left inset). The injection of fluid through the backward-upward-facing slit between denticle rows is demonstrated in the middle and upper right insets.

The patterns of the normal flux indicate the following physical process of the formation and sustaining of the reverse pore flow. The flow above the denticle enters the underneath cavity region through the backward-upward-facing slit. Then, when the reverse pore flow gets accelerated by the channeling effect, it tends to move outward towards the spanwise gaps above. The close packing of the denticles and the wide crowns narrow the gap to restrict the outward flux. Streamlines plotted in figure 10 show these processes near the denticles around  $x/H=4.45$. The pore flow region is quasi-steady, thus, the streamlines shown in such a region are reasonable representations of pathlines as well. Near and over the crown where the instantaneous flow is unsteady, the mean streamlines do not indicate the actual trajectory of fluid particles, yet they still provide an averaged sense of the flux. The flow passing over the crown (the streamlines in yellow, brown, orange and pink) enters the cavity region through the backward-facing slits. The change of flow direction for these streams creates a small mean circulation region near the trailing edge of the crown. Deep in the cavity region, all streamlines curve slightly upward away from the bump when they are in the acceleration region between necks, and then get deflected downward by the crown and inward flux in the slits upstream. Among these features, the directional preference of the backward-upward-facing slit appears to be critical as it is where the reverse pore flow originates. Its backward-upward inclination permits fluid only to enter in reverse. Recall that the pore flow is negligible in a ZPG channel (Wu & Savino Reference Wu and Savino2023). Therefore, this directional preference of the backward-upward-facing slit enables anisotropic permeability of the cavity region.
Isometric and side views of selected streamlines of the ensemble-averaged flow. Only part of the streamwise and half of the spanwise domain are shown due to symmetry and for clarity. The streamlines, each shown by a unique colour, are plotted from (——) or to (– – –)  $x/H=4.45$ and at eight different
 $y$ locations (highlighted by markers) ranging from the neck region to the top of the crown. The denticles and the bump, as well as the contour of streamwise velocity in the midspan
 $x$–
 $y$ plane, are shown for reference.

As the essential role of the backward-upward-facing slit is demonstrated, the driving mechanism that determines the inward flux becomes the core question to explore. While the injection and leakage phenomena are qualitatively robust over the lee side of the bump, the streamwise variations of their magnitudes are evident (refer to figures 6(a) and 9). It suggests that the injection through the backward-upward-facing slit, the reverse pore flow and associated drag reduction are activated/determined by specific flow conditions. A few previous studies noticed the pore flow and proposed various assumptions regarding their kinematics. Bechert et al. (Reference Bechert, Hoppe and Reif1985) assumed that low instantaneous local pressure created by near-wall streaks ejects fluid out through the backward-upward-facing slit (opposite to the inward injection that we observe), and as a result, compensates the streaks and reduces drag. Evans et al. (Reference Evans, Hamed, Gorumlu, Doosttalab, Aksak, Chamorro and Castillo2018), in their study with divergent pillars, assumed that the contraction – of a hypothesized forward pore flow – between the pillar and stagnation by the top creates local pressure variations and modulates the turbulent structures in the buffer layer. The current data demonstrates that the pore flow in separating flows can be reversed rather than moving forward. Lang and co-workers (Lang et al. Reference Lang, Motta, Habegger, Hueter and Afroz2011; Santos et al. Reference Santos, Lang, Wahidi, Bonacci, Gautam, Devey and Parsons2021) hypothesized that a local cavity recirculation is formed when a reverse flow passing over the denticles bristles the latter. Our results however show that the inward flow peaks near the separation point where the passing flow is near stationary, and diminishes in the recirculation region where the mean reverse flow over the denticles is strong.
Figure 11 shows the momentum fluxes through the cavity region. Both the local bump-normal flux (blue, left axis) and the accumulated bump-parallel flux (red, right axis) are shown. The normal flux, measured across the plane parallel to the bump at 60 % of the denticle height and integrated over the fluid area in such plane, exhibits negative peaks in the locations of the backward-upward-facing slit. Meanwhile, positive normal flux occurs around the necks. These observations further solidify the physical picture of the formation (through the backward-upward-facing slit) and sustaining (leakage prevention by the wide crown) of the reverse pore flow as discussed above. The net penetrating flux is negative in most of the regions except around  $x/H=4.3$ where significant leakage is observed, and at
 $x/H=4.0$ where the reverse pore flow reaches the backward-facing indented wall at the beginning of the denticle array. Once the flow separates around
 $x/H=4.6$, the inward flux decreases despite the mean reverse flow over the crown becoming stronger. When the flow detaches, the strong recirculation region usually has a nearly ZPG as observed extensively in aerodynamics as a plateau in the surface pressure (Patrick Reference Patrick1987). The mean streamwise pressure gradient in case DT agrees with this expected distribution: the streamwise pressure gradient is decreased by 60 % by
 $x/H=4.8$ and 85 % by
 $x/H=5.0$, compared with it at the separation point (not shown). Therefore, the inward flux and reverse pore flow are not associated with the direction of the flow over the denticle crown. Rather, they are determined by the APG. Therefore, the inward flux through the backward-upward-facing slit is driven by the APG in this configuration: it is initiated near the separation point; as the reverse pore flow moves upstream on the lee side, it is continuously fed by successive inward jets from the backward-upward-facing slits, leading to the increase of the accumulated bump-parallel flux. It explains the acceleration of reverse pore flow towards the bump crest shown in figure 6. As the reverse pore flow approaches the bump crest, the leakage becomes significant. Due to mass conservation, the accumulated mass must exit the cavity region at some point. A weakening APG approaching the start of the geometric expansion and/or an upstream FPG could affect the release of the reverse pore flow. The current configuration is not able to clarify this process. Future work is warranted.
Volume flux in the bump-normal (left axis with blue line) and bump-parallel (right axis with red line) directions. The outline of the denticle array is shown by the solid black line as a reference. A dash-dotted line at 60 % denticle height shows where the bump-normal flux is calculated and the bump-parallel flux is integrated up to.

4. Discussion
While the results above show that a thrust-generating reverse pore flow is formed and sustained by denticles with both the neck and crown, the importance or necessity of the various features of the denticles needs further clarification. In this section we present two sets of additional simulations. The first set is 3-D DNS of the same channel flow over the bump, with only the crown or the neck used for the structure array. The goal is to justify the necessity of having the two-layer pattern of the full denticle to enable the penetration, acceleration and sustaining of the reverse pore flow as we discussed above. The other set of simulations are two-dimensional (2-D) simulations with a minimal domain in the pore flow region. Wall-parallel planes containing two types of cross-sections are compared to clarify the thrust generation advantage of the non-circular cross-section of the shark denticle neck.
4.1. Necessity of the crown and neck
We performed simulations using either the crown or the neck. Figure 12 shows the split structures. The position of splitting is at the half-height of the denticle (see the justification in § 2). Note that the neck-only configuration appears qualitatively similar to the diverging pillar used in Evans et al. (Reference Evans, Hamed, Gorumlu, Doosttalab, Aksak, Chamorro and Castillo2018) and Doosttalab et al. (Reference Doosttalab, Dharmarathne, Evans, Hamed, Gorumlu, Aksak, Chamorro, Tutkun and Castillo2018).
Side, back and isometric views of the crown and neck obtained by trimming at half-height of the denticle. Only one row and two adjacent structures are shown for clarity.

In these two additional simulations, the spacing and size of the denticles (before trimming) are maintained as in the full-denticle cases. The lee side of the bump is indented by  $0.5\delta _h$ correspondingly to keep the crest of the trimmed structures aligned with the smooth bump. The strong reverse pore flow is not observed in either of these two cases (see figure 13 and its annotation). The maximum velocity near the bump between the structures is 0.002
 $U_b$ for the crown-only case and
 $0.009U_b$ for the neck-only case. Both are much weaker than the 0.025
 $U_b$ reverse pore flow in case DT. The crown by itself is mainly producing drag but nearly no thrust (refer to figure 14 and its annotation). The neck without crown produces weak thrust near the separation point, similar to the peak penetration observed in case DT. However, the reverse pore flow does not sustain as it travels upstream along the bump. By
 $x/H = 4.3$, the necks are producing drag by a forward pore flow. The separation region (not shown) is less reduced as well:
 $-$8.8 % for the crown-only case and
 $-$4.4 % for the neck-only case, compared with 12 % reduction for the full denticle case. Therefore, the two-layer structure of the denticle appears to be necessary for the formation and sustaining of the thrust-generating reverse pore flow. The crown is crucial in preventing reverse pore flow from escaping the neck region during channeling (which is absent in the neck-only case), while the array of necks is essential for generating reverse pore flow and harvesting thrust (which is lacking in the crown-only case).
Mean velocity over the lee side of the bump with the crown or neck only. Refer to figure 6(a) for comparison.

Mean streamwise force exerted by the crown or neck only. Refer to figure 6(b) for comparison.

4.2. Pore flow through the non-circular necks
In the current configuration the denticle necks occupy more than 20 % of the area where the reverse pore flow is most significant. Therefore, we aim to characterize the dynamics of the reverse pore flow in this section using existing knowledge of porous media flows. Numerous studies on porous media flows have been conducted, ranging from experiments (Ruff & Gelhar Reference Ruff and Gelhar1970; Kong & Schetz Reference Kong and Schetz1982; Suga et al. Reference Suga, Matsumura, Ashitaka, Tominaga and Kaneda2010) to pore flow resolved simulations (Zhang & Prosperetti Reference Zhang and Prosperetti2009; Liu & Prosperetti Reference Liu and Prosperetti2011; Kuwata & Suga Reference Kuwata and Suga2016; Shen, Yuan & Phanikumar Reference Shen, Yuan and Phanikumar2020), and simulations with porous media effects modelled via boundary conditions (Jiménez et al. Reference Jiménez, Uhlmann, Pinelli and Kawahara2001; Hahn, Je & Choi Reference Hahn, Je and Choi2002; Breugem, Boersma & Uittenbogaard Reference Breugem, Boersma and Uittenbogaard2006; Abderrahaman-Elena & García-Mayoral Reference Abderrahaman-Elena and García-Mayoral2017; Gómez-de-Segura & García-Mayoral Reference Gómez-de-Segura and García-Mayoral2019) or a continuum description (Rosti, Cortelezzi & Quadrio Reference Rosti, Cortelezzi and Quadrio2015). The focus of these studies has primarily been on conventional wall-bounded flows such as channel flows or ZPG boundary layers.
The studies by, for instance, Coulaud, Morel & Caltagirone (Reference Coulaud, Morel and Caltagirone1988), Lee & Yang (Reference Lee and Yang1997), Chamsri & Bennethum (Reference Chamsri and Bennethum2015) and Khalifa, Pocher & Tilton (Reference Khalifa, Pocher and Tilton2020), etc. investigated fluid flows through cylinder arrays and characterized their dynamics. According to Khalifa et al. (Reference Khalifa, Pocher and Tilton2020), among others, the Stokes flow between staggered cylinder arrays of porosity 0.8 is Darcian for  $Re_D = U_{pore} D/\nu <1.15$, where
 $U_{pore}$ is the mean pore flow velocity and
 $D$ is the diameter of the cylinder. Pore flow inertial effects become important for
 $Re_D>$1.78 and vortex shedding starts at
 $Re_D = 31$. Since the neck is non-circular,
 $D$ is the diameter of the circle that has the same cross-sectional area as the neck (thus, the same porosity). At 25 % denticle height where the reverse pore flow and thrust peak,
 $D=0.0294H$. In our case DT,
 $Re_D$ is below 1.0 except near the crest of the bump (see figure 15). Therefore, the pore flow in the current study is likely to be Darcian and the permeability of the neck region can be estimated using the Darcy Law. When normalized by
 $D$ and
 $U_{pore}$, it reads
 \begin{equation} {-} Re_D \varPi = \frac{1}{\sigma}. \end{equation}
Here, we define the non-dimensional pressure gradient,  $\varPi =\partial P/\partial s/(U_{pore}^2/D)$, along the pore flow direction
 $s$;
 $\sigma = K/D^2$ is the non-dimensional Darcy permeability;
 $\sigma = 0.045$ is obtained using the present data (figure 15). It qualitatively agrees with the
 $\sigma =0.076$ found by Khalifa et al. (Reference Khalifa, Pocher and Tilton2020) for staggered cylinder arrays at porosity 0.8 (refer to table 6 in Khalifa et al.). For the denticles in a channel (Wu & Savino Reference Wu and Savino2023), in contrast,
 $\sigma = 0.005$, indicating the denticles are much less permeable without the APG.
Profiles of the pore flow Reynolds number, pressure gradient and the non-dimensional Darcy permeability in case DT. Measured at 25 % $\delta _h$ and moving averaged over a window of the streamwise spacing between denticles.

As mentioned in § 3.2, the non-circular cross-section of the denticle neck appears to favour harvesting thrust from the accelerated reverse pore flow. The lower permeability compared with Khalifa et al. (Reference Khalifa, Pocher and Tilton2020) indicates that it is less permeable than circular cylinders. In order to identify the contribution of different areas of the neck, we perform 2-D simulations (in the wall-parallel  $x$–
 $z$ plane) of the reverse pore flow generated by the non-circular denticle neck and compare it with a circular counterpart (see figure 16). In these simulations the Darcy flow at pore flow Reynolds number,
 $Re_D = U_{pore,bulk}D/\nu$, 0.7 is simulated. Here
 $U_{pore,bulk}$ is the bulk velocity of the pore flow and
 $D$ is the diameter of the structure. Comparisons are made between the configurations that use (i) the cross-section of the denticle neck at 25 %
 $\delta _h$, and (ii) a circular cross-section with the same area as the denticle neck. The spacing between the structures matches that in case DT. The bulk flow velocity is kept at
 $U_{pore,bulk}=-0.01U_b$ in the two cases by imposing a constant mass flow rate. Such value leads to a peak pore flow velocity in the denticle neck cross-section case close to that observed in case DT. A periodic boundary condition is applied in the streamwise and spanwise directions, representing an infinite patch of the staggered array. It is observed that the denticle neck produces a 15 % higher peak pore flow velocity and a 23 % higher thrust compared with the circular cross-section of the same porosity. The thrust increase is due to a rise in the total normal thrust (
 $+$38 %), while the total streamwise shear decreases slightly (
 $-$4 %). The backward-facing bulges of the denticle neck are the key parts that contribute to the normal thrust increase (see figure 17).
Contours of the streamwise velocity obtained by the 2-D simulation of Darcy flow around staggered structures of various shapes. See text for details. (a) Cross-section of the denticle at  $25\,\%\delta _h$, (b) circular cross-section that has the same area (porosity) as (a).

Profiles of the normal and shear forces on the surface of the 2-D structure in the Darcy pore flow simulations: blue, denticle neck at 25 % $\delta _h$; red, circle of the same cross-sectional area as the denticle neck at 25 %
 $\delta _h$. Here, ——
 $Pdz$, —
 $\cdot$—
 $1/Re\partial U/\partial z \,{{\rm d}\kern 0.06em x}$,
 $\cdot \!\cdot \!\cdot$ structure outline for location reference. Each profile is plotted from the leading point to the end of the corresponding structure. The pressure at the leading point is set to zero.

Note that these auxiliary Darcy flow simulations are used not to justify that the shark denticle neck cross-section is ideal. When a pore structure generates more thrust, it will correspond to the need for a stronger pressure gradient to drive the pore flow. The question then comes down to what porosity and permeability are proper for certain pressure gradients. The answer depends on the geometry of the APG-producing surface (e.g. the bump in this study), flow conditions and possibly also the arrangement and spacing of the pore structures. Our results only show that the cross-section of the denticle neck, when arranged in a staggered pattern, produces more thrust than a circular one at the same porosity by its side bulges. Optimization by sharks or for engineering applications is beyond the scope of this paper.
5. Concluding remarks
The present study focuses on the effects of shark denticles during flow separation, especially the cavity region underneath the denticle crown. Such a region has been noticed in early studies of shark skins (Bechert et al. Reference Bechert, Hoppe and Reif1985) yet is much less explored in recent investigations. Out results quantifies the flux that penetrates from the outer flow into the cavity region, as well as the pore flow flux along the surface of the bump, with detailed data for denticles consisting of the crown and neck. It enables the justification and refinement of several hypothetical mechanisms proposed in the literature. The key findings include the APG activation of the flux into the cavity region and the channeling effect of the reverse pore flow that enables the substrate thrust.
We have identified several geometrical features of the denticle that influence the thrust generation by the reverse pore flow: (1) the backward-upward-facing slits, (2) the staggered arrangement, (3) the wide crown, and (4) the non-circular neck. The backward-upward-facing slit facilitates a penetrating flux that is only enabled under APG, avoiding a drag penalty by a forward pore flow under FPG/ZPG. The staggered arrangement of denticles enables the channeling and acceleration of the reverse pore flow. A wide crown narrows the spanwise gaps between adjacent denticles when closely packed. This restriction minimizes outward leakage as the neck channels the reverse pore flow, thus sustaining the thrust generation. Finally, the denticle neck features a cross-section possessing wide side bulges that enhance reverse pore flow impaction.
The results appear to indicate that sharks may have developed their denticles into a complex geometry with multiple hydrodynamic functions – more than just the ridges over the crown – through their long evolution history. The activation and sustaining of the reverse pore flow by APG indicates that its thrust production/drag reduction mechanism is best suited for situations experiencing mild APGs and no flow separation. Note that an APG is often inevitable due to the shark's diverging surface curvature or maneuvers. The reverse pore flow-thrust generation leverages and transforms an APG into a favourable outcome. This offers an exciting new strategy for drag reduction.
We have to stress that the 4 % drag reduction observed should not be interpreted as the actual efficiency outcome for sharks’ locomotion. The configuration differs from a real shark skin and swim conditions. Mechanisms responsible for the locomotive efficiency of sharks in nature are far more complex than the current study addresses. Rather, the current work aims to characterize the drag reduction capabilities of a bio-inspired surface structure that has the potential to benefit a variety of industrial and scientific sectors. It is also imperative to note that the quantitative results discussed in this paper will likely depend on the chosen flow configuration. The Reynolds number, bump profile (and resulting APG), denticle size and spacing are arbitrarily chosen. The resulting drag reduction may vary with the parameters mentioned above. Future work is warranted. To reproduce the results presented in this paper, readers are encouraged to contact Dr. George Lauder at Harvard University for access to the 3-D model of the shark denticle.
The reason for the negligible change in the onset of separation between the two cases may be that the APG is still too strong for the denticles to counteract. The average expansion rate of the channel/wind tunnel cross-section, as a rough estimation of the overall APG, is 0.15 in Evans et al. (Reference Evans, Hamed, Gorumlu, Doosttalab, Aksak, Chamorro and Castillo2018) and Doosttalab et al. (Reference Doosttalab, Dharmarathne, Evans, Hamed, Gorumlu, Aksak, Chamorro, Tutkun and Castillo2018), while ours is 0.19. Sharks may have a strategy to maintain a mild curvature and APG, thus, a prolonged utilization of the reverse pore flow-thrust generation and possible separation delay and reduction. The current findings do not rule out the possible effect of denticle bristling by flow reversal. Rather, it highlights what occurs before the onset of massive flow separation.
Acknowledgements
The authors thank Drs P. Moin and B. McKeon at CTR for hosting this research and for the fruitful discussions.
Funding
The authors acknowledge the NSF EPSCoR RII Track-4 Program (grant no. OIA-2131942) and TACC Stampede 2. B.S. acknowledges the support from the NSF GRFP (grant no. 2235036).
Declaration of interests
The authors report no conflict of interest.
Appendix. Shark denticle in a turbulent open channel flow
The strong pore flow is not observed when the APG is absent. Prior to this work, we performed DNS of stationary and bristled shark denticles covering the bottom wall of a ZPG turbulent open channel (Wu & Savino Reference Wu and Savino2023). The attached-flow investigation was similar to the simulations by Boomsma & Sotiropoulos (Reference Boomsma and Sotiropoulos2016) but with the neck of the denticle included. Here, the methodology and pore flow results for the stationary denticles are summarized for comparison with the separating flow cases in this paper. Note that the size of the denticles in Wu & Savino (Reference Wu and Savino2023) is twice that in the current study. Therefore, only qualitative comparisons are made. The finding, in short, is that the pore flow in the ZPG open channel is directed forward and is negligible, which contrasts with the strong reverse pore flow observed in the current study.
For this attached-flow configuration, the bottom wall of a turbulent open channel was covered by the same shark denticle 3-D model as in the current paper (Wen et al. Reference Wen, Weaver and Lauder2014; Lauder et al. Reference Lauder, Wainwright, Domel, Weaver, Wen and Bertoldi2016). The denticles were either stationary or rotating about the spanwise axis passing the centroid of the base. The Reynolds number  $Re_b = U_bH/\nu =8000$. The smooth-wall channel without denticle at this bulk Reynolds number has a friction Reynolds number of approximately
 $450$. The mean pressure drop over the length of the channel was balanced by the drag by the denticle and the wall between the bases. Therefore, the flow is considered as under ZPG.
The height of the denticles was  $\delta _h/H = 0.0976$, comparable to that in Boomsma & Sotiropoulos (Reference Boomsma and Sotiropoulos2016) and twice that in the current paper. Compared with the literature, the novelty of the denticle examined was the inclusion of the neck of the denticle. The denticle replicas were staggered in the transverse plane in the same manner as Wen et al. (Reference Wen, Weaver and Lauder2014) and Boomsma & Sotiropoulos (Reference Boomsma and Sotiropoulos2016). The offsets utilized were
 $\delta _x=1.032\delta _w$ in the streamwise direction and
 $\delta _z=1.142\delta _w$ in the spanwise direction, the same as that in the current study and in Boomsma & Sotiropoulos (Reference Boomsma and Sotiropoulos2016). A 56 by 24 array of denticles covered the entire channel wall. Both the flow and the embedded structures were periodic in the spanwise direction.
Each denticle replica was represented by 75 000 surface triangular elements. In the fluid solver the no-slip boundary condition they imposed was implemented through an immersed boundary method based on a VOF approach (Scotti Reference Scotti2006; Yuan Reference Yuan2015; Wu et al. Reference Wu, Piomelli and Yuan2019). A uniform grid in the wall-parallel direction was used. In the wall-normal direction, it was uniform below the crest of the denticle and stretched toward the channel centreline. Each denticle was resolved by about  $40^3$ points. This resolution is comparable to that used in Boomsma & Sotiropoulos (Reference Boomsma and Sotiropoulos2016). In total,
 $1920\times 400\times 960$ (
 $\approx$0.74 billion) grid points were used in the
 $x$,
 $y$ and
 $z$ directions. In wall units,
 $\Delta x^+ = 2.3$,
 $\Delta y_1^+ = 0.8$ and
 $\Delta z^+ = 2.2$.
The results showed that the stationary denticle increases the total drag by 117 % compared with the smooth channel. Besides, the pore flow has a very low, positive streamwise velocity up to 0.007 $U_b$ (see figure 18) and does not introduce much drag.
Temporal- and ensemble-averaged velocity around a stationary denticle in a turbulent open channel (Wu & Savino Reference Wu and Savino2023). Left column, streamwise component; right column, wall-normal component. The visualizations are made at 25 %, 50 %, 75 % and 100 % denticle height.


 Open access

