


1 Introduction
From a fluid mechanics perspective, displacement flows are fascinating interfacial flows, usually with a large number of parameters that govern their motion. These flows usually occur within confined geometries and typical cases would involve at least two fluids: one fluid (displacing fluid) is imposed at the flow geometry inlet to push (displace) another one (displaced fluid) towards the exit. These flows can be observed in plenty of natural phenomena but also in industrial applications, with prominent examples in the petroleum industry, e.g. well construction (Nelson & Guillot Reference Nelson and Guillot2006) and production (pipelining). Miscible, partially miscible and immiscible flows are widespread. The fluids may have different properties: most commonly the phases have viscosity and density ratios, and one or both phases can exhibit diverse non-Newtonian properties. A list of all the parameters involved would be quite long, e.g. the shape of the flow geometry, wall properties in certain cases, laminar, transient or turbulent characteristics, to name a few. In this work, we will focus on a flow feature that has been rarely explored in the context of displacement flows, i.e. the effects of a channel wall slip with Newtonian and non-Newtonian fluids.
In the present work, we consider theoretically a two-fluid displacement flow in a near-horizontal, two-dimensional long channel. The flow is structured/laminar and it is at a limit where both mixing or interfacial surface tension can be ignored. In general, our fluids obey a viscoplastic Herschel–Bulkley rheology and they can have a small density difference (Boussinesq approximation), where a heavy fluid can displace a lighter one. Similarly, a viscosity ratio between phases is also present as a flow parameter, where a more viscous fluid displaces a less viscous one, or vice versa. Finally, we consider the case wherein a slip velocity may exist at either or both walls of the channel.
Realistic two-fluid systems can be affected by miscibility (mixing) or immiscibility (surface tension) between phases; thus, ignoring these effects while studying interfacial flows must be justified. Accordingly, our displacement flow wherein a pseudo-interface separates the fluids is reminiscent of a miscible displacement flow at the limit of large Péclet numbers (
 $Pe$
), implying that the fluids do not have sufficient time to mix over the time scale of our interest. In fact, several studies, including for example Chen & Meiburg (Reference Chen and Meiburg1996), Petitjeans & Maxworthy (Reference Petitjeans and Maxworthy1996), Rakotomalala, Salin & Watzky (Reference Rakotomalala, Salin and Watzky1997) and Yang & Yortsos (Reference Yang and Yortsos1997), have considered miscible displacement flows when
 $Pe\gg 1$
and demonstrated that the interface remains sharp for a wide range of flow parameters and that the flow approaches the immiscible limit at zero surface tension. Therefore, our case of interest may also resemble an immiscible displacement flow when the capillary number is large (
 $Ca\gg 1$
).
Buoyant displacement flows in confined geometry can be classified into two main categories: a flow with a non-zero mean imposed flow velocity (
 $\hat{V}_{0}>0$
) and a flow with a zero mean imposed flow velocity (
 $\hat{V}_{0}=0$
). The latter is known as a lock-exchange flow, for which the literature is vast. Examples include a series of articles by Seon et al. (Reference Seon, Hulin, Salin, Perrin and Hinch2004, Reference Seon, Hulin, Salin, Perrin and Hinch2005, Reference Seon, Hulin, Salin, Perrin and Hinch2006, Reference Seon, Znaien, Salin, Hulin, Hinch and Perrin2007a
,Reference Seon, Znaien, Salin, Hulin, Hinch and Perrin
b
), on miscible iso-viscous flows with small density differences, albeit with strong buoyancy forces. There are also high resolution computational works on the same topic (e.g. Hallez & Magnaudet Reference Hallez and Magnaudet2008, Reference Hallez and Magnaudet2009) which complete the picture for lock-exchange flows. These and similar studies provide deep understanding of viscous and inertial states in the flow, interpenetrating fronts of the heavy and light fluids, transitions in interfacial behaviours, inclination effects, etc. The counterparts of these flows when
 $\hat{V}_{0}>0$
is present have been studied in a series of works by Taghavi et al. (Reference Taghavi, Seon, Martinez and Frigaard2010, Reference Taghavi, Seon, Wielage-Burchard, Martinez and Frigaard2011, Reference Taghavi, Alba, Seon, Wielage-Burchard, Martinez and Frigaard2012b
) for near-horizontal, Alba, Taghavi & Frigaard (Reference Alba, Taghavi and Frigaard2013b
, Reference Alba, Taghavi and Frigaard2014) for inclined and Amiri, Larachi & Taghavi (Reference Amiri, Larachi and Taghavi2016, Reference Amiri, Larachi and Taghavi2017) for strictly vertical and oscillatory geometries. Briefly, these studies classify various flow regimes as an imposed flow is progressively added to buoyant exchange flows. They demonstrated that the general displacement behaviours can be effectively quantified versus the motion of the leading and trailing displacement fronts. For instance, Taghavi et al. (Reference Taghavi, Seon, Wielage-Burchard, Martinez and Frigaard2011) found that at small
 $\hat{V}_{0}$
, there is a sustained-backflow regime, where the trailing front moves upward against the mean flow direction. At a critical
 $\hat{V}_{0}$
, the trailing front remains motionless during times much longer than the characteristic time of the flow (i.e. a stationary interface regime). Interestingly, the displaced layer in this marginal state is in counter-current motion, with a zero net flux. At larger
 $\hat{V}_{0}$
, the flow exhibits a temporary backflow and an instantaneous displacement regime, associated with a downward motion of the trailing front at long times. Therefore, the stationary interface regime indicates the transition between efficient and inefficient displacements.
Displacement flows are significantly influenced by the geometry in which they occur. The effects of flow geometry can be understood by reviewing a number of works: computational study of miscible exchange flows in square and circular pipes and two-dimensional (2-D) channels (Hallez & Magnaudet Reference Hallez and Magnaudet2008); analytical, computational and experimental study of miscible displacement flows in pipes and channels (Taghavi et al. Reference Taghavi, Alba, Seon, Wielage-Burchard, Martinez and Frigaard2012b ); theoretical and experimental analyses of exchange flows in rectangular channels of arbitrary aspect ratios (Malham et al. Reference Malham, Jarrige, Martin, Rakotomalala, Talon and Salin2010, Martin et al. Reference Martin, Rakotomalala, Talon and Salin2011 and to some extent Matson & Hogg Reference Matson and Hogg2012) and their displacement flow counterparts (Taghavi, Mollaabbasi & St-Hilaire Reference Taghavi, Mollaabbasi and St-Hilaire2017); displacement flows of immiscible fluids in a square duct (Redapangu, Sahu & Vanka Reference Redapangu, Sahu and Vanka2013). A relevant conclusion that can be drawn from the ensemble of these studies is that a 2-D channel displacement flow may reasonably approximate certain stratified flows (which in reality occur in 3-D geometries), unless there are significant inertial effects, interfacial instabilities and mixing between the phases, where the 3-D flow dynamics progressively deviates from 2-D assumptions.
Displacement flows are also affected by the rheology of the displacing and displaced phases. Non-Newtonian characteristics make it hard to analyse these flows and, therefore, most of the previous attempts have concentrated on non-Newtonian fluid flows in ‘simple’ geometries, in particular Hele-Shaw cells. Some key developments in this area can be attributed, to name a few, to Coussot (Reference Coussot1999) and Lindner, Coussot & Bonn (Reference Lindner, Coussot and Bonn2000), who have considered the viscous fingering problem for yield stress fluids (see also Eslami & Taghavi Reference Eslami and Taghavi2017). Yield stress fluid displacement flows in other geometries have been studied by Freitas, Soares & Thompson (Reference Freitas, Soares and Thompson2013) (plane channel) Bittleston, Ferguson & Frigaard (Reference Bittleston, Ferguson and Frigaard2002) (annulus), Dimakopoulos & Tsamopoulos (Reference Dimakopoulos and Tsamopoulos2007) (complex tubes), De Sousa et al. (Reference De Sousa, Soares, de Queiroz and Thompson2007) (tubes), Eslami, Frigaard & Taghavi (Reference Eslami, Frigaard and Taghavi2017) (horizontal channels), etc. Notable contributions in this area are due to Frigaard and co-workers in a series of papers, e.g. Allouche, Frigaard & Sona (Reference Allouche, Frigaard and Sona2000), Frigaard & Ryan (Reference Frigaard and Ryan2004), Zhang & Frigaard (Reference Zhang and Frigaard2006), Wielage-Burchard & Frigaard (Reference Wielage-Burchard and Frigaard2011), Taghavi et al. (Reference Taghavi, Alba, Seon, Wielage-Burchard, Martinez and Frigaard2012b ), Alba et al. (Reference Alba, Taghavi, de Bruyn and Frigaard2013a ), Moyers-Gonzalez et al. (Reference Moyers-Gonzalez, Alba, Taghavi and Frigaard2013), Roustaei & Frigaard (Reference Roustaei and Frigaard2013), etc. Using analytical, computational and experimental techniques, this body of work sheds light on the crucial effects of a fluid’s yield stress on displacement flows. The literature is simply too vast to cite all the relevant studies but an interested reader is referred to an appealing review by Balmforth, Frigaard & Ovarlez (Reference Balmforth, Frigaard and Ovarlez2014) on recent developments in viscoplastic fluid mechanics.
There are numerous situations and applications where widely used no-slip boundary conditions do not appropriately correspond to the physical reality, e.g. microfluidics (Zhu & Granick Reference Zhu and Granick2001), polymer melts (Denn Reference Denn2001), biological applications (Thompson & Troian Reference Thompson and Troian1997), super hydrophobic substrates (Voronov, Papavassiliou & Lee Reference Voronov, Papavassiliou and Lee2008), etc. Traditionally, wall slip is viewed as a relation between wall slip velocity and wall shear stress, with the slip length equal to a local distance linearly extrapolated beyond the surface boundary where the no-slip condition would be satisfied. For Newtonian fluids, stratified flows with wall slip have been recently looked at, mainly in the realm of stability analysis. Considerable progress has been recently brought to the field thanks to the theoretical works of Ghosh, Usha & Sahu (Reference Ghosh, Usha and Sahu2014a ,Reference Ghosh, Usha and Sahu b , Reference Ghosh, Usha and Sahu2015, Reference Ghosh, Usha and Sahu2016) and Chattopadhyay, Usha & Sahu (Reference Chattopadhyay, Usha and Sahu2017). These researchers have performed linear and/or spatio-temporal stability analyses for iso-density, miscible two-fluid systems in various configurations, with a number of stabilizing and destabilizing features, a detailed review of which falls outside the scope of our work. In addition, Hasnain & Alba (Reference Hasnain and Alba2017) have recently looked at immiscible displacements in inclined ducts with a particular wall slip condition to overcome contact-line problem singularity. Although these Newtonian fluid studies are valuable, there is a consensus that non-Newtonian fluid flows with wall slip are even more prevalent than their Newtonian counterparts. For example, based on experimental evidence, Hatzikiriakos (Reference Hatzikiriakos2012) argues that wall slip can play a major role especially for high molecular weight molten polymers and that strong wall slip may occur depending on the wall shear stress. For non-Newtonian fluids, two-fluid systems with wall slip have been rarely studied while the previous works have mainly considered a single fluid within a flow geometry with wall slip. A relevant example includes a range of analytical solutions for viscoplastic flows in channel provided by Ferrás, Nóbrega & Pinho (Reference Ferrás, Nóbrega and Pinho2012); see also Denn (Reference Denn2001) for a review on wall slip with non-Newtonian fluids, covering slip laws as well as techniques to measure wall slip property.
While from a fundamental perspective our work is in the direction of several studies showing the significance of fluid flows with wall slip and their relation to non-Newtonian rheology (e.g. Poumaere et al. Reference Poumaere, Moyers-González, Castelain and Burghelea2014), our motivation for this study also comes from various industrial applications where a combination of wall slip, a viscoplastic rheology and a two-fluid flow system may become important. Among the widely known examples are polymer extrusion and coextrusion processes, where the throughput and the quality of the final product can be affected by wall slip (Denn Reference Denn2001; Ferrás et al. Reference Ferrás, Nóbrega and Pinho2012). There are also several other practical applications. Let us explain two of them in more detail. For example, in oil well cementing processes, cement slurry is pumped into the wellbore to displace and replace in situ drilling mud (Nelson & Guillot Reference Nelson and Guillot2006). The well can be inclined at any angle and the fluids involved typically present density and viscosity ratios. Foamed cement, i.e. a mixture of cement slurry, foaming agents and a gas, is being increasingly used as an alternative to conventional cement (Ahmed et al. Reference Ahmed, Takach, Khan, Taoutaou, James, Saasen and Godøy2009), as it meets the challenges of weak formations while enhancing mud removal. Foamed cement has a complex rheology, exhibiting a shear rate-dependent viscosity, a yield stress and other non-Newtonian characteristics (Kraynik Reference Kraynik1988). When flowing, foam is known to ‘slip at the wall’, due to the appearance of a thin fluid layer wetting the wall and lubricating the foam flow, resulting in a macroscale description of the wall boundary condition as a relation between the wall slip velocity and the wall shear stress. The displacement of foam with another liquid has been also shown to exhibit slip effects (Lindner et al. Reference Lindner, Coussot and Bonn2000). Therefore, the process of cementing oil wells using foamed cement is a displacement flow with two fluids, buoyant effects, viscosity ratios, viscoplastic rheologies and wall slip, all which contribute to the difficulty of fully understanding and therefore designing the process. Another industrial application to mention is in the waxy crude oil transportation in a pipeline, for which gelled oil-related issues are common and restarting the pipeline in sequence stages is sometimes necessary. One of the restarting stages consists of injecting a low viscosity fluid at the pipe inlet to remove the gelled oil (Frigaard, Vinay & Wachs Reference Frigaard, Vinay and Wachs2007). Waxy crude oils present a complex rheology that includes a yield stress, in addition to more exotic non-Newtonian effects. Furthermore, they present shear heterogeneities (Dimitriou Reference Dimitriou2013) displayed by a slip forming at or near the pipe wall (Phillips et al. Reference Phillips, Forsdyke, McCracken and Ravenscroft2011). Thus, the problem of pipeline restart flows of waxy crude oils includes a displacement flow process in which the presence of wall slip is highly relevant. Our current work is an effort to provide a fundamental understanding about these practical displacement flows in some generality, using an analytical methodology.
The current work will contribute to the growing literature of displacement flows, through developing a semi-analytical model that considers partial slip velocity at either or both walls of a 2-D channel. The novelty of the current work primarily arises from considering the wall slip context, as the style of our model derivation and approach shares some similarities with two-fluid flow models used in the past to study laminar displacements. In general, the model is based on generalized Newtonian fluids, which are more prone to slip at the walls of the flow geometry. The model considers a large number of dimensionless groups, such as viscosity and density ratios, rheological features of the displacing and displaced fluids and wall slip parameters, the combination of which makes the model suitable for evaluating more realistic displacement flows. Finally, the exploitation of the model will deliver interfacial patterns and flow regimes, which are essential elements to investigate these complex flows.
In order to emphasize the perspective of our work, let us briefly review some of the relevant issues. (i) Flow stability: The stability of multilayer flows with wall slip cannot generally be determined beforehand (for example, see Ghosh et al. (Reference Ghosh, Usha and Sahu2014a ,Reference Ghosh, Usha and Sahu b , Reference Ghosh, Usha and Sahu2015, Reference Ghosh, Usha and Sahu2016) and Chattopadhyay et al. (Reference Chattopadhyay, Usha and Sahu2017) on the dual role exhibited by wall slip in the stability of various multilayer flows). Therefore, this type of model simplification is often developed to make study of the stability problem possible, which can be for example carried out through a long wavelength stability analysis (Amaouche, Mehidi & Amatousse Reference Amaouche, Mehidi and Amatousse2007 and Alba, Taghavi & Frigaard Reference Alba, Taghavi and Frigaard2013c ), among other possible methods. This is of course in addition to the basic knowledge about the laminar flow with wall slip, gained through such a simplified model. (ii) Buoyancy: A combination of buoyancy and wall slip effects creates a highly unpredictable system in terms of interfacial behaviours. Although there exist a few valuable works considering flow topologies and interfacial front velocities for slip boundaries in gravity currents (e.g. Härtel, Meiburg & Necker Reference Härtel, Meiburg and Necker2000), it must be admitted that the relevant literature is not well developed due to the problem complexity, which highlights the need to simplified models such as ours to understand the effects of buoyancy in combination with wall slip on interfacial behaviours. (iii) Non-Newtonian fluids: These fluid flows, by nature, are susceptible to wall slip. In fact, sometimes non-Newtonian characteristics and wall slip are not separate issues, as the latter occurs due to the former and thus cannot be avoided. For instance, certain yield stress fluids have been found to violate the wall no-slip conditions (Barnes Reference Barnes1995; Poumaere et al. Reference Poumaere, Moyers-González, Castelain and Burghelea2014). This also becomes relevant in a displacement flow context. For example, the wall slip issue has been recently found to affect the flow in experiments using a Carbopol solution (i.e. a widely used laboratory yield stress fluid) displaced by a Newtonian fluid (Liu & de Bruyn Reference Liu and de Bruyn2018). As the literature on yield stress fluid displacements is expanding, it seems necessary to develop multilayer flow models that appropriately take into account wall slip and allow us to explore its effects on various flow features. (iv) Controlling the flow system: One key issue in the framework of displacement flows is addressing a critical question on whether the displacing fluid can efficiently remove the in situ displaced fluid. The answer to this question is directly linked to controlling the behaviours of the interface between the pushing and pushed fluids. While there is a growing literature on the employment of various flow control methods (e.g. using tapered flow geometry (Al-Housseiny, Tsai & Stone Reference Al-Housseiny, Tsai and Stone2012; Mollaabbasi & Taghavi Reference Mollaabbasi and Taghavi2016; Walling, Mollaabbasi & Taghavi Reference Walling, Mollaabbasi and Taghavi2018), elastic-walled geometry (Pihler-Puzovic et al. Reference Pihler-Puzovic, Illien, Heil and Juel2012), time-dependent flow rates (Li et al. Reference Li, Lowengrub, Fontana and Palffy-Muhoray2009), etc.), there are also recent suggestions to use wall slip as an effective flow controlling strategy, as one can design the flow geometry walls as hydrophobic surfaces with appropriate slip so as to control the flow system (Chattopadhyay et al. Reference Chattopadhyay, Usha and Sahu2017). In this context, our work provides an insight on how the interface motion in a displacement flow is affected by wall slip; this knowledge will eventually help realize if/how a displacement flow can be controlled in a desired way by adjusting the wall slip properties.
The outline of the paper is as follows. Section 2 describes the flow geometry and the governing equations of the problem. Section 3 reviews the lubrication model developed and includes the details of the assumptions for displacement flows with wall slip. Section 4 presents the results of the model, for the case where both fluids are Newtonian, while § 5 is devoted to the results of the non-Newtonian case. The paper ends in § 6 with the discussion and main conclusions.
2 Problem setting and governing equations
We consider displacement flows in a 2-D channel that is oriented at an angle close to horizontal (
 $\unicode[STIX]{x1D6FD}\approx \unicode[STIX]{x03C0}/2$
), as schematically shown in figure 1. The channel has height
 $\hat{D}_{0}$
and length
 $\hat{L}$
. In its lower part, the channel is initially filled with a lighter fluid (fluid
 $L$
, with density
 $\hat{\unicode[STIX]{x1D70C}}_{L}$
) and in its upper part with a heavier fluid (fluid
 $H$
, with density
 $\hat{\unicode[STIX]{x1D70C}}_{H}$
). We assume that, due to the density difference and the channel inclination, fluid
 $H$
always advances at the bottom of the channel and fluid
 $L$
always at the top (i.e. a mechanically stable displacement). Fluid
 $H$
is injected with the mean imposed velocity
 $\hat{V}_{0}$
, at the channel inlet, far away from the pseudo-interface that initially separates the two fluids at
 $\hat{x}=0$
(see figure 1 for the coordinates). We assume that both fluids obey a viscoplastic Herschel–Bulkley rheology, which will be described below. We render the equations of motion dimensionless using
 $\hat{D}_{0}$
as length scale,
 $\hat{V}_{0}$
as velocity scale and
 $\hat{D}_{0}/\hat{V}_{0}$
as time scale. The governing equations can be written as
 $$\begin{eqnarray}\displaystyle [1\pm At]Re[\boldsymbol{u}_{t}+\boldsymbol{u}\boldsymbol{\cdot }\unicode[STIX]{x1D735}\boldsymbol{u}] & = & \displaystyle -\unicode[STIX]{x1D735}p+\unicode[STIX]{x1D735}\boldsymbol{\cdot }\unicode[STIX]{x1D749}\pm \frac{\unicode[STIX]{x1D712}}{2}\boldsymbol{e}_{g},\end{eqnarray}$$
 $$\begin{eqnarray}\displaystyle \unicode[STIX]{x1D735}\boldsymbol{\cdot }\boldsymbol{u} & = & \displaystyle 0,\end{eqnarray}$$
where
 $\pm$
respectively refers to the heavy and light fluid layers and
 $\boldsymbol{u}=(u,v)$
denotes the velocity,
 $p$
the pressure and
 $\unicode[STIX]{x1D749}$
the deviatoric stress. In addition,
 $\boldsymbol{e}_{g}=(1,-\tan \unicode[STIX]{x1D6FD})$
is in directions
 $(x,y)$
. The interface height is represented by
 $h(x,t)$
. For
 $t>0$
, the Navier slip boundary conditions are satisfied at the solid walls, as described later. Our main dimensionless number in (2.1) is the buoyancy number, representing the balance of axial buoyancy and viscous stresses, defined as
 $$\begin{eqnarray}\displaystyle \unicode[STIX]{x1D712}\equiv \frac{(\hat{\unicode[STIX]{x1D70C}}_{H}-\hat{\unicode[STIX]{x1D70C}}_{L}){\hat{g}}D_{0}^{2}\cos \unicode[STIX]{x1D6FD}}{\hat{\unicode[STIX]{x1D707}}_{H}\hat{V}_{0}}, & & \displaystyle\end{eqnarray}$$
in which
 ${\hat{g}}$
is the gravitational acceleration and
 $\hat{\unicode[STIX]{x1D707}}_{H}$
is the heavy fluid’s effective viscosity:
 $$\begin{eqnarray}\displaystyle \hat{\unicode[STIX]{x1D707}}_{H}=\hat{\unicode[STIX]{x1D705}}_{H}[\hat{V}_{0}/\hat{D}_{0}]^{n_{H}-1}+\hat{\unicode[STIX]{x1D70F}}_{H,Y}[\hat{V}_{0}/\hat{D}_{0}]^{-1}. & & \displaystyle\end{eqnarray}$$
Here
 $\hat{\unicode[STIX]{x1D70F}}_{H,Y}$
,
 $\hat{\unicode[STIX]{x1D705}}_{H}$
and
 $n_{H}$
are the yield stress, the consistency index and the power-law index, from the Herschel–Bulkley fluid model (as described further below).
The dimensionless parameters that appear on the right-hand side of (2.1) are the Atwood number,
 $At\equiv (\hat{\unicode[STIX]{x1D70C}}_{H}-\hat{\unicode[STIX]{x1D70C}}_{L})/(\hat{\unicode[STIX]{x1D70C}}_{H}+\hat{\unicode[STIX]{x1D70C}}_{L})$
, and the Reynolds number,
 $Re\equiv ((\hat{\unicode[STIX]{x1D70C}}_{H}+\hat{\unicode[STIX]{x1D70C}}_{L})\hat{V}_{0}\hat{D}_{0})/(2\hat{\unicode[STIX]{x1D707}}_{H})$
. We will focus on small density differences (i.e. small
 $At$
), implying that
 $At$
is not a governing flow parameter. In addition, using the lubrication scaling presented in § 3, we will show that
 $Re$
will be also dropped as a flow parameter.
Schematic of the displacement flow with wall slip. Note that the velocity profile and the interface shape are illustrative only.

Thanks to our scaling, in each cross-section of our long channel, we have
 $$\begin{eqnarray}\displaystyle \int _{0}^{1}u\,\text{d}y=1. & & \displaystyle\end{eqnarray}$$
As figure 1 illustrates, we assume that a single-valued interface (
 $y=h(x,t)$
) separates fluids
 $H$
and
 $L$
. Due to the slumping behaviour of the interface, we may expect the appearance of displacement fronts. As figure 1 illustrates, we may define a leading front with height
 ${\hat{h}}_{f}$
(measured from the bottom wall) and velocity
 $\hat{V}_{f}$
, and a trailing front with height
 ${\hat{h}}_{b}$
(measured from the top wall) and velocity
 $\hat{V}_{b}$
.
2.1 Constitutive equations
We assume the fluids to be of generalized Newtonian type, in particular obeying the Herschel–Bulkley model, which includes Newtonian, power law and Bingham models. The dimensionless constitutive laws for Herschel–Bulkley fluids are
 $$\begin{eqnarray}\displaystyle & \displaystyle \dot{\unicode[STIX]{x1D6FE}}(\boldsymbol{u})=0\quad \text{if}~\unicode[STIX]{x1D70F}_{k}(\boldsymbol{u})\leqslant B_{k}, & \displaystyle\end{eqnarray}$$
 $$\begin{eqnarray}\displaystyle & \displaystyle \unicode[STIX]{x1D70F}_{k,ij}(\boldsymbol{u})=\left[\unicode[STIX]{x1D705}_{k}\dot{\unicode[STIX]{x1D6FE}}^{n_{k}-1}(\boldsymbol{u})+\frac{B_{k}}{\dot{\unicode[STIX]{x1D6FE}}(\boldsymbol{u})}\right]\dot{\unicode[STIX]{x1D6FE}}_{ij}(\boldsymbol{u})\quad \text{if}~\unicode[STIX]{x1D70F}_{k}(\boldsymbol{u})>B_{k}, & \displaystyle\end{eqnarray}$$
where the subscripts
 $k=H,L$
and the strain rate tensor has components
 $$\begin{eqnarray}\displaystyle \dot{\unicode[STIX]{x1D6FE}}_{ij}(\boldsymbol{u})=\frac{\unicode[STIX]{x2202}u_{i}}{\unicode[STIX]{x2202}x_{j}}+\frac{\unicode[STIX]{x2202}u_{j}}{\unicode[STIX]{x2202}x_{i}}, & & \displaystyle\end{eqnarray}$$
and the norms of these tensors (i.e. the second invariants),
 $\dot{\unicode[STIX]{x1D6FE}}(\boldsymbol{u})$
and
 $\unicode[STIX]{x1D70F}_{k}(\boldsymbol{u})$
, are defined by
 $$\begin{eqnarray}\displaystyle \dot{\unicode[STIX]{x1D6FE}}(\boldsymbol{u})=\left[\frac{1}{2}\mathop{\sum }_{i,j=1}^{2}[\dot{\unicode[STIX]{x1D6FE}}_{ij}(\boldsymbol{u})]^{2}\right]^{1/2},\quad \unicode[STIX]{x1D70F}_{k}(\boldsymbol{u})=\left[\frac{1}{2}\mathop{\sum }_{i,j=1}^{2}[\unicode[STIX]{x1D70F}_{k,ij}(\boldsymbol{u})]^{2}\right]^{1/2}. & & \displaystyle\end{eqnarray}$$
Since the parameters are dimensionless, we find
 $\unicode[STIX]{x1D705}_{H}=1-B_{H}$
and
 $\unicode[STIX]{x1D705}_{L}=m-B_{L}$
, with the viscosity ratio,
 $m$
, defined as
 $$\begin{eqnarray}\displaystyle m\equiv \frac{\hat{\unicode[STIX]{x1D707}}_{L}}{\hat{\unicode[STIX]{x1D707}}_{H}}=\frac{\hat{\unicode[STIX]{x1D705}}_{L}[\hat{V}_{0}/\hat{D}_{0}]^{n_{L}-1}+\hat{\unicode[STIX]{x1D70F}}_{L,Y}[\hat{V}_{0}/\hat{D}_{0}]^{-1}}{\hat{\unicode[STIX]{x1D705}}_{H}[\hat{V}_{0}/\hat{D}_{0}]^{n_{H}-1}+\hat{\unicode[STIX]{x1D70F}}_{H,Y}[\hat{V}_{0}/\hat{D}_{0}]^{-1}}, & & \displaystyle\end{eqnarray}$$
where
 $\hat{\unicode[STIX]{x1D707}}_{H}$
and
 $\hat{\unicode[STIX]{x1D707}}_{L}$
are viscosity scales for fluids
 $H$
and
 $L$
, respectively. For two Newtonian fluids, we recover
 $\hat{\unicode[STIX]{x1D707}}_{k}=\hat{\unicode[STIX]{x1D705}}_{k}$
. The Bingham numbers
 $B_{k}$
are also defined as
 $$\begin{eqnarray}\displaystyle B_{k}\equiv \frac{\hat{\unicode[STIX]{x1D70F}}_{k,Y}}{\hat{\unicode[STIX]{x1D705}}_{H}[\hat{V}_{0}/\hat{D}_{0}]^{n_{H}}+\hat{\unicode[STIX]{x1D70F}}_{H,Y}}. & & \displaystyle\end{eqnarray}$$
Note that based on the definitions of the Bingham numbers above, we always have
 $0\leqslant B_{H}<1$
and
 $0\leqslant B_{L}<m$
.
It is worth emphasizing that, in the above scalings, the ‘effective viscosity’ is used to produce the dimensionless groups, such as the Bingham numbers and the viscosity ratio, implying that we are dealing with the ‘effective’ versions of
 $B_{k}$
,
 $m$
, etc. This approach, which has been introduced in the recent literature (see e.g. Nirmalkar, Chhabra & Poole Reference Nirmalkar, Chhabra and Poole2013 and Thompson & Soares Reference Thompson and Soares2016), provides a reasonable framework to analyse the role played by viscosity in our displacement flows. Also note that our effective dimensionless groups can be easily converted to their more conventional forms using simple relations (Nirmalkar et al.
Reference Nirmalkar, Chhabra and Poole2013; Thompson & Soares Reference Thompson and Soares2016).
3 Lubrication model
We now develop a lubrication model, by assuming that the interface is elongated and that inertia is not dominant. The latter assumption does not necessarily exclude moderate
 $Re$
: for typical fluids/conditions, previous studies find nearly viscous displacement flow regimes at near-horizontal duct inclinations; see, e.g. Taghavi et al. (Reference Taghavi, Seon, Martinez and Frigaard2010, Reference Taghavi, Seon, Wielage-Burchard, Martinez and Frigaard2011), Taghavi, Alba & Frigaard (Reference Taghavi, Alba and Frigaard2012a
), Taghavi et al. (Reference Taghavi, Alba, Seon, Wielage-Burchard, Martinez and Frigaard2012b
).
We assume that velocities and stresses are continuous across the interface, which satisfies a kinematic condition. We scale our equations using
 $\unicode[STIX]{x1D6FF}^{-1}\gg 1$
as an interface elongation length scale over which the interface typically spreads. We then define
 $\unicode[STIX]{x1D6FF}x=X$
,
 $\unicode[STIX]{x1D6FF}t=T$
,
 $\unicode[STIX]{x1D6FF}p=P$
and
 $v=\unicode[STIX]{x1D6FF}V$
, and follow standard methods (e.g. see Leal Reference Leal2007) to arrive at the re-scaled equations:
 $$\begin{eqnarray}\displaystyle \unicode[STIX]{x1D6FF}\left[1\pm At\right]Re\left[\frac{\unicode[STIX]{x2202}u}{\unicode[STIX]{x2202}T}+u\frac{\unicode[STIX]{x2202}u}{\unicode[STIX]{x2202}X}+V\frac{\unicode[STIX]{x2202}u}{\unicode[STIX]{x2202}y}\right] & = & \displaystyle -\frac{\unicode[STIX]{x2202}P}{\unicode[STIX]{x2202}X}+\frac{\unicode[STIX]{x2202}\unicode[STIX]{x1D70F}_{Xy}}{\unicode[STIX]{x2202}y}\pm \frac{\unicode[STIX]{x1D712}}{2}+\unicode[STIX]{x1D6FF}^{2}\frac{\unicode[STIX]{x2202}\unicode[STIX]{x1D70F}_{XX}}{\unicode[STIX]{x2202}X},\end{eqnarray}$$
 $$\begin{eqnarray}\displaystyle \unicode[STIX]{x1D6FF}^{3}\left[1\pm At\right]Re\left[\frac{\unicode[STIX]{x2202}V}{\unicode[STIX]{x2202}T}+u\frac{\unicode[STIX]{x2202}V}{\unicode[STIX]{x2202}X}+V\frac{\unicode[STIX]{x2202}V}{\unicode[STIX]{x2202}y}\right] & = & \displaystyle -\frac{\unicode[STIX]{x2202}P}{\unicode[STIX]{x2202}y}\mp \unicode[STIX]{x1D6FF}\frac{\unicode[STIX]{x1D712}}{2}\tan \unicode[STIX]{x1D6FD}+\unicode[STIX]{x1D6FF}^{2}\left(\frac{\unicode[STIX]{x2202}\unicode[STIX]{x1D70F}_{yX}}{\unicode[STIX]{x2202}X}+\frac{\unicode[STIX]{x2202}\unicode[STIX]{x1D70F}_{yy}}{\unicode[STIX]{x2202}y}\right),\end{eqnarray}$$
 $$\begin{eqnarray}\displaystyle \frac{\unicode[STIX]{x2202}u}{\unicode[STIX]{x2202}X}+\frac{\unicode[STIX]{x2202}V}{\unicode[STIX]{x2202}y} & = & \displaystyle 0.\end{eqnarray}$$
We consider the situation where the interface spreading is driven by buoyant stresses that are balanced by viscous stresses, implying
 $\unicode[STIX]{x1D6FF}\unicode[STIX]{x1D712}=\cot \unicode[STIX]{x1D6FD}$
. Therefore, the equations above at the limit of
 $\unicode[STIX]{x1D6FF}\rightarrow 0$
(with
 $Re$
fixed) become
 $$\begin{eqnarray}\displaystyle 0 & = & \displaystyle -\frac{\unicode[STIX]{x2202}P}{\unicode[STIX]{x2202}X}+\frac{\unicode[STIX]{x2202}}{\unicode[STIX]{x2202}y}\unicode[STIX]{x1D70F}_{k,Xy}\pm \frac{\unicode[STIX]{x1D712}}{2},\end{eqnarray}$$
 $$\begin{eqnarray}\displaystyle 0 & = & \displaystyle -\frac{\unicode[STIX]{x2202}P}{\unicode[STIX]{x2202}y}\mp \unicode[STIX]{x1D6FF}\frac{\unicode[STIX]{x1D712}}{2}\tan \unicode[STIX]{x1D6FD}.\end{eqnarray}$$
Integration equation (3.5) across both layers and after a little algebra, we arrive at
 $$\begin{eqnarray}\displaystyle 0 & = & \displaystyle -\frac{\unicode[STIX]{x2202}P_{0}}{\unicode[STIX]{x2202}X}+\frac{\unicode[STIX]{x2202}}{\unicode[STIX]{x2202}y}\unicode[STIX]{x1D70F}_{H,Xy},\quad y\in (0,h),\end{eqnarray}$$
 $$\begin{eqnarray}\displaystyle 0 & = & \displaystyle -\frac{\unicode[STIX]{x2202}P_{0}}{\unicode[STIX]{x2202}X}+\frac{\unicode[STIX]{x2202}}{\unicode[STIX]{x2202}y}\unicode[STIX]{x1D70F}_{L,Xy}-\unicode[STIX]{x1D712}+h_{X},\quad y\in (h,1),\end{eqnarray}$$
where
 $P_{0}=P(X,y,T)|_{y=0}-(X\unicode[STIX]{x1D712}/2)$
and
 $h_{X}=\unicode[STIX]{x2202}h/\unicode[STIX]{x2202}X$
.
The leading-order strain rate component in the lubrication approximation is
 $\dot{\unicode[STIX]{x1D6FE}}_{Xy}=\unicode[STIX]{x2202}u/\unicode[STIX]{x2202}y$
. Therefore, the leading-order shear stress
 $\unicode[STIX]{x1D70F}_{k,Xy}$
in terms of
 $\dot{\unicode[STIX]{x1D6FE}}_{Xy}$
can be simplified in terms of the leading-order constitutive laws:
 $$\begin{eqnarray}\displaystyle & \displaystyle \frac{\unicode[STIX]{x2202}u}{\unicode[STIX]{x2202}y}=0\quad \text{if}~|\unicode[STIX]{x1D70F}_{k,Xy}|\leqslant B_{k}, & \displaystyle\end{eqnarray}$$
 $$\begin{eqnarray}\displaystyle & \displaystyle \unicode[STIX]{x1D70F}_{k,Xy}=\left[\unicode[STIX]{x1D705}_{k}\left|\frac{\unicode[STIX]{x2202}u}{\unicode[STIX]{x2202}y}\right|^{n_{k}-1}+\frac{B_{k}}{\displaystyle \left|\frac{\unicode[STIX]{x2202}u}{\unicode[STIX]{x2202}y}\right|}\right]\frac{\unicode[STIX]{x2202}u}{\unicode[STIX]{x2202}y}\quad \text{if}~|\unicode[STIX]{x1D70F}_{k,Xy}|>B_{k}. & \displaystyle\end{eqnarray}$$
Boundary conditions are the Navier slip boundary conditions (Navier Reference Navier1823) at the two walls and the continuity of the velocity and shear stress at the interface:
 $$\begin{eqnarray}\displaystyle u(X,y=0,T) & = & \displaystyle \unicode[STIX]{x1D706}_{l}\unicode[STIX]{x1D70F}_{H,Xy}(X,y=0,T),\end{eqnarray}$$
 $$\begin{eqnarray}\displaystyle u(X,y=1,T) & = & \displaystyle -\unicode[STIX]{x1D706}_{u}\unicode[STIX]{x1D70F}_{L,Xy}(X,y=1,T),\end{eqnarray}$$
 $$\begin{eqnarray}\displaystyle u(X,y\rightarrow h^{-},T) & = & \displaystyle u(X,y\rightarrow h^{+},T),\end{eqnarray}$$
 $$\begin{eqnarray}\displaystyle \unicode[STIX]{x1D70F}_{H,Xy}(X,y\rightarrow h^{-},T) & = & \displaystyle \unicode[STIX]{x1D70F}_{L,Xy}(X,y\rightarrow h^{+},T),\end{eqnarray}$$
where
 $\unicode[STIX]{x1D706}_{l}$
and
 $\unicode[STIX]{x1D706}_{u}$
are the slip coefficients (or slip parameters) and the subscripts
 $l$
and
 $u$
represent the channel lower and upper walls, respectively. These coefficients can be written as
 $$\begin{eqnarray}\displaystyle \unicode[STIX]{x1D706}_{u} & = & \displaystyle \frac{\hat{\unicode[STIX]{x1D706}}_{u}}{\hat{V}_{0}}\left(\hat{\unicode[STIX]{x1D705}}_{H}\left[\frac{\hat{V}_{0}}{\hat{D}_{0}}\right]^{n_{H}}+\hat{\unicode[STIX]{x1D70F}}_{H,Y}\right),\end{eqnarray}$$
 $$\begin{eqnarray}\displaystyle \unicode[STIX]{x1D706}_{l} & = & \displaystyle \frac{\hat{\unicode[STIX]{x1D706}}_{l}}{\hat{V}_{0}}\left(\hat{\unicode[STIX]{x1D705}}_{H}\left[\frac{\hat{V}_{0}}{\hat{D}_{0}}\right]^{n_{H}}+\hat{\unicode[STIX]{x1D70F}}_{H,Y}\right).\end{eqnarray}$$
Note that
 $\unicode[STIX]{x1D706}_{l}$
or
 $\unicode[STIX]{x1D706}_{u}$
already combines the effective viscosity and a characteristic length defined as an imaginary distance to which the wall velocity profile is extrapolated to reach zero; therefore,
 $\unicode[STIX]{x1D706}_{l}$
or
 $\unicode[STIX]{x1D706}_{u}$
could be considered as a material parameter characteristic of the fluid–solid pair; see Denn (Reference Denn2001). The boundary conditions allow us to determine
 $u$
for given values of
 $\unicode[STIX]{x2202}P_{0}/\unicode[STIX]{x2202}X$
,
 $m$
,
 $\unicode[STIX]{x1D712}$
,
 $n_{k}$
,
 $B_{k}$
,
 $\unicode[STIX]{x1D706}_{l}$
,
 $\unicode[STIX]{x1D706}_{u}$
,
 $h$
and
 $h_{X}$
. To find the pressure gradient, note that (2.5) needs also to be satisfied as an additional constraint.
The interface obeys a kinematic condition
 $$\begin{eqnarray}\displaystyle \frac{\unicode[STIX]{x2202}h}{\unicode[STIX]{x2202}T}+u\frac{\unicode[STIX]{x2202}h}{\unicode[STIX]{x2202}X}=V, & & \displaystyle\end{eqnarray}$$
which in combination with the incompressibility condition leads to
 $$\begin{eqnarray}\displaystyle \frac{\unicode[STIX]{x2202}h}{\unicode[STIX]{x2202}T}+\frac{\unicode[STIX]{x2202}q_{H}}{\unicode[STIX]{x2202}X}=0, & & \displaystyle\end{eqnarray}$$
where the flux of the heavy layer,
 $q_{H}$
, is defined as
 $$\begin{eqnarray}\displaystyle q_{H}=\int _{0}^{h}u\,\text{d}y. & & \displaystyle\end{eqnarray}$$
In the rest of the paper, we concentrate on providing the solutions to the flux function and the kinematic condition.
3.1 Computing flux function
In this section we explain our method to find the stress and velocity solutions, from which the flux can be computed. For fixed parameters, including fixed
 $h$
and
 $\unicode[STIX]{x2202}h/\unicode[STIX]{x2202}X$
, equations (3.6) and (3.7) can be written as
 $$\begin{eqnarray}\displaystyle \frac{\unicode[STIX]{x2202}}{\unicode[STIX]{x2202}y}\unicode[STIX]{x1D70F}_{H,Xy} & = & \displaystyle \frac{\unicode[STIX]{x2202}P_{0}}{\unicode[STIX]{x2202}X},\quad y\in (0,h),\end{eqnarray}$$
 $$\begin{eqnarray}\displaystyle \frac{\unicode[STIX]{x2202}}{\unicode[STIX]{x2202}y}\unicode[STIX]{x1D70F}_{L,Xy} & = & \displaystyle \unicode[STIX]{x1D712}-h_{X}+\frac{\unicode[STIX]{x2202}P_{0}}{\unicode[STIX]{x2202}X},\quad y\in (h,1),\end{eqnarray}$$
showing that, in each pure fluid layer, the shear stresses are linear in
 $y$
.
For Newtonian displacements, the equations can be simply integrated to deliver the analytical solution for the flux function:
 $$\begin{eqnarray}\displaystyle q_{H}(h,h_{X},\unicode[STIX]{x1D712},m,\unicode[STIX]{x1D706}_{l},\unicode[STIX]{x1D706}_{u})=q_{H,A}(h,m,\unicode[STIX]{x1D706}_{l},\unicode[STIX]{x1D706}_{u})+q_{H,B}(h,m,\unicode[STIX]{x1D706}_{l},\unicode[STIX]{x1D706}_{u})(\unicode[STIX]{x1D712}-h_{X}), & & \displaystyle\end{eqnarray}$$
which includes an advective component (
 $q_{H,A}$
) and a buoyancy-driven component (
 $q_{H,B}$
), found as
 $$\begin{eqnarray}\displaystyle q_{H,A} & = & \displaystyle \frac{a_{11}\unicode[STIX]{x1D706}_{l}^{1}\unicode[STIX]{x1D706}_{u}^{1}+a_{10}\unicode[STIX]{x1D706}_{l}^{1}\unicode[STIX]{x1D706}_{u}^{0}+a_{01}\unicode[STIX]{x1D706}_{l}^{0}\unicode[STIX]{x1D706}_{u}^{1}+a_{00}\unicode[STIX]{x1D706}_{l}^{0}\unicode[STIX]{x1D706}_{u}^{0}}{c_{11}\unicode[STIX]{x1D706}_{l}^{1}\unicode[STIX]{x1D706}_{u}^{1}+c_{10}\unicode[STIX]{x1D706}_{l}^{1}\unicode[STIX]{x1D706}_{u}^{0}+c_{01}\unicode[STIX]{x1D706}_{l}^{0}\unicode[STIX]{x1D706}_{u}^{1}+c_{00}\unicode[STIX]{x1D706}_{l}^{0}\unicode[STIX]{x1D706}_{u}^{0}},\end{eqnarray}$$
 $$\begin{eqnarray}\displaystyle q_{H,B} & = & \displaystyle \frac{b_{11}\unicode[STIX]{x1D706}_{l}^{1}\unicode[STIX]{x1D706}_{u}^{1}+b_{10}\unicode[STIX]{x1D706}_{l}^{1}\unicode[STIX]{x1D706}_{u}^{0}+b_{01}\unicode[STIX]{x1D706}_{l}^{0}\unicode[STIX]{x1D706}_{u}^{1}+b_{00}\unicode[STIX]{x1D706}_{l}^{0}\unicode[STIX]{x1D706}_{u}^{0}}{c_{11}\unicode[STIX]{x1D706}_{l}^{1}\unicode[STIX]{x1D706}_{u}^{1}+c_{10}\unicode[STIX]{x1D706}_{l}^{1}\unicode[STIX]{x1D706}_{u}^{0}+c_{01}\unicode[STIX]{x1D706}_{l}^{0}\unicode[STIX]{x1D706}_{u}^{1}+c_{00}\unicode[STIX]{x1D706}_{l}^{0}\unicode[STIX]{x1D706}_{u}^{0}},\end{eqnarray}$$
where the coefficients
 $a_{ij}$
,
 $b_{ij}$
and
 $c_{ij}$
(with
 $i,j=0,1$
) are functions of
 $h$
and
 $m$
only, and they are given in appendix A. If
 $\unicode[STIX]{x1D706}_{l}=\unicode[STIX]{x1D706}_{u}=0$
(i.e. no-slip at both walls), we retrieve
 $$\begin{eqnarray}\displaystyle q_{H}=\frac{a_{00}+b_{00}(\unicode[STIX]{x1D712}-h_{X})}{c_{00}}, & & \displaystyle\end{eqnarray}$$
which matches the flux function given in Taghavi et al. (Reference Taghavi, Seon, Martinez and Frigaard2009) for a displacement flow in a channel with no wall slip.
In a similar manner, the velocity profiles for Newtonian fluids can be also analytically found as
 $$\begin{eqnarray}\displaystyle u_{H} & = & \displaystyle u_{H,A}+u_{H,B}(\unicode[STIX]{x1D712}-h_{X}),\end{eqnarray}$$
 $$\begin{eqnarray}\displaystyle u_{L} & = & \displaystyle u_{L,A}+u_{L,B}(\unicode[STIX]{x1D712}-h_{X}),\end{eqnarray}$$
where the subscripts
 $A$
and
 $B$
represent the advective and buoyancy-driven components, respectively. We find these components as
 $$\begin{eqnarray}\displaystyle u_{k,A} & = & \displaystyle \frac{d_{k,11}\unicode[STIX]{x1D706}_{l}^{1}\unicode[STIX]{x1D706}_{u}^{1}+d_{k,10}\unicode[STIX]{x1D706}_{l}^{1}\unicode[STIX]{x1D706}_{u}^{0}+d_{k,01}\unicode[STIX]{x1D706}_{l}^{0}\unicode[STIX]{x1D706}_{u}^{1}+d_{k,00}\unicode[STIX]{x1D706}_{l}^{0}\unicode[STIX]{x1D706}_{u}^{0}}{f_{k,11}\unicode[STIX]{x1D706}_{l}^{1}\unicode[STIX]{x1D706}_{u}^{1}+f_{k,10}\unicode[STIX]{x1D706}_{l}^{1}\unicode[STIX]{x1D706}_{u}^{0}+f_{k,01}\unicode[STIX]{x1D706}_{l}^{0}\unicode[STIX]{x1D706}_{u}^{1}+f_{k,00}\unicode[STIX]{x1D706}_{l}^{0}\unicode[STIX]{x1D706}_{u}^{0}},\end{eqnarray}$$
 $$\begin{eqnarray}\displaystyle u_{k,B} & = & \displaystyle \frac{e_{k,11}\unicode[STIX]{x1D706}_{l}^{1}\unicode[STIX]{x1D706}_{u}^{1}+e_{k,10}\unicode[STIX]{x1D706}_{l}^{1}\unicode[STIX]{x1D706}_{u}^{0}+e_{k,01}\unicode[STIX]{x1D706}_{l}^{0}\unicode[STIX]{x1D706}_{u}^{1}+e_{k,00}\unicode[STIX]{x1D706}_{l}^{0}\unicode[STIX]{x1D706}_{u}^{0}}{f_{k,11}\unicode[STIX]{x1D706}_{l}^{1}\unicode[STIX]{x1D706}_{u}^{1}+f_{k,10}\unicode[STIX]{x1D706}_{l}^{1}\unicode[STIX]{x1D706}_{u}^{0}+f_{k,01}\unicode[STIX]{x1D706}_{l}^{0}\unicode[STIX]{x1D706}_{u}^{1}+f_{k,00}\unicode[STIX]{x1D706}_{l}^{0}\unicode[STIX]{x1D706}_{u}^{0}},\end{eqnarray}$$
in which
 $k=H,L$
(corresponding to the heavy and light fluids). The coefficients
 $d_{k,ij}$
,
 $e_{k,ij}$
and
 $f_{k,ij}$
(with
 $i,j=0,1$
) are functions of
 $m$
,
 $h$
and
 $y$
, and they are given in appendix B.
Having found the analytical form of the Newtonian flux function, we now turn to finding the solution for non-Newtonian fluids. Let us first denote the wall shear stresses in fluids
 $H$
and
 $L$
by
 $\unicode[STIX]{x1D70F}_{H}$
and
 $\unicode[STIX]{x1D70F}_{L}$
, respectively, and then simply find them versus
 $\unicode[STIX]{x2202}P_{0}/\unicode[STIX]{x2202}X$
and interfacial stress
 $\unicode[STIX]{x1D70F}_{i}$
through
 $$\begin{eqnarray}\displaystyle \unicode[STIX]{x1D70F}_{H} & = & \displaystyle \unicode[STIX]{x1D70F}_{i}-h\frac{\unicode[STIX]{x2202}P_{0}}{\unicode[STIX]{x2202}X},\end{eqnarray}$$
 $$\begin{eqnarray}\displaystyle \unicode[STIX]{x1D70F}_{L} & = & \displaystyle \unicode[STIX]{x1D70F}_{i}+(1-h)\left(\unicode[STIX]{x1D712}-h_{X}+\frac{\unicode[STIX]{x2202}P_{0}}{\unicode[STIX]{x2202}X}\right).\end{eqnarray}$$
In each layer, the shear stresses in terms of
 $\unicode[STIX]{x1D70F}_{i}$
,
 $\unicode[STIX]{x1D70F}_{H}$
and
 $\unicode[STIX]{x1D70F}_{L}$
are
 $$\begin{eqnarray}\displaystyle \unicode[STIX]{x1D70F}_{H,Xy}(y) & = & \displaystyle \unicode[STIX]{x1D70F}_{H}\left(1-\frac{y}{h}\right)+\unicode[STIX]{x1D70F}_{i}\frac{y}{h},\end{eqnarray}$$
 $$\begin{eqnarray}\displaystyle \unicode[STIX]{x1D70F}_{L,Xy}(y) & = & \displaystyle \unicode[STIX]{x1D70F}_{L}\frac{h-y}{h-1}+\unicode[STIX]{x1D70F}_{i}\frac{1-y}{1-h}.\end{eqnarray}$$
Using the constitutive laws, the velocity gradient
 $\unicode[STIX]{x2202}u/\unicode[STIX]{x2202}y$
can be determined at each point and therefore
 $\unicode[STIX]{x2202}u/\unicode[STIX]{x2202}y$
can be integrated away from the walls at
 $y=0$
and
 $y=1$
, where the Navier slip conditions are implemented, towards the interface. For given wall and interfacial stresses (
 $\unicode[STIX]{x1D70F}_{H}$
,
 $\unicode[STIX]{x1D70F}_{L}$
and
 $\unicode[STIX]{x1D70F}_{i}$
) and known flow parameters, two interfacial velocities are delivered:
 $$\begin{eqnarray}\displaystyle u_{i}(h^{-}) & = & \displaystyle \int _{0}^{h}\frac{u(y;\unicode[STIX]{x1D70F}_{H},\unicode[STIX]{x1D70F}_{i})}{\unicode[STIX]{x2202}y}\,\text{d}y+\unicode[STIX]{x1D706}_{l}\unicode[STIX]{x1D70F}_{H,Xy}(X,y=0,T),\end{eqnarray}$$
 $$\begin{eqnarray}\displaystyle u_{i}(h^{+}) & = & \displaystyle \int _{1}^{h}\frac{u(y;\unicode[STIX]{x1D70F}_{L},\unicode[STIX]{x1D70F}_{i})}{\unicode[STIX]{x2202}y}\,\text{d}y-\unicode[STIX]{x1D706}_{u}\unicode[STIX]{x1D70F}_{L,Xy}(X,y=1,T),\end{eqnarray}$$
which are not the same for initial guess values of wall stresses
 $(\unicode[STIX]{x1D70F}_{H},\unicode[STIX]{x1D70F}_{L})$
, but we can simply iterate on
 $\unicode[STIX]{x1D70F}_{i}$
to arrive at
 $$\begin{eqnarray}\displaystyle \unicode[STIX]{x0394}u_{i}(\unicode[STIX]{x1D70F}_{i})\equiv u_{i}(h^{-})-u_{i}(h^{+})<\unicode[STIX]{x1D700}, & & \displaystyle\end{eqnarray}$$
where
 $\unicode[STIX]{x1D700}$
is a small tolerance (typically set to
 $10^{-12}$
in our work). Computationally,
 $\unicode[STIX]{x1D70F}_{i}$
and
 $\unicode[STIX]{x2202}P_{0}/\unicode[STIX]{x2202}X$
are obtained using a nested iteration. More specifically, for fixed
 $\unicode[STIX]{x2202}P_{0}/\unicode[STIX]{x2202}X$
,
 $\unicode[STIX]{x1D70F}_{i}$
is found in an inner iteration to satisfy relation (3.35). To prescribe lower and upper bounds for
 $\unicode[STIX]{x1D70F}_{i}$
in the inner iteration,
 $\unicode[STIX]{x1D70F}_{i}$
is typically expected to lie between
 $\unicode[STIX]{x1D70F}_{L}$
and
 $\unicode[STIX]{x1D70F}_{H}$
for each fluid. Subsequently,
 $\unicode[STIX]{x2202}P_{0}/\unicode[STIX]{x2202}X$
is obtained in an outer iteration to satisfy relation (2.5). The initial bounds for
 $\unicode[STIX]{x2202}P_{0}/\unicode[STIX]{x2202}X$
for the outer iteration are determined numerically. Knowing
 $\unicode[STIX]{x1D70F}_{i}$
,
 $\unicode[STIX]{x1D70F}_{H}$
and
 $\unicode[STIX]{x1D70F}_{L}$
, it is possible to derive lengthy algebraic expressions for the two interfacial velocities versus these stresses and, subsequently, for the flux functions in each fluid layer, which we do not present for brevity.
Examples of results obtained using the iterative technique explained in the text. (a,b) Validation against the Newtonian fluid results for
 $m=100$
,
 $\unicode[STIX]{x1D712}=10$
,
 $h_{X}=0$
: (a) flux versus interface height; (b) velocity profiles for a given interface height (
 $h=0.4$
), marked by the thick horizontal line. The symbols used for the slip cases are according to table 1, here and elsewhere. The small square dots superimposed on each curve are from the analytical relations for Newtonian fluids. (c,d) Validation against the results for a single viscoplastic fluid flow (by putting
 $h=1$
), with
 $\unicode[STIX]{x1D706}_{l}=0$
and
 $\unicode[STIX]{x1D706}_{u}=0,0.2,2,\infty$
: (c) velocity profiles for
 $B_{H}=0.5$
and
 $n_{H}=1$
; (d) velocity profiles for
 $B_{H}=0.5$
and
 $n_{H}=0.5$
. The lines show our results while the superimposed hollow squares are from figure 3 in Panaseti & Georgiou (Reference Panaseti and Georgiou2017). Note that, due to a different scaling compared to our work, the Bingham number and the upper wall slip coefficient in Panaseti & Georgiou (Reference Panaseti and Georgiou2017) are equivalent to
 $B_{H}/(1-B_{H})$
and
 $\unicode[STIX]{x1D706}_{u}(1-B_{H})$
, respectively.

To verify the iterative method used for non-Newtonian fluids, we have compared some flux functions and velocity profiles against the analytical solutions for Newtonian fluids. For given values of
 $m$
,
 $\unicode[STIX]{x1D712}$
and
 $h_{X}$
, an example of such a comparison is presented in figure 2(a,b), wherein the flux function and the velocity profiles for different slip cases are plotted. An extreme value of
 $m$
is intentionally chosen to verify the robustness of the numerical code. A perfect agreement is found between the analytical solutions and the results obtained through the iterative method explain above, for both the flux function and the velocity profiles. Finally, since there is a viscosity ratio between the fluids, there is a significant jump in
 $\unicode[STIX]{x2202}u/\unicode[STIX]{x2202}y$
at the interface (figure 2
b), which is well captured by the numerical method. In addition, we have further validated our model results against the recent work of Panaseti & Georgiou (Reference Panaseti and Georgiou2017) in which a single viscoplastic fluid flow is considered in a 2-D channel in which the upper wall is slippery. For various slip coefficients, figure 2(c,d) shows that our velocity profiles (found numerically) perfectly match those of Panaseti & Georgiou (Reference Panaseti and Georgiou2017). Note that, to obtain this comparison, one needs to put
 $h=1$
, which implies that only a pure heavy fluid flow is considered.
Main wall slip cases considered throughout the manuscript.

For a given interface height, the heavy fluid flux function was calculated using the method explained (analytically for Newtonian fluids and numerically for non-Newtonian fluids). Therefore, the kinematic condition was solved to give the interface motion versus time and space. To this end, fully developed flows were considered at the two channel ends, and an initially sharp interface was assumed to be localized at
 $X=0$
, following a linear function
 $h(X,T=0)=-X+0.5$
(unless otherwise stated), also typically used in previous studies. The slope of the function had little effects on the interface propagation at long times. Discretization of the kinematic condition was implemented in conservative form, first-order explicit in time and second-order in space, and a (shock capturing) Van Leer flux limiter scheme (Yee, Warming & Harten Reference Yee, Warming and Harten1985) was used for robust integration. A spatial mesh step of
 $\text{d}X=0.05$
was typically chosen, which was below the satisfactory convergence threshold. With regard to validation, our results for displacement flows in a channel with no-slip walls were successfully compared with those of Taghavi et al. (Reference Taghavi, Seon, Martinez and Frigaard2009).
3.2 Remarks
Even in its reduced form, our problem is governed by eight dimensionless parameters, i.e.
 $\unicode[STIX]{x1D712}$
,
 $m$
,
 $B_{H}$
,
 $B_{L}$
,
 $n_{H}$
,
 $n_{L}$
,
 $\unicode[STIX]{x1D706}_{u}$
and
 $\unicode[STIX]{x1D706}_{l}$
, making it difficult to provide quantitative predictions for the flow regimes that cover all ranges of these dimensionless groups. Thus, to better focus on the main features, we study Newtonian and non-Newtonian fluids separately. Regarding the former, we will study a wide range of detailed flow patterns/regimes based on reasonable variations of
 $\unicode[STIX]{x1D712}$
and
 $m$
. Concerning non-Newtonian fluids, we will first analyse the displacement efficiency for a wide range of parameters and then we will mainly concentrate on the variation of the rheological parameters that modify crucial viscoplastic displacement features, e.g. static residual wall layers (SRWLs). Finally regarding the channel wall slip conditions, we will study 4 displacement cases:
(i) Case I: no-slip at either wall;
(ii) Case II: slip at the lower wall only;
(iii) Case III: slip at the upper wall only;
(iv) Case IV: slip at both walls.
To provide a better understanding of the wall slip effects, we assume that significant slip occurs. Particularly, we consider relatively large values for the slip coefficients (
 $\unicode[STIX]{x1D706}_{l}$
and
 $\unicode[STIX]{x1D706}_{u}$
) and, unless otherwise stated, fix these values for the 4 cases according to table 1 throughout the paper.
4 Newtonian fluids
It is logical to start with exploring Newtonian fluid displacements since some of the major qualitative behaviours are common between Newtonian and more generalized fluids. In addition, thanks to a fewer dimensionless parameters, the analysis of Newtonian fluids is much simpler and the numerical solution is much faster.
Examples of displacements for
 $\unicode[STIX]{x1D712}=0$
and
 $T=0,1,\ldots ,9,10$
. In each column, the viscosity ratio is fixed: from left to right
 $m=0.1$
,
 $m=1$
and
 $m=10$
. From top to bottom each row belongs to Case I to Case IV. Contours illustrate the velocity field at
 $T=10$
.

4.1 Examples of typical behaviours
Figure 3 presents Newtonian displacement examples for a fixed
 $\unicode[STIX]{x1D712}$
value (
 $\unicode[STIX]{x1D712}=0$
, implying a viscous-dominated flow). Three viscosity ratios and four slip cases are illustrated. In all cases, as time grows, the initially steep interface quickly transitions to a slumping pattern with the leading front advancing near the lower wall. Regarding the displacements with no-slip boundary conditions (a–c), the flow behaviours are intuitive. As the leading front sweeps the displaced fluid near the lower wall, the trailing front seems to be pinned to the upper wall. When a more viscous fluid displaces a less viscous one, the displacement is efficient: the leading front height (
 $h_{f}$
) is large and the leading front speed (
 $V_{f}$
) is small. As
 $m$
increases, the displacement becomes less efficient: the height of the leading front decreases while its speed increases. The velocity contours superimposed on the subfigures (e.g. figure 3
c) also show that the displacing fluid moves much faster within the slumping layer. When slip occurs only at the lower wall (Case II, d–f), the displacement does not seem to be much affected, except for that, comparatively,
 $h_{f}$
values are slightly lower and
 $V_{f}$
values are slightly higher. However, the displacements in Case III (g–i) are more affected by slip at the upper wall. In fact, for all viscosity ratios the trailing front slips at the upper wall; however this slip appears to considerably affect the overall displacement only for
 $m=10$
. Comparing figure 3(i) to figure 3(c) and figure 3(f), it is clear that slip at the upper wall improves the displacement efficiency as
 $V_{f}$
remarkably decreases and
 $h_{f}$
increases. When slip occurs at both walls (Case IV), the displacement does not generally change compared to Case III, although, for large
 $m$
, figure 3(i) reveals that the displaced phase can slip ahead of the leading front.
Exploring displacement examples in which buoyancy was not strong (
 $\unicode[STIX]{x1D712}=0$
), slip at the upper wall appeared to be less significant in terms of impacting the flow. However, as buoyancy increases for lager
 $\unicode[STIX]{x1D712}$
, the trailing front can become unpinned and even move backward against the mean imposed flow direction; therefore, slip at the upper wall can become a crucial flow parameter. For brevity, we do not provide exhaustive figures to showcase these displacement examples. Instead, in the following subsections we will focus on certain features of the flow, for example long time front heights and speeds, which we examine for a wide range of parameters that include the slip cases. This in return will provide us with an understanding of when/where/how slip at either or both walls can affect the displacement flow.
4.2 Long time behaviours
Since the interface typically has a segment between two fronts (which move with constant velocities at long times), the slope of the interface (
 $h_{X}$
) becomes negligible throughout the interface except close to the fronts (which may have non-zero heights). Thus, we can assume that
 $h_{X}\rightarrow 0$
as
 $T\gg 1$
and that the long time interfacial behaviours can be approximated by
 $$\begin{eqnarray}\displaystyle \frac{\unicode[STIX]{x2202}h}{\unicode[STIX]{x2202}T}+\frac{\unicode[STIX]{x2202}\tilde{q}(h,\unicode[STIX]{x1D712},m,\unicode[STIX]{x1D706}_{l},\unicode[STIX]{x1D706}_{u})}{\unicode[STIX]{x2202}X}=0, & & \displaystyle\end{eqnarray}$$
where
 $\tilde{q}={q_{H}|}_{_{h_{X}=0}}$
. Let us first concentrate on the leading front. Due to the constant flux, as the interface elongates between
 $X_{f}$
(the leading front position) and
 $X_{b}$
(the trailing front position), the area behind it remains equal to
 $T$
, to conserve mass. On the other hand, the leading front moves with a constant height and speed at long times. Mathematically, all this can be summarized into the following equations:
 $$\begin{eqnarray}\displaystyle \tilde{q}(h_{f}^{\infty }) & = & \displaystyle h_{f}^{\infty }\frac{\unicode[STIX]{x2202}\tilde{q}}{\unicode[STIX]{x2202}h}(h_{f}^{\infty }),\end{eqnarray}$$
 $$\begin{eqnarray}\displaystyle V_{f}^{\infty } & = & \displaystyle \frac{\unicode[STIX]{x2202}\tilde{q}}{\unicode[STIX]{x2202}h}(h_{f}^{\infty }),\end{eqnarray}$$
where the superscript
 $\infty$
here and elsewhere denotes the value at long times (i.e.
 $T\rightarrow \infty$
). Therefore, to predict the displacement flow behaviours at long times, first
 $h_{f}^{\infty }$
can be found through the solution of (4.2) (equal areas rule) and then
 $V_{f}^{\infty }$
can be simply obtained from (4.3). Similarly, concerning the trailing front we can find
 $$\begin{eqnarray}\displaystyle 1-\tilde{q}(1-h_{b}^{\infty }) & = & \displaystyle h_{b}^{\infty }\frac{\unicode[STIX]{x2202}\tilde{q}}{\unicode[STIX]{x2202}h}(1-h_{b}^{\infty }),\end{eqnarray}$$
 $$\begin{eqnarray}\displaystyle V_{b}^{\infty } & = & \displaystyle \frac{\unicode[STIX]{x2202}\tilde{q}}{\unicode[STIX]{x2202}h}(1-h_{b}^{\infty }),\end{eqnarray}$$
using which the trailing front height and speed at long times can be calculated.
Use of the equal areas rule (4.2) in determining the leading front height at long times,
 $h_{f}^{\infty }$
, for the same parameters as in figure 3(c,f,i,l) (i.e.
 $\unicode[STIX]{x1D712}=0$
and
 $m=10$
): (a) Case I; (b) Case II; (c) Case III; (d) Case IV. Vertical broken line in each subfigure indicates the leading front height at long times determined from (4.2).

An example of the use of the equal areas rule (4.2) in the determination of
 $h_{f}^{\infty }$
is illustrated in figure 4, in which the results correspond to the long time interface behaviours in the simulations performed in figure 3(c,f,i,l) (i.e. the right column in figure 3). Different slip cases are examined. A few interpretations and comparisons can be made using this figure. First of all, a comparison between figure 4 and the corresponding simulations in figure 3 shows good agreement in terms of the prediction of the leading front heights at longer times. Second, it is seen that the slip cases significantly affect the variation of
 $(\unicode[STIX]{x2202}\tilde{q}/\unicode[STIX]{x2202}h)(h)$
versus
 $h$
and, consequently, the value of
 $h_{f}^{\infty }$
. Finally, for Cases I and II, one finds that
 $\unicode[STIX]{x2202}\tilde{q}/\unicode[STIX]{x2202}h(h)\rightarrow 0$
as
 $h\rightarrow 1$
; therefore, the trailing front at long times would be pinned to the upper wall, while for Cases III and IV,
 $\unicode[STIX]{x2202}\tilde{q}/\unicode[STIX]{x2202}h(h)>0$
as
 $h\rightarrow 1$
, implying that the trailing front would advance with a speed equal to
 $(\unicode[STIX]{x2202}\tilde{q}/\unicode[STIX]{x2202}h)(h=1)$
. Note that, regardless of the slip case, the leading front is not pinned and it always advances forward due to the formation of the kinematic shock, with a positive speed equal to
 $(\unicode[STIX]{x2202}\tilde{q}/\unicode[STIX]{x2202}h)(h=h_{f}^{\infty })$
, which in the case of figure 4 corresponds to the horizontal line separating the equal areas in each subfigure.
Heights and speeds of the leading front at long times versus
 $m$
. From left to right
 $\unicode[STIX]{x1D712}=0$
,
 $\unicode[STIX]{x1D712}=20$
and
 $\unicode[STIX]{x1D712}=50$
.

Figure 5 shows the variation of
 $h_{f}^{\infty }$
and
 $V_{f}^{\infty }$
versus
 $m$
for the four wall slip cases (within each subfigure) and three typical values of
 $\unicode[STIX]{x1D712}$
(in different subfigures). Concentrating on the top row, at all values of
 $\unicode[STIX]{x1D712}$
, the curve of
 $h_{f}^{\infty }$
versus
 $m$
in Case II lies below the curves for the other cases. In addition, figure 5(a) illustrates that, while
 $h_{f}^{\infty }$
in Cases I and II continuously decreases with
 $m$
, in Cases III and IV, it reaches a near plateau at large
 $m$
. However, for larger
 $\unicode[STIX]{x1D712}$
values shown in figure 5(b,c), the variation of
 $h_{f}^{\infty }$
versus
 $m$
can be non-monotonic. Looking at (d–f), at
 $\unicode[STIX]{x1D712}=0$
,
 $V_{f}$
gradually increases with
 $m$
, while the opposite is true at
 $\unicode[STIX]{x1D712}=50$
. Finally, as
 $\unicode[STIX]{x1D712}$
increases the variation of
 $V_{f}^{\infty }$
versus
 $m$
can be non-monotonic in Cases I and II.
Heights and speeds of the trailing front at long times versus
 $m$
. From left to right
 $\unicode[STIX]{x1D712}=0$
,
 $\unicode[STIX]{x1D712}=30$
and
 $\unicode[STIX]{x1D712}=200$
.

Figure 6 shows the variation of
 $h_{b}^{\infty }$
and
 $V_{b}^{\infty }$
versus
 $m$
for the four wall slip cases (within each subfigure) and three typical values of
 $\unicode[STIX]{x1D712}$
(in different subfigures). In comparison to figure 5, a generally different behaviour is observed. First, at
 $\unicode[STIX]{x1D712}=0$
,
 $h_{b}^{\infty }$
is zero for all the slip cases. For larger
 $\unicode[STIX]{x1D712}$
,
 $h_{b}^{\infty }$
is still zero for Cases I and II (expect for very small
 $m$
) but becomes appreciable for Cases III and IV. In addition, Case IV has the largest
 $h_{b}^{\infty }$
. For very large
 $\unicode[STIX]{x1D712}$
, for which there is a significant backflow against the mean imposed flow direction, the trailing front height remains
 ${\sim}0.4$
(with only small variations with
 $m$
) for all four slip cases. Regarding
 $V_{b}^{\infty }$
, at
 $\unicode[STIX]{x1D712}=0$
there is forward motion of the trailing fronts with notable speeds for Cases III and IV, although their heights remain equal to zero. The behaviour of
 $V_{b}^{\infty }$
at the intermediate value of
 $\unicode[STIX]{x1D712}$
is also noteworthy: starting from negative values,
 $V_{b}^{\infty }$
increases and crosses over into positive values for Cases III and IV, while for Cases I and II the trailing front does not move forward. For the largest
 $\unicode[STIX]{x1D712}$
,
 $V_{b}^{\infty }$
continuously increases with
 $m$
for all the slip cases, while the trailing front motion is fastest for Case IV (although it does not have the smallest height; cf. figure 6
c).
4.3 Critical stationary interface flows
Perhaps Taghavi et al. (Reference Taghavi, Seon, Wielage-Burchard, Martinez and Frigaard2011) were first to study critical stationary interfaces in buoyant displacement flows with Newtonian fluids. Their experiments and numerical simulations showed that for a critical value of
 $\unicode[STIX]{x1D712}$
, there exists a marginal stationary interface flow state, in which the trailing front is on the verge of moving upstream. Meanwhile the displacing fluid is advected from the domain, under an interface that remains stationary for the most part. The displaced layer above the interface is in counter-current motion with a zero net flux. A stationary interface flow state is a crucial flow feature in that it marks the transition between inefficient displacements (i.e. the trailing front moves upstream implying that the displaced phase cannot be washed away) and efficient ones (the trailing front does not move upstream implying that the displaced phase can be eventually washed away). In the view of our model, a stationary interface occurs with a flux equal to unity at an interface that has a zero speed. Concentrating at long times (in other words
 $h_{X}\rightarrow 0$
), the stationary interface condition satisfies
 $$\begin{eqnarray}\displaystyle \left.\begin{array}{@{}l@{}}\tilde{q}_{H}(1-h_{c},\unicode[STIX]{x1D712}_{c},m,\unicode[STIX]{x1D706}_{l},\unicode[STIX]{x1D706}_{u})=1,\\ \displaystyle \left.\frac{\unicode[STIX]{x2202}\tilde{q}_{H}(h,\unicode[STIX]{x1D712}_{c},m,\unicode[STIX]{x1D6EC})}{\unicode[STIX]{x2202}h}\right|_{h=1-h_{c}}=0,\end{array}\right\} & & \displaystyle\end{eqnarray}$$
where
 $\unicode[STIX]{x1D712}_{c}$
denotes the critical buoyancy number and
 $h_{c}$
the critical residual layer height (thickness) above the stationary interface. Note that
 $h_{c}$
is measured with respect to the upper wall.
 $h_{c}$
and
 $\unicode[STIX]{x1D712}_{c}$
can be obtained through solving the coupled equations above.
Variation of
 $h_{c}$
and
 $\unicode[STIX]{x1D712}_{c}$
versus
 $m$
, for the critical stationary flow state.

Figure 7(a) shows the variation of
 $h_{c}$
versus
 $m$
, for the four slip cases. It is interesting to note that
 $h_{c}$
has considerable values in all the slip cases. The behaviour of
 $h_{c}$
is slightly non-monotonic versus
 $m$
and versus the slip cases. In each slip case,
 $h_{c}$
seems to reach its maximum at a critical viscosity ratio
 $0.1<m<1$
, the value of which depends on the slip case. Also, in general, the curve of
 $h_{c}$
versus
 $m$
for Case II remains above the rest of the curves, while the one for Case III lies below the other curves. Finally, the behaviour of
 $h_{c}$
versus
 $m$
is similar for Cases I and IV, i.e. the two symmetric cases. This observation may be justified by a simple argument. When buoyancy is significant, a symmetric slip at both walls enhances the downward/upward motion of the heavy/light fluids at the lower/upper wall; loosely speaking, since this enhancement is more or less equal, the critical interface height is not much affected. More rigorously, using a series of expansions for a symmetric slip case (
 $\unicode[STIX]{x1D706}=\unicode[STIX]{x1D706}_{l}=\unicode[STIX]{x1D706}_{u}$
, with a small
 $\unicode[STIX]{x1D706}$
) in an iso-viscous displacement (
 $m=1$
), we find
 $$\begin{eqnarray}\displaystyle h_{c}=\frac{2-\sqrt{2}}{2}+(1-\sqrt{2})\unicode[STIX]{x1D706}+O(\unicode[STIX]{x1D706}^{2}). & & \displaystyle\end{eqnarray}$$
On the other hand, for
 $\unicode[STIX]{x1D706}\rightarrow \infty$
we can also analytically show that
 $$\begin{eqnarray}\displaystyle h_{c}={\textstyle \frac{1}{3}}. & & \displaystyle\end{eqnarray}$$
Therefore, for an iso-viscous case, the critical interface height varies only within the small range of
 $(2-\sqrt{2})/2=0.293$
(no slip) and
 $1/3=0.334$
(free slip), which is in agreement with the above discussion.
Figure 7(b) shows how
 $\unicode[STIX]{x1D712}_{c}$
varies versus
 $m$
for the four slip cases. Unlike
 $h_{c}$
,
 $\unicode[STIX]{x1D712}_{c}$
monotonically increases with
 $m$
, for which the increase rate is sharper at smaller
 $m$
. Finally,
 $\unicode[STIX]{x1D712}_{c}$
for Case I has generally the largest value while the opposite is true for Case IV. Therefore, the effects of slip on
 $\unicode[STIX]{x1D712}_{c}$
and
 $h_{c}$
are not the same.
4.4 Characteristic spreading length of the front
Looking back at the interface profiles in figure 3, it can be recognized that the interfacial slopes are much sharper at the frontal region, where diffusive spreading of the interface is dominant. In fact, the curved shape of the leading (or trailing) front is due to these significant diffusive effects. In order to find the front shape, we can follow the approach explained in Taghavi et al. (Reference Taghavi, Seon, Martinez and Frigaard2009), which is based on calculating
 $h_{f}^{\infty }$
and
 $V_{f}^{\infty }$
, and then shifting to a reference frame that moves with
 $V_{f}^{\infty }$
(i.e.
 $\unicode[STIX]{x1D701}=X-V_{f}^{\infty }T$
), to finally arrive at a steadily travelling interface solution:
 $$\begin{eqnarray}\displaystyle \frac{\text{d}}{\text{d}\unicode[STIX]{x1D701}}[hV_{f}^{\infty }-q_{H}(h,h_{\unicode[STIX]{x1D701}},\unicode[STIX]{x1D712},m,\unicode[STIX]{x1D706}_{l},\unicode[STIX]{x1D706}_{u})] & = & \displaystyle 0,\nonumber\\ \displaystyle \Rightarrow q_{H}(h,h_{\unicode[STIX]{x1D701}},\unicode[STIX]{x1D712},m,\unicode[STIX]{x1D706}_{l},\unicode[STIX]{x1D706}_{u}) & = & \displaystyle hV_{f}^{\infty }.\end{eqnarray}$$
The equation above can be simply solved for
 $h\in (0,h_{f}^{\infty })$
to deliver the leading front shape (and similarly the trailing front shape provided that the equations are accordingly modified). However, the shape of the diffusive front is of less interest compared to the characteristic spreading length of the front,
 $\unicode[STIX]{x1D701}_{L}$
, which we define as the longitudinal length over which the leading front shape extends. Following Taghavi et al. (Reference Taghavi, Mollaabbasi and St-Hilaire2017), to calculate this characteristic length, we assume that the frontal region in the interval of (
 $0,h_{f}^{\infty }$
) varies only linearly over
 $\unicode[STIX]{x1D701}_{L}$
, implying that the interface slope in relation (4.9) can be replaced by
 $-h_{f}^{\infty }/\unicode[STIX]{x1D701}_{L}$
. Integration within the frontal region delivers
 $$\begin{eqnarray}\displaystyle \int _{0}^{h_{f}^{\infty }}q_{H}\left(h,-\frac{h_{f}^{\infty }}{\unicode[STIX]{x1D701}_{L}},\unicode[STIX]{x1D712},m,\unicode[STIX]{x1D706}_{l},\unicode[STIX]{x1D706}_{u}\right)\text{d}h & {\approx} & \displaystyle \int _{0}^{h_{f}^{\infty }}hV_{f}^{\infty }\,\text{d}h=\frac{V_{f}^{\infty }(h_{f}^{\infty })^{2}}{2},\end{eqnarray}$$
 $$\begin{eqnarray}\displaystyle \Rightarrow \int _{0}^{h_{f}^{\infty }}q_{H}\left(h,-\frac{h_{f}^{\infty }}{\unicode[STIX]{x1D701}_{L}},\unicode[STIX]{x1D712},m,\unicode[STIX]{x1D706}_{l},\unicode[STIX]{x1D706}_{u}\right)\text{d}h & {\approx} & \displaystyle \frac{(h_{f}^{\infty })^{2}}{2}\left.\frac{\unicode[STIX]{x2202}\tilde{q}_{H}(h,\unicode[STIX]{x1D712},m,\unicode[STIX]{x1D706}_{l},\unicode[STIX]{x1D706}_{u})}{\unicode[STIX]{x2202}h}\right|_{h=h_{f}^{\infty }}.\end{eqnarray}$$
To find the characteristic spreading length for a given set of parameters (
 $\unicode[STIX]{x1D712},m,\unicode[STIX]{x1D706}_{l},\unicode[STIX]{x1D706}_{u}$
), first
 $h_{f}^{\infty }$
is calculated using (4.2) and then an iterative method is used to obtain
 $\unicode[STIX]{x1D701}_{L}$
that satisfies (4.11).
The leading front characteristic spreading length,
 $\unicode[STIX]{x1D701}_{L}$
, versus
 $m$
. From left to right
 $\unicode[STIX]{x1D712}=0$
,
 $\unicode[STIX]{x1D712}=20$
and
 $\unicode[STIX]{x1D712}=50$
.

Figure 8(a) illustrates the variation of
 $\unicode[STIX]{x1D701}_{L}$
versus
 $m$
, at
 $\unicode[STIX]{x1D712}=0$
, for the four slip cases. As can be seen,
 $\unicode[STIX]{x1D701}_{L}$
decreases with
 $m$
; however, the values of
 $\unicode[STIX]{x1D701}_{L}$
and the decrease rate of
 $\unicode[STIX]{x1D701}_{L}$
versus
 $m$
both highly depend on the slip cases. Figure 8(b) shows that, as
 $\unicode[STIX]{x1D712}$
increases,
 $\unicode[STIX]{x1D701}_{L}$
decreases. Comparatively, figure 8(c) suggests that the effects of the wall slip and the viscosity ratio on
 $\unicode[STIX]{x1D701}_{L}$
become more or less unimportant as
 $\unicode[STIX]{x1D712}$
is increased to large values (i.e. when the flow becomes strongly buoyant).
4.5 Short time behaviour
In the limit of
 $T\ll 1$
, we may expect flow reversal to occur due to significant buoyancy (large interface slopes), implying that gravitational spreading dominates the flow at short times. Therefore, to study the flow at short times, it is natural to reconsider (3.17) while shifting to a steadily moving frame of reference
 $z=X-T$
:
 $$\begin{eqnarray}\displaystyle \frac{\unicode[STIX]{x2202}h}{\unicode[STIX]{x2202}T}+\frac{\unicode[STIX]{x2202}}{\unicode[STIX]{x2202}z}[q_{H,A}+q_{H,B}(\unicode[STIX]{x1D712}-h_{X})-h]=0, & & \displaystyle\end{eqnarray}$$
where the first and second terms in the bracket represent the advective and the buoyancy-driven components of the flux, respectively. Defining
 $\unicode[STIX]{x1D702}=z/\sqrt{T}$
and assuming
 $T\sim 0$
, we arrive at
 $$\begin{eqnarray}\displaystyle \frac{1}{2}\unicode[STIX]{x1D702}\frac{\text{d}h}{\text{d}\unicode[STIX]{x1D702}}=\frac{\text{d}}{\text{d}\unicode[STIX]{x1D702}}\left(-q_{H,B}\frac{\text{d}h}{\text{d}\unicode[STIX]{x1D702}}\right). & & \displaystyle\end{eqnarray}$$
Looking into the literature of similar multilayer flow problems, we find that Taghavi et al. (Reference Taghavi, Seon, Martinez and Frigaard2009) and Martin et al. (Reference Martin, Rakotomalala, Talon and Salin2011) argue that, due to singularity issues, in place of
 $h(\unicode[STIX]{x1D702})$
it is more comfortable to work with
 $\unicode[STIX]{x1D702}(h)$
, for which the boundary conditions are:
 $\unicode[STIX]{x1D702}(0)=\unicode[STIX]{x1D702}_{0}$
and
 $\unicode[STIX]{x1D702}(1)=\unicode[STIX]{x1D702}_{1}$
with unknown values of
 $\unicode[STIX]{x1D702}_{0}$
and
 $\unicode[STIX]{x1D702}_{1}$
, which depend on the slip conditions among the other parameters. Since slumping due to gravity leads to a strong interpenetration of the fluids, we can always expect that
 $\unicode[STIX]{x1D702}_{0}>0$
and
 $\unicode[STIX]{x1D702}_{1}<0$
, which we use as an assumption to compute the solution of (4.13) through a numerical method (here a shooting method).
The similarity solution
 $h(\unicode[STIX]{x1D702})$
. From left to right
 $m=0.1$
,
 $m=1$
and
 $m=10$
.

Figure 9 shows the similarity solutions,
 $\unicode[STIX]{x1D702}(h)$
, for various
 $m$
and wall slip cases. It is seen that the viscosity ratio and the slip conditions significantly affect the interface shape. In particular, the solution is not symmetric for
 $m\neq 1$
, since a more viscous fluid further resists motion. In addition, the solution is slightly asymmetric when the fluids slip at one of the channel walls, for obvious reasons.
Figure 10(a) depicts
 $\unicode[STIX]{x1D702}_{0}$
and
 $\unicode[STIX]{x1D702}$
as a function of
 $m$
for the four wall slip cases. The asymmetry discussed above is also quite clear. Figure 10(b) depicts the variation of
 $h_{0}\equiv h(\unicode[STIX]{x1D702})|_{\unicode[STIX]{x1D702}=0}$
versus
 $m$
for the four wall slip cases. While for Case I at
 $m=1$
one finds
 $h_{0}=0.5$
(as expected), the curve of
 $h_{0}$
versus
 $m$
is symmetric about the point
 $(m,h_{0})=(1,0.5)$
, which may be also expected. However, the symmetry is broken for Case II and certainly for Cases III and IV, where even a non-monotonic variation of
 $h_{0}$
versus
 $m$
is observed.
Values of (a)
 $\unicode[STIX]{x1D702}_{0}$
and
 $\unicode[STIX]{x1D702}$
and (b)
 $h_{0}$
, versus
 $m$
.

An additional feature observed in figure 10 is that when
 $m<1$
the lower boundary condition seems more determinant as the results of Cases I and III approach each other; the same trend is observed for the results of Cases II and IV. On the other hand, when
 $m>1$
this trend is reversed and the upper boundary condition seems more determinant. An explanation for this behaviour lies in the fact that the wall slip velocities are proportional to the wall shear stresses, which are scaled with the heavy fluid’s effective viscosity. Therefore, at a constant slip coefficient, for
 $m<1$
the wall slip velocity is relatively larger at the lower wall, while for
 $m>1$
the wall slip velocity is relatively larger at the upper wall. Note that the same principle can be applied to all the results presented throughout the paper (Newtonian and non-Newtonian cases): for
 $m<1$
(
 $m>1$
) the lower (upper) wall slip dominates that of the upper (lower) wall.
4.5.1 A simplified model for interface evolution at short times
To better understand displacement flow behaviours at short times, we develop a simplified analysis, for which we crudely assume that the interface slope stretched between the spatial positions of the leading and trailing fronts,
 $X_{f}$
and
 $X_{b}$
(respectively), has an average slope of
 $\bar{h}_{X}\approx -1/(X_{f}-X_{t})$
. We also assume that the leading front height and speed can be still approximated through modifying equations (4.2) and (4.3):
 $$\begin{eqnarray}\displaystyle q(h_{f},\bar{h}_{X}) & {\approx} & \displaystyle h_{f}\frac{\unicode[STIX]{x2202}q}{\unicode[STIX]{x2202}h}(h_{f},\bar{h}_{X}),\end{eqnarray}$$
 $$\begin{eqnarray}\displaystyle V_{f} & {\approx} & \displaystyle \frac{\unicode[STIX]{x2202}q}{\unicode[STIX]{x2202}h}(h_{f},\bar{h}_{X}).\end{eqnarray}$$
The trailing front height (
 $h_{b}$
) and speed (
 $V_{b}$
) can be similarly approximated by modifying (4.4) and (4.5). Finally, the leading and trailing front positions can be linked to the leading and trailing front velocities by
 $$\begin{eqnarray}\displaystyle X_{f} & = & \displaystyle \int _{0}^{T}V_{f}\,\text{d}t,\end{eqnarray}$$
 $$\begin{eqnarray}\displaystyle X_{b} & = & \displaystyle \int _{0}^{T}V_{b}\,\text{d}t.\end{eqnarray}$$
The system of equations above provides a simple framework to analyse the leading and trailing front heights and speeds, perhaps more systematically than performing simulations, for which for instance defining a front height at short times is not straightforward.
Short time behaviours for
 $\unicode[STIX]{x1D712}=0$
. From left to right
 $m=0.1$
,
 $m=1$
and
 $m=10$
.
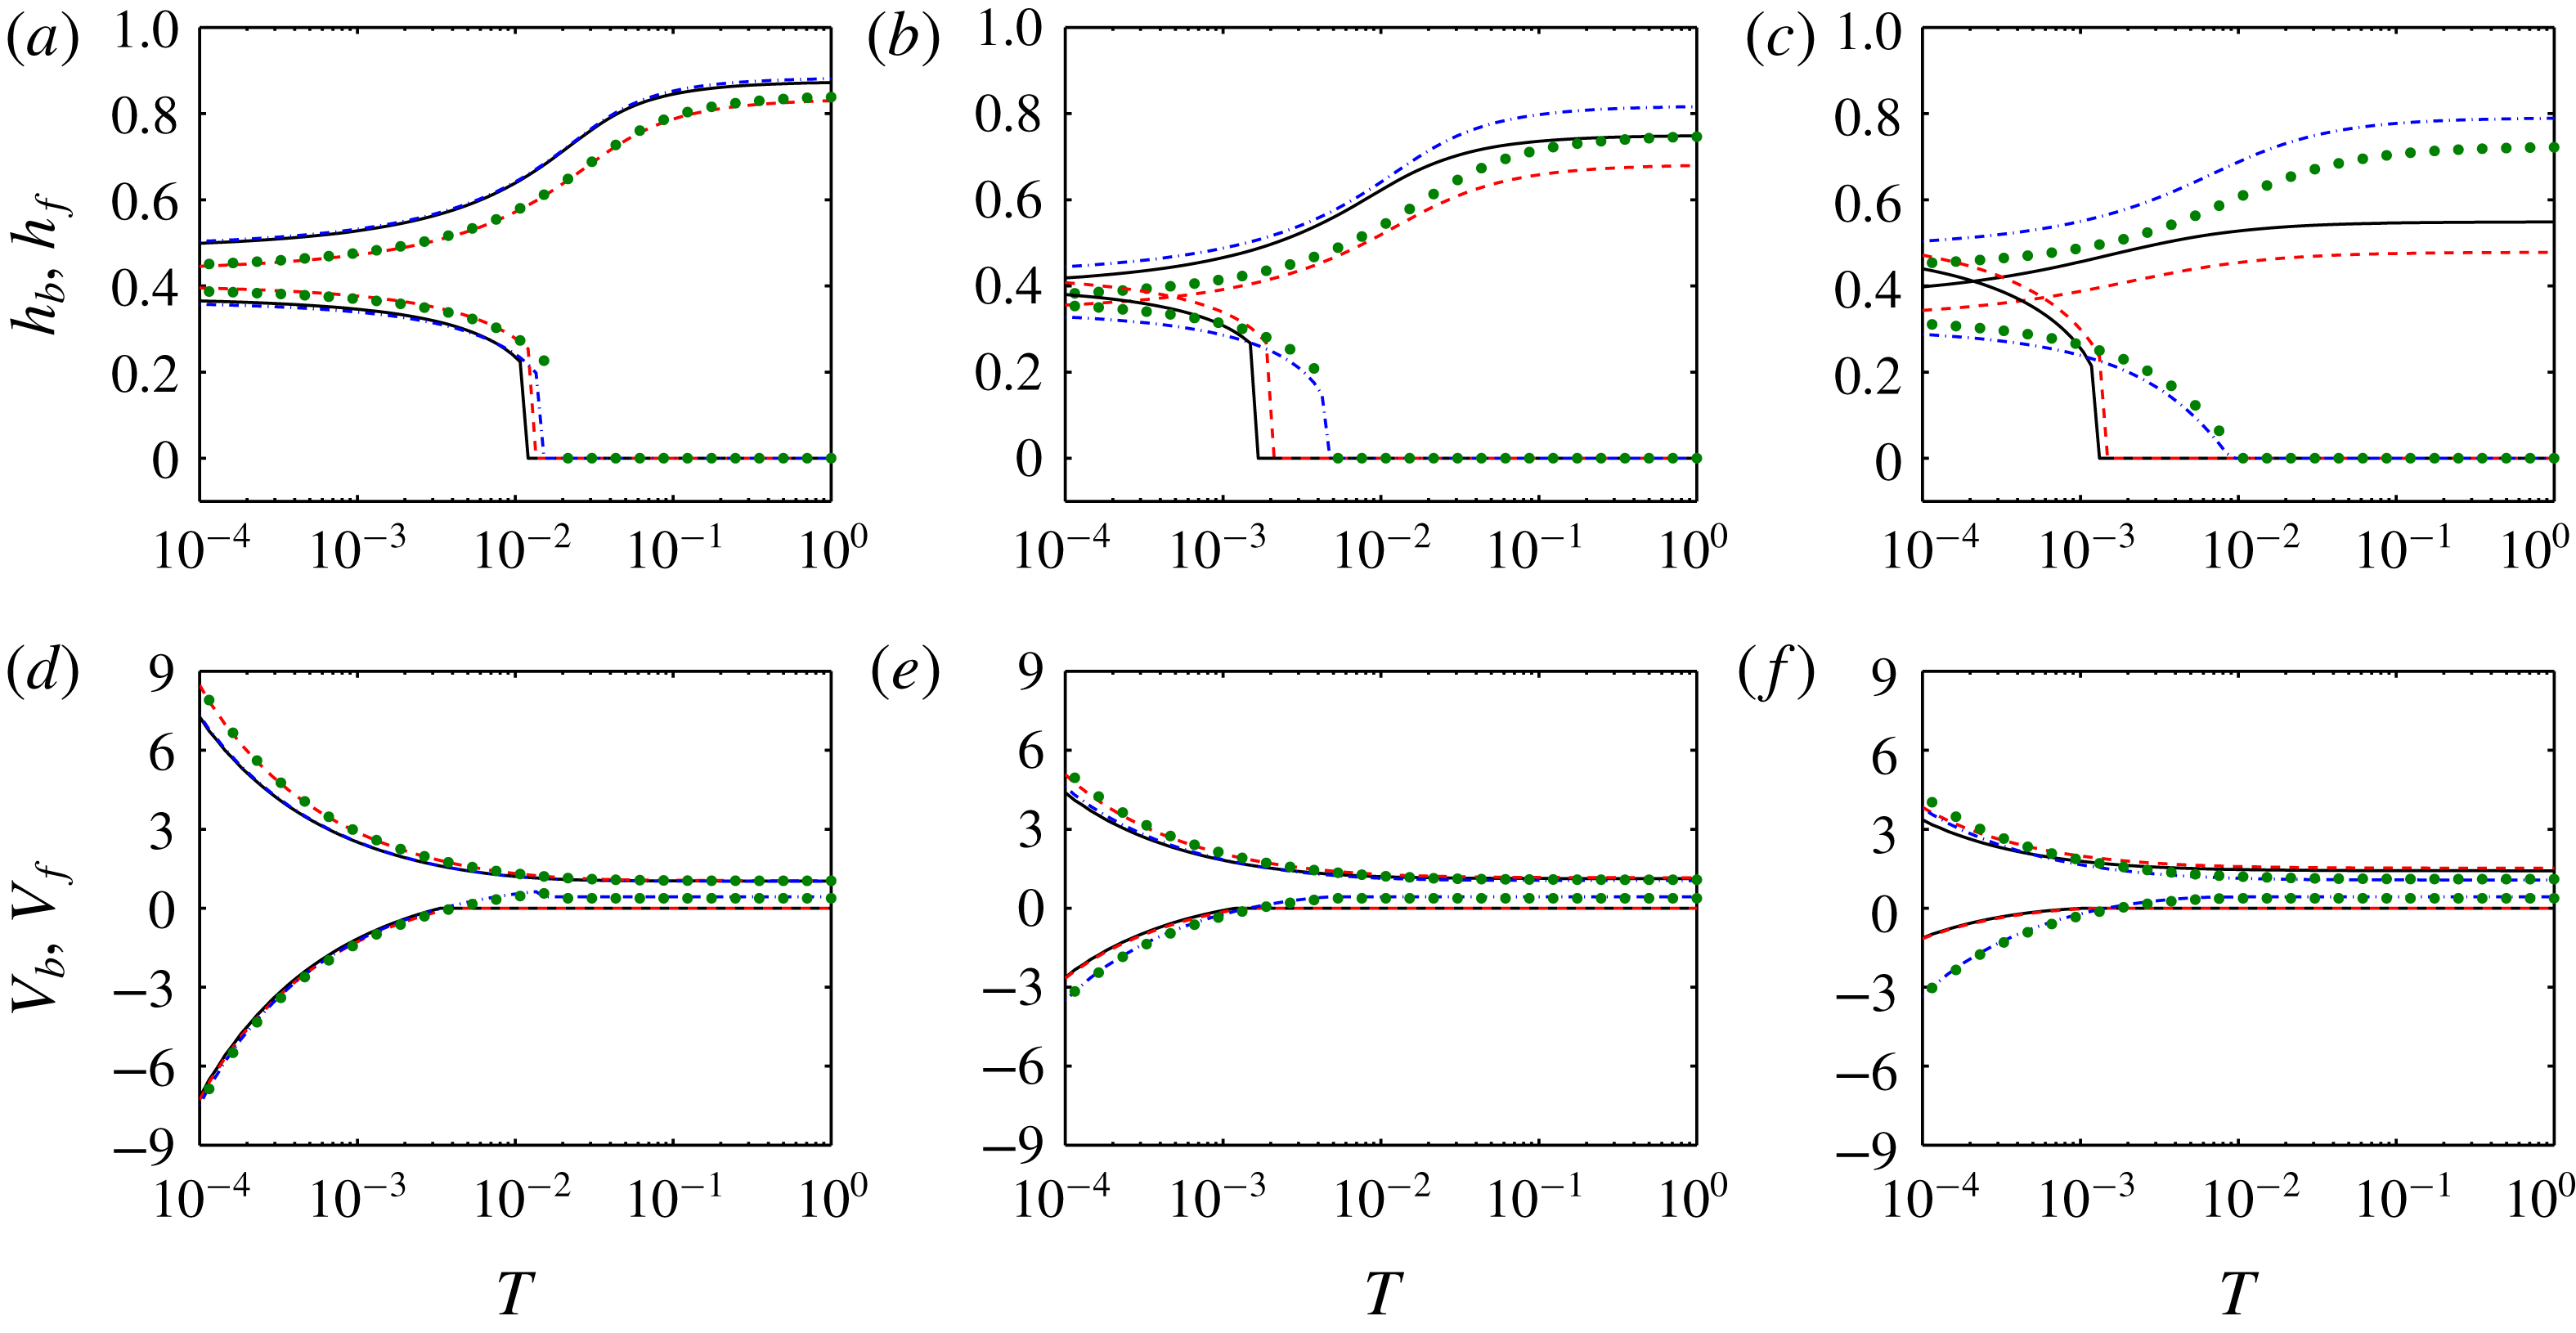
Figure 11 plots the variation of the leading and trailing front heights and speeds versus time, at
 $\unicode[STIX]{x1D712}=0$
, for different
 $m$
and the four slip cases. In general, it is observed that the leading/trailing front height increases/decreases as time grows. On the other hand,
 $|V_{f}|$
and
 $|V_{b}|$
both decrease with time. It is interesting to note that generally
 $|V_{f}|\neq |V_{b}|$
and that
 $V_{f}$
remains always positive (as expected) but
 $V_{b}$
crosses over between negative and positive values. In addition,
 $h_{f}$
and
 $h_{b}$
are far from symmetric with respect to
 $h=0.5$
. In general, it can be also said that the front heights and speeds reach their steady values as
 $T\sim O(10^{-1})$
. Finally, lower/higher viscosity ratios further affect the leading/trailing front velocities, which, as explained earlier, is simply to the dominance of the wall slip at the lower/upper wall.
4.6 Lock-exchange flows
Our main purpose in this paper is to study two-layer flows for which there is always an imposed flow velocity (
 $\hat{V}_{0}\neq 0$
). In this case, the model is valid for small and large values of the buoyancy number. However, an important class of problems, i.e. the lock-exchange flows, cannot be directly evaluated using the scaling presented earlier (since
 $\unicode[STIX]{x1D712}\rightarrow \infty$
as
 $\hat{V}_{0}\rightarrow 0$
). Therefore, it is worth developing and presenting an alternative lubrication model scaling, exclusively for the case of lock-exchange flows in an inclined channel. To do so, we re-scale velocities using a characteristic velocity defined as
 $$\begin{eqnarray}\displaystyle \hat{V}_{c}\equiv \frac{(\hat{\unicode[STIX]{x1D70C}}_{H}-\hat{\unicode[STIX]{x1D70C}}_{L}){\hat{g}}D_{0}^{2}\cos \unicode[STIX]{x1D6FD}}{2\hat{\unicode[STIX]{x1D707}}_{H}}, & & \displaystyle\end{eqnarray}$$
which is simply the longitudinal component of a viscous velocity scale obtained through balancing viscous and buoyant stresses. We can therefore re-define the lubrication model parameters as
 $$\begin{eqnarray}\displaystyle \unicode[STIX]{x1D712}_{e} & = & \displaystyle 2,\end{eqnarray}$$
 $$\begin{eqnarray}\displaystyle \unicode[STIX]{x1D6FF}_{e} & = & \displaystyle \frac{\cot \unicode[STIX]{x1D6FD}}{2},\end{eqnarray}$$
 $$\begin{eqnarray}\displaystyle X_{e} & = & \displaystyle \unicode[STIX]{x1D6FF}_{e}x,\end{eqnarray}$$
 $$\begin{eqnarray}\displaystyle T_{e} & = & \displaystyle \unicode[STIX]{x1D6FF}_{e}t,\end{eqnarray}$$
 $$\begin{eqnarray}\displaystyle P_{e} & = & \displaystyle \unicode[STIX]{x1D6FF}_{e}p,\end{eqnarray}$$
 $$\begin{eqnarray}\displaystyle V_{e} & = & \displaystyle v/\unicode[STIX]{x1D6FF}_{e}.\end{eqnarray}$$
For Newtonian fluids, the definition of
 $m$
,
 $\unicode[STIX]{x1D706}_{l}$
and
 $\unicode[STIX]{x1D706}_{u}$
would not be affected by the alternative scaling. The lock-exchange flow flux function can be simply obtained through removing the advective component from
 $q_{H}$
to find
 $$\begin{eqnarray}\displaystyle q_{H,e}=q_{H,B}(\unicode[STIX]{x1D712}_{e}-h_{X_{e}}). & & \displaystyle\end{eqnarray}$$
In all the above relations, the subscript
 $e$
represents the lock-exchange flow case.
Examples of lock-exchange interface profiles for
 $m=1$
and
 $T_{e}=0,10,\ldots ,90,100$
. For a better visualization of symmetry/asymmetry, a bold line marks the last profile (corresponding to
 $T_{e}=100$
). A steep linear function, i.e.
 $h(X,T_{e}=0)=-10X_{e}+0.5$
, is used as the initial profile. (a) Case I; (b) Case II; (c) Case III; (d) Case IV.

Figure 12 illustrates the evolution of the lock-exchange interface profiles for the four slip cases, for an iso-viscous displacement. The interface evolution is initially faster due to a large interface slope. At longer times the interface evolution slows down and the interface steadily evolves due to the channel slope. The symmetric slip cases, i.e. Case I (no slip at either wall) and Case IV (equal slip at both walls), present a symmetric flow evolution, although the interpenetration is stronger in Case IV, as expected. The interface profiles of Cases II and III present asymmetric flows. To highlight this, the interface positions at
 $X_{e}=0$
are also marked by the arrows. Overall, figure 12 shows that the wall slip cases affect lock-exchange flows at both short and long times.
5 Non-Newtonian fluids
Here, we analyse the results for non-Newtonian fluid displacements, which may have common interfacial features with Newtonian ones. Although these features can be quantified using the very same techniques discussed earlier, we do not repeat the analysis for brevity. Instead, in this section, after briefly exploring some of the general features, we shall focus on the flow behaviours that are of concern/importance only to viscoplastic displacements.
Examples of viscoplastic displacements for
 $m=10$
,
 $\unicode[STIX]{x1D712}=0$
,
 $n_{L}=n_{H}=1$
and
 $T=0,1,\ldots ,9,10$
. In (a–d)
 $B_{H}=0.5$
and
 $B_{L}=0$
; in (e–h)
 $B_{H}=0$
and
 $B_{L}=9$
. From top to bottom each row belongs to Case I–Case IV. Contours illustrate the velocity field at
 $T=10$
.

Let us first review some of the general non-Newtonian displacement patterns. Figure 13 depicts examples of viscoplastic displacements, for fixed values of
 $m=10$
and
 $\unicode[STIX]{x1D712}=0$
, wherein either the displacing or displaced fluid has a yield stress. The power-law index values are also fixed to
 $n_{H}=n_{L}=1$
. The simulation results for the four wall slip cases are plotted. When
 $B_{H}=0.5$
and
 $B_{L}=0$
, the displacement is quite efficient for Cases III and IV and less efficient for Cases I and II, while the leading front height is minimum for Case II and maximum for Case III. Similar to Newtonian fluid displacements, the interface moves at the upper wall when the upper wall slip conditions are implemented (Cases III and IV). When the displaced fluids has a yield stress (
 $B_{H}=0$
and
 $B_{L}=9$
), the behaviour is different for Cases I and II. In particular, a static residual wall layer (SRWL) is observed in figure 13(e,f). The SRWL thickness is larger for Case II compared to that for Case I, implying that slip at the lower wall can influence the static layer attached to the upper wall. The displacements in both Case I and Case II are far from efficient. However, for Cases III and IV, the situation changes completely. As the trailing front advances on the upper wall, the displaced fluid is easily removed and there is no static layer.
Examples of flux for
 $m=10$
and
 $h_{X}=0$
: (a)
 $\unicode[STIX]{x1D712}=0$
,
 $n_{L}=n_{H}=1$
,
 $B_{H}=0.5$
and
 $B_{L}=0$
; (b)
 $\unicode[STIX]{x1D712}=0$
,
 $n_{L}=n_{H}=1$
,
 $B_{H}=0$
and
 $B_{L}=9$
; (c)
 $\unicode[STIX]{x1D712}=20$
,
 $n_{L}=n_{H}=0.5$
,
 $B_{H}=0.5$
and
 $B_{L}=0$
; (d)
 $\unicode[STIX]{x1D712}=20$
,
 $n_{L}=n_{H}=0.5$
,
 $B_{H}=0$
and
 $B_{L}=9$
.

Some of the features observed can be simply understood through exploring the variation of the flux function,
 $q_{H}$
, versus the interface height,
 $h$
, for different parameters that include non-Newtonian effects. An example of this is presented in figure 14, where for simplicity
 $m=10$
and
 $h_{X}=0$
(implying long time behaviours). The buoyancy number and the power-law indices are also set to typical values. Above a certain value of
 $h<1$
,
 $q_{H}$
reaches unity, implying that SRWLs of the displace fluid could exist only for these slip cases, i.e. Cases I and II. Figure 14 also reveals that
 $\unicode[STIX]{x1D712}$
is also an influential parameter on the variation of
 $q_{H}$
versus
 $h$
, and consequently on the interface shape in viscoplastic displacements. Finally, since
 $m>1$
the upper boundary condition is determinant (note for example that the solid and dashed lines are closer to each other and the dash-dot line and dots are also closer).
Displacement efficiency,
 $\boldsymbol{E}$
, in the plane of dimensionless groups, for
 $\unicode[STIX]{x1D712}=0$
and
 $n_{L}=n_{H}=1$
. (a–d) Show
 $\boldsymbol{E}$
in the plane of
 $m$
and
 $B_{H}$
when a viscoplastic fluid displaces a Newtonian fluid (
 $B_{L}=0$
). (e–h) Show
 $\boldsymbol{E}$
in the plane
 $m$
and
 $B_{L}$
when a Newtonian fluid (
 $B_{H}=0$
) displaces a viscoplastic fluid. (i–l) Show
 $\boldsymbol{E}$
in the plane of
 $B_{H}$
and
 $B_{L}$
(for a fixed
 $m=1$
) when a viscoplastic fluid displaces another viscoplastic fluid. The values of
 $\boldsymbol{E}$
are marked by the symbol size and colours. From top to bottom, each row belongs to Case I–Case IV. In each subfigure, the most efficient displacements are marked by superimposed


In order to enable a comparison among a large number of results for non-Newtonian displacement flows, let us rely on an indicator for displacement efficiency (
 $\boldsymbol{E}$
), which we define as the fraction of the displaced fluid that has been removed from the channel at long times (here we take
 $T=10$
):
 $$\begin{eqnarray}\displaystyle \boldsymbol{E}=\frac{\displaystyle \int _{0}^{X_{f}}h(X,T=10)\,\text{d}X}{X_{f}}. & & \displaystyle\end{eqnarray}$$
Therefore, to find
 $\boldsymbol{E}$
, we first numerically integrate the area under a developed interface between
 $X=0$
and
 $X=X_{f}$
; then, we find the ratio of this area to the area of an ideal displacement (100 % efficient), i.e.
 $X_{f}\times 1$
. Thanks to the mass conservation, the numerator in (5.1) must be equal to
 $T$
, which is the condition that we have used to ensure that our numerical code conserves mass for all simulations.
Figure 15 addresses Newtonian–viscoplastic, viscoplastic–Newtonian and viscoplastic–viscoplastic displacement scenarios in terms of the displacement efficiency. In each subfigure, the most efficient displacements are marked by superimposed

 $\boldsymbol{E}$
are quite close to one another (within 1 % difference in
 $\boldsymbol{E}$
). When a viscoplastic fluid displaces a Newtonian fluid (left column),
 $m$
affects
 $\boldsymbol{E}$
more than
 $B_{H}$
does. In general, the lower viscosity ratio flows have higher displacement efficiencies. The least efficient displacement for each slip case is typically found at the largest values of
 $m$
and
 $B_{H}$
. In addition, the most efficient displacements are in general found for Case III, where the heavy fluid does not slip at the lower wall and only the light fluid slips at the upper wall. When a Newtonian fluid displaces a viscoplastic fluid (middle column), compared to the left column, the displacements are more efficient in some cases and less efficient in some others. Although the most efficient displacements for each slip case are found at the smallest values of
 $m$
and
 $B_{L}$
, the least efficient displacements are not necessarily found at the largest values of
 $m$
and
 $B_{L}$
. Especially for Case IV, the least efficient displacements are somewhat scattered. Moreover, the displacement efficiencies for Case III are very close and do not much vary in the plane of
 $m$
and
 $B_{L}$
. Finally, when a viscoplastic fluid displaces another viscoplastic fluid (right column),
 $\boldsymbol{E}$
highly depends on the values of
 $B_{H}$
and
 $B_{L}$
as well as the slip case. When there is no slip (figure 15
i: Case I), the most efficient displacement is found for the maximum value of
 $B_{L}$
and the minimum value of
 $B_{H}$
. For slip cases, the largest values of
 $\boldsymbol{E}$
are found for Case III and the smallest values of
 $\boldsymbol{E}$
for Case II. Reviewing the results provided by figure 15 highlights the fact that the displacement efficiency for the slip cases do not necessarily follow a definitive trend in terms of variations in
 $m$
,
 $B_{L}$
and
 $B_{H}$
, implying that numerical simulations must be performed for each individual case to obtain the displacement behaviour and find the displacement efficiency.
Short time interface behaviours for
 $\unicode[STIX]{x1D712}=0$
,
 $m=51$
,
 $B_{H}=0$
,
 $B_{L}=50$
,
 $n_{H}=n_{L}=1$
and
 $T=(0,1,\ldots ,9,10)\times 4\times 10^{-4}$
: (a) Case I; (b) Case II; (c) Case III; (d) Case IV. Horizontal dashed lines mark the maximal SRWL predictions at long times, calculated using the method explained in § 5.1.

Figure 16 illustrates the short time interface behaviours for a viscoplastic displacement in which the displaced fluid has a large yield stress. To obtain these results, the initial interface has been significantly sharpened. Cases I and II eventually present a SRWL as time grows. For the same parameters, Cases III and IV do not present a SRWL, as the light fluid slips at the upper wall. Therefore, the overall displacement is more efficient for these cases. However, it must be noted that, even for Cases I and II, the light layer attached to the upper wall is not initially static as the interface slowly moves at very short times (except for
 $h=1$
). This observation is related to the fact that buoyancy stresses are initially large due to the slope of the interface. As the interface slumps and its slope decreases, the light fluid’s yield stress is able to overcome the decreasing local buoyancy stresses. Thus, the moving layer above the interface evolves into a SRWL over a short time scale. Due to their fundamental and practical importance, we shall focus the rest of the paper to analysing SRWLs at longer times, which appear exclusively in displacement flows with generalized Newtonian fluids.
5.1 Static residual wall layers
Although the literature of static wall layers in viscoplastic fluid flows is expanding thanks to the recent works of Roustaei & Frigaard (Reference Roustaei and Frigaard2013), Roustaei & Frigaard (Reference Roustaei and Frigaard2015), Roustaei, Gosselin & Frigaard (Reference Roustaei, Gosselin and Frigaard2015), Mollaabbasi & Taghavi (Reference Mollaabbasi and Taghavi2016) and others, it was perhaps Allouche et al. (Reference Allouche, Frigaard and Sona2000) who pioneered a model to analyse SRWLs in viscoplastic displacement flows, for the case of a vertical channel flow (i.e. symmetric). Taghavi et al. (Reference Taghavi, Seon, Martinez and Frigaard2009) extended the work of Allouche et al. (Reference Allouche, Frigaard and Sona2000) to slumping displacements in a channel with no-slip boundary conditions. These and similar works have demonstrated that, for the cases where SRWLs exist, the maximal SRWL thickness is typically observed at longer times. Therefore, we also concentrate our analysis on long times and rely on a similar procedure proposed by Allouche et al. (Reference Allouche, Frigaard and Sona2000) and Taghavi et al. (Reference Taghavi, Seon, Martinez and Frigaard2009) to calculate our SRWL thickness for displacements with wall slip.
Below, we will systematically analyse the formation of SRWLs, for the four wall slip cases. First, we will treat Cases I and II and then extend our analysis to a marginal state for Cases III and IV.
5.1.1 Static wall layers for Cases I and II
Assuming that fluid
 $L$
is fully static for
 $y\in [h,1]$
, the governing equation for the heavy fluid motion can be written as
 $$\begin{eqnarray}\displaystyle \frac{\unicode[STIX]{x2202}}{\unicode[STIX]{x2202}y}\unicode[STIX]{x1D70F}_{H,Xy}=\frac{\unicode[STIX]{x2202}P_{0}}{\unicode[STIX]{x2202}X},\quad y\in (0,h_{s}), & & \displaystyle\end{eqnarray}$$
where
 $h_{s}$
is the corresponding interface height. The appropriate boundary conditions are
 $$\begin{eqnarray}\displaystyle u(0) & = & \displaystyle \unicode[STIX]{x1D706}_{l}\unicode[STIX]{x1D70F}_{H},\end{eqnarray}$$
 $$\begin{eqnarray}\displaystyle u(h_{s}) & = & \displaystyle 0.\end{eqnarray}$$
On the other hand, the flow rate condition becomes
 $$\begin{eqnarray}\displaystyle \int _{0}^{h_{s}}u(y)\,\text{d}y=1. & & \displaystyle\end{eqnarray}$$
For simplicity, let us assume that
 $\unicode[STIX]{x1D706}_{l}$
is small so that the plug core within the lower layer does not touch the lower wall. We then define
 $h_{1}$
as the vertical distance between the lower wall and the place where the shear stress becomes zero within the heavy layer (note that due to the slip at the lower wall, the velocity profile can be asymmetric within the lower layer). We simply integrate the above system to find the velocity field and then integrate across the heavy fluid layer to transform equation (5.5) into
 $$\begin{eqnarray}\displaystyle & & \displaystyle \frac{h_{s}^{2}{\tilde{B}_{H}}^{1/n_{H}}((\tilde{h}_{1}-\unicode[STIX]{x1D709})^{2+1/n_{H}}-(\tilde{h}_{1}-2)(2-\tilde{h}_{1}-\unicode[STIX]{x1D709})^{1+1/n_{H}})}{4\,\unicode[STIX]{x1D709}^{1/n_{H}}\left(2+\displaystyle \frac{1}{n_{H}}\right)}\nonumber\\ \displaystyle & & \displaystyle \quad +\,\frac{h_{s}^{2}{\tilde{B}_{H}}^{1/n_{H}}\left(\displaystyle \frac{1}{n_{H}}+3\right)(2-\tilde{h}_{1}-\unicode[STIX]{x1D709})^{1+1/n_{H}}}{4\,\unicode[STIX]{x1D709}^{1/n_{H}-1}\left(\displaystyle 1+\frac{1}{n_{H}}\right)\left(2+\displaystyle \frac{1}{n_{H}}\right)}-\frac{\tilde{h}_{1}\,\tilde{\unicode[STIX]{x1D706}}_{l}(\unicode[STIX]{x1D709}-\tilde{h}_{1})h_{s}\,\tilde{B}_{H}}{2\unicode[STIX]{x1D709}}=1,\end{eqnarray}$$
where
 $\tilde{B}_{H}=B_{H}/(1-B_{H})$
and
 $\tilde{\unicode[STIX]{x1D706}}_{l}=\unicode[STIX]{x1D706}_{l}(1-B_{H})$
, while
 $h_{s}$
and
 $\tilde{h}_{1}=2h_{1}/h_{s}$
are dependent parameters related through the solution of
 $$\begin{eqnarray}\displaystyle h_{s}=\,\frac{2{\tilde{B}_{H}}^{1-1/n_{H}}\tilde{\unicode[STIX]{x1D706}}_{l}\,\tilde{h}_{1}\left(\displaystyle 1+\frac{1}{n_{H}}\right)}{\unicode[STIX]{x1D709}^{1-1/n_{H}}((2-\tilde{h}_{1}+\unicode[STIX]{x1D709})^{1+1/n_{H}}-(\tilde{h}_{1}-\unicode[STIX]{x1D709})^{1+1/n_{H}})}. & & \displaystyle\end{eqnarray}$$
The above equation is obtained by considering the fact that one needs to find the same speed for the heavy layer plug when integrating the equations starting from the lower wall or from the interface (otherwise the plug would be deformable). Finally,
 $\unicode[STIX]{x1D709}$
and
 $\unicode[STIX]{x2202}P_{0}/\unicode[STIX]{x2202}X$
are related through
 $$\begin{eqnarray}\displaystyle -\frac{\unicode[STIX]{x2202}P_{0}}{\unicode[STIX]{x2202}X}=\frac{2B_{H}}{\unicode[STIX]{x1D709}h_{s}}. & & \displaystyle\end{eqnarray}$$
Our analysis shows that the root of (5.6), lying in
 $(0,1]$
, can be found numerically. In other words,
 $\unicode[STIX]{x1D709}$
can be found for a given set of parameters
 $(h_{s},\tilde{B}_{H},n_{H},\tilde{\unicode[STIX]{x1D706}}_{l})$
. Let us now suppose that
 $\unicode[STIX]{x1D712}$
is small so that the stress at the upper wall has the same sign as the interfacial stress. Considering that the interfacial stress is
 $\unicode[STIX]{x2202}P_{0}/\unicode[STIX]{x2202}X(h_{s}-h_{1})$
and the upper wall shear stress is
 $(1-h_{1})(\unicode[STIX]{x2202}P_{0}/\unicode[STIX]{x2202}X)+\unicode[STIX]{x1D712}(1-h_{s})$
, the initial static layer assumption is
 $$\begin{eqnarray}\displaystyle \left|(1-h_{1})\frac{\unicode[STIX]{x2202}P_{0}}{\unicode[STIX]{x2202}X}+\unicode[STIX]{x1D712}(1-h_{s})\right|\leqslant B_{L}. & & \displaystyle\end{eqnarray}$$
A maximal SRWL can be defined using the minimum of
 $h_{s}$
, denoted by
 $h_{s,min}$
, for which relation (5.9) holds:
 $$\begin{eqnarray}\displaystyle Y_{static}=1-h_{s,min}. & & \displaystyle\end{eqnarray}$$
Substituting the pressure gradient from (5.8) into (5.9), we reach at the condition governing the maximal SRWL:
 $$\begin{eqnarray}\displaystyle \frac{\tilde{B}_{Y}}{\unicode[STIX]{x1D709}}\left(\frac{2}{h_{s,min}}-\tilde{h}_{1}\right)-\tilde{\unicode[STIX]{x1D712}}(1-h_{s,min})=1, & & \displaystyle\end{eqnarray}$$
where
 $\tilde{B}_{Y}=B_{H}/B_{L}$
and
 $\tilde{\unicode[STIX]{x1D712}}=\unicode[STIX]{x1D712}/B_{L}$
. Therefore, only five parameters govern the solution of the maximal SRWL:
 $$\begin{eqnarray}\displaystyle \left.\begin{array}{@{}l@{}}\tilde{\unicode[STIX]{x1D706}}_{l},\\ \tilde{B}_{H},\\ \tilde{B}_{Y},\\ \tilde{\unicode[STIX]{x1D712}},\\ n_{H}.\end{array}\right\} & & \displaystyle\end{eqnarray}$$
In order to compare the results of the simplified method explained here and those of our numerical simulations, the horizontal dashed lines in figure 16(a,b) mark the maximal SRWL predictions, where good agreement is observed: in the simulations, the SRWL thicknesses at long times approach the predictions of the simplified method. In addition, as the heavy fluid slips at the lower wall (Case II), the SRWL thickness increases.
Maximal SRWL thickness,
 $Y_{static}$
, with contours spaced at intervals
 $Y_{static}=0.1$
, for
 $\tilde{\unicode[STIX]{x1D712}}=n_{H}=1$
: (a) Case I with
 $\tilde{\unicode[STIX]{x1D706}}_{l}=0$
; (b) Case II with
 $\tilde{\unicode[STIX]{x1D706}}_{l}=0.1$
. Shaded areas mark the limit where no SRWLs exist.

The critical existence condition of any SRWL is found as
 $h_{s,min}\rightarrow 1$
and it is given by
 $$\begin{eqnarray}\displaystyle \tilde{B}_{Y}=\frac{\unicode[STIX]{x1D709}|_{h_{s,min\rightarrow 1}}}{(2-\tilde{h}_{1})}. & & \displaystyle\end{eqnarray}$$
Figure 17 shows the variation of the maximum SRWL versus
 $\tilde{B}_{H}$
and
 $\tilde{B}_{Y}$
, for Cases I and II, at fixed values of
 $\tilde{\unicode[STIX]{x1D712}}$
and
 $n_{H}$
. The shaded area marks the region where no SRWL is found. It can be seen that, at large
 $\tilde{B}_{H}$
, slip at the lower wall (Case II) has two effects: reducing the region where no SRWL is possible and changing the spacing between the contours of the maximal SRWL thickness.
Maximal SRWL thickness,
 $Y_{static}$
, with contours spaced at intervals
 $Y_{static}=0.1$
, for
 $n_{H}=1$
: (a) Case III with
 $\tilde{\unicode[STIX]{x1D706}}_{l}=0$
; (b) Case IV with
 $\tilde{\unicode[STIX]{x1D706}}_{l}=0.1$
. For a given set of
 $h_{s}$
and
 $\tilde{B}_{H}$
, the corresponding values of
 $\tilde{\unicode[STIX]{x1D712}}$
can be calculated using equation (5.14). Shaded areas mark the limit where no SRWLs exist.

5.1.2 Static wall layers for Cases III and IV
Regarding Cases III and IV, SRWLs appear only if the stress at the upper wall is exactly zero and the interfacial stress is smaller than the light fluid’s yield stress. This means that the following relations need to be simultaneously satisfied to deliver the maximal SRWL thickness:
 $$\begin{eqnarray}\displaystyle \left.\begin{array}{@{}l@{}}\displaystyle \tilde{\unicode[STIX]{x1D712}}=\frac{2-h_{s,min}\tilde{h}_{1}}{h_{s,min}(2-\tilde{h}_{1})(1-h_{s,min})},\\ \displaystyle \tilde{B}_{Y}=\frac{\unicode[STIX]{x1D709}}{2-\tilde{h}_{1}}.\end{array}\right\} & & \displaystyle\end{eqnarray}$$
For a given parameter set, there exists a critical value for
 $\tilde{\unicode[STIX]{x1D712}}$
for which the displaced layer is fully static. Figure 18 plots the variation of the maximum SRWL in the plane of
 $\tilde{B}_{H}$
and
 $\tilde{B}_{Y}$
, for Cases III and IV, at a fixed value of
 $n_{H}$
. Note that, for a given set of
 $h_{s}$
and
 $\tilde{B}_{H}$
, the corresponding values of
 $\tilde{\unicode[STIX]{x1D712}}$
need be calculated using equation (5.14). For example, in this figure for
 $h_{s}=0.5$
and
 $\tilde{B}_{H}=6$
, the critical values of
 $\tilde{\unicode[STIX]{x1D712}}$
for Cases III and IV are equal to 6 and 5.3, respectively. This suggests the parameter ranges for which a SRWL is observed is sensitive to the variations of the Bingham numbers and the buoyancy number. Finally, compared to Case III, slip at both walls (Case IV) results in a further shrinkage of the region where no SRWL is possible.
6 Discussion and conclusions
We have considered a buoyant displacement flow in a 2-D channel with wall slip boundary conditions and accordingly developed a two-layer lubrication/thin film model in combination with a generalized Newtonian rheology. We have focused on the limit where surface tension or mixing can be neglected (
 $Pe\rightarrow \infty$
and
 $Ca\rightarrow \infty$
). We have aimed at quantifying displacement flow behaviours when the common no-slip condition at the channel walls is replaced with a simple Navier slip condition, relating the wall slip velocity to the wall shear stress. Although the model is general, in order to alleviate the analysis, we have presented the results only for four wall slip cases: Case I (no-slip), Case II (slip at the lower wall), Case III (slip at the upper wall) and Case IV (slip at both walls), all with fixed slip coefficients. Below, we will summarize our main findings.
For Newtonian fluids, a large number of results are presented. First, general displacement behaviours are reviewed, by examining the interface evolution (with time) and the velocity field. The results highlight that slip at either wall significantly changes the overall displacement. Most efficient displacements are usually found when the fluids slip at the upper wall only. In addition, through a simple analysis, the heights and the speeds of the leading and trailing fronts are evaluated versus the viscosity ratio and a buoyancy number, for the four slip cases, where non-monotonic behaviours are sometimes observed as these parameters vary. A critical flow state, i.e. the stationary interface flow, is also quantified for displacements with wall slip, furnishing a critical buoyancy number and a critical interface height. Moreover, analysing the frontal region reveals that a channel with a no-slip condition has the shortest characteristic spreading length at the front (
 $\unicode[STIX]{x1D701}_{L}$
), while a channel with wall slip at both walls has the largest
 $\unicode[STIX]{x1D701}_{L}$
. For most of the parameter ranges, slip at the lower wall (Case II) extends the frontal region further, compared to the case with slip at the upper wall only (Case III). The interface evolution at short times is characterized by an exchange flow, which can be analysed through a similarity solution, revealing that wall slip causes the interpenetrating fronts to advance relatively faster. Transition between the short and long time displacements can be analysed through a simplified model with propagating fronts, suggesting that the leading and trailing front velocities approach their long time asymptotes at
 $T\sim O(10^{-1})$
and that the fronts feel the effects of wall slip in both short and long times. Finally, when buoyancy is weak, the trailing front at longer times is pinned to the upper wall in Cases I and II, but it is not pinned in the other slip cases.
Concerning non-Newtonian fluid flows, since the number of the dimensionless groups is large, a parametric study of all the dimensionless group ranges is not feasible. Instead, in order enable a comparison among a large number of simulation results, an ad hoc displacement efficiency parameter is defined. The results show that, for all the slip cases, most (least) efficient displacements are typically found at small (large) viscosity ratios, which may be expected. However, the effects of the Bingham numbers are peculiar in that there are no definitive trends in the variation of
 $\boldsymbol{E}$
as the Bingham numbers vary in slip cases. Especially for Case IV, the variation of
 $\boldsymbol{E}$
versus
 $B_{H}$
and
 $B_{L}$
becomes non-monotonic, which underlines the fact the prediction of the flow behaviours becomes harder as the fluids slip at both walls. Moreover, when the displaced fluid possesses a yield stress, it is possible for there to exist a static residual wall layer (SRWL), which is a prominent displacement flow feature for non-Newtonian displacements. The simulation results reveal that slip at the upper wall results in a removal of SRWLs, which could be of significant thickness in the case of no slip at the upper wall. Therefore, the analysis is directed towards a simple 1-D model to predict maximal SRWL thicknesses for Cases I–IV. Depending on the values and the ranges of the dimensionless groups, various conditions regarding the SRWL thickness may occur. These can be effectively summarized in the planes with a modified yield stress and a yield stress ratio as parameters. The SRWL thickness can be quantified when the rheology of the displacing phase, the yield stress of the displaced phase, the buoyancy number and the lower wall slip coefficient are specified.
In this work, we concentrated on a simple yet practical wall slip law, i.e. a Navier slip law, relating the wall slip velocity to the shear stress at the wall. However, our model formulation should make it possible to equally consider other useful slip models, especially those relevant to non-Newtonian fluids. These may include but are not limited to the nonlinear Navier slip law (Schowalter Reference Schowalter1988), the Hatzikiriakos slip law (Hatzikiriakos Reference Hatzikiriakos2012), the asymptotic slip law (Ferrás et al. Reference Ferrás, Nóbrega and Pinho2012), etc.
Finally, it is instructive to discuss how our model and its results could be validated with experiments. Although displacement experiments are generally straightforward to conduct, here there may be a challenge to induce well-controlled wall slip in laboratory-scale experiments. There exist experimental techniques to characterize/control the occurrence of wall slip (e.g. Lauga & Stone Reference Lauga and Stone2003; Nickerson & Kornfield Reference Nickerson and Kornfield2005; Vayssade et al. Reference Vayssade, Lee, Terriac, Monti, Cloitre and Tabeling2014), but these have mainly focused on slip heterogeneities in small systems, where buoyancy is naturally ignored due to the small characteristic flow size. Alternatively, buoyant displacement flow experiments with wall slip may be carried out using indirect approaches, such as employing a highly thin layer of a low viscosity fluid to lubricate the flow geometry walls. In this case, the wall slip velocity results from a macroscale description of the boundary condition at the layer. In fact, we have performed in our laboratory very preliminary displacement experiments in a horizontal square duct with walls made ‘slippery’ using such a method. The results show qualitative agreement with model observations, in particular, in terms of the wall slip effects leading to increase the displacement efficiency.
In future, the work presented can be extended to include miscibility or surface tension as parameters. The displacement flow stability can be also analysed to understand the effects of wall slip on the general stability picture.
Acknowledgements
This research has been carried out at Université Laval, supported financially by the Discovery Grant of the Natural Sciences and Engineering Research Council of Canada (NSERC) and the John R. Evans Leaders Fund of the Canada Foundation for Innovation (CFI). We also thank A. Eslami and R. Mollaabbasi for their constructive comments.
Appendix A. Coefficients in the flux function
The coefficients in the flux function equation (3.23) are
 $$\begin{eqnarray}\displaystyle & \displaystyle \left.\begin{array}{@{}l@{}}a_{11}=36\,h\,m^{2},\\ a_{10}=-6\,h\,m((3-2\,m)h^{2}-3),\\ a_{01}=-6\,h^{2}m^{2}(h-3),\\ a_{00}=-h(3m(1-\,m)h^{3}+6\,h^{2}m-9\,hm).\end{array}\right\} & \displaystyle\end{eqnarray}$$
 $$\begin{eqnarray}\displaystyle & \displaystyle \left.\begin{array}{@{}l@{}}b_{11}=-12m(1-m)h^{5}+12m(3-2\,m)h^{4}-12m(3-\,m)h^{3}+12\,h^{2}m,\\ b_{10}=(3-4\,m)h^{6}-12(1-m)h^{5}+6(3-2\,m)h^{4}-4(3-\,m)h^{3}+3h^{2},\\ b_{01}=-m(4-3\,m)h^{6}+6m(2-m)h^{5}-3m(4-\,m)h^{4}+4\,h^{3}m,\\ b_{00}=(1-m)h^{7}-(4-3\,m)h^{6}+(6-3\,m)h^{5}-(4-m)h^{4}+h^{3}.\end{array}\right\} & \displaystyle\end{eqnarray}$$
 $$\begin{eqnarray}\displaystyle & \displaystyle \left.\begin{array}{@{}l@{}}c_{11}=36\,m^{2},\\ c_{10}=12m((m-1)h^{3}+1),\\ c_{01}=12\,m((m-1)h^{3}-3(\,m-1)h^{2}+3(m-1)h+1),\\ c_{00}=3+3(m-1)((m-1)h^{4}+4h^{3}-6h^{2}+4h).\end{array}\right\} & \displaystyle\end{eqnarray}$$
Appendix B. Coefficients in the velocity functions
Here, we provide the coefficients concerning the velocity profile equations (3.27) and (3.28). For the heavy fluid, we have
 $$\begin{eqnarray}\displaystyle & \displaystyle \left.\begin{array}{@{}l@{}}d_{H,11}=12\,m^{2},\\ d_{H,10}=6m(1-my^{2}+(m-1)h^{2}),\\ d_{H,01}=6m^{2}y(2-y),\\ d_{H,00}=6m[((1-m)h-1)y^{2}+(1+(m-1)h^{2})y].\end{array}\right\} & \displaystyle\end{eqnarray}$$
 $$\begin{eqnarray}\displaystyle & \displaystyle \left.\begin{array}{@{}l@{}}e_{H,11}=2m(1-h)[2(1-m)h^{3}+(3m-4)h^{2}+2\,h-3\,y^{2}m],\\ e_{H,10}=(1-h)[m(h^{2}+h-2)y^{2}+(m-1)h^{4}+3(1-m)h^{3}+(2\,m-3)h^{2}+h],\\ e_{H,01}=(1-h)m[(3\,m-2)h^{2}+2\,(2-3\,m)h-2]y^{2}\\ +\,2(1-h)m[2(1-m)h^{3}+(3\,m-4)h^{2}+2\,h]y,\\ \displaystyle e_{H,00}=\frac{(1-h)}{2}[(1-m)h^{3}+(5\,m-3)h^{2}+(3-4\,m)h-1]y^{2}\\ \displaystyle +\,(1-h)[(m-1)h^{4}+3(1-m)h^{3}+(2\,m-3)h^{2}+h]y.\end{array}\right\} & \displaystyle\end{eqnarray}$$
 $$\begin{eqnarray}\displaystyle & \displaystyle \left.\begin{array}{@{}l@{}}f_{H,11}=12\,m^{2},\\ f_{H,10}=4m((m-1)h^{3}+1),\\ f_{H,01}=4m((m-1)(h-1)^{3}+m),\\ f_{H,00}=h(m-1)((m-1)h^{3}+4h^{2}-6h+4)+1,\end{array}\right\} & \displaystyle\end{eqnarray}$$
For the light fluid, we have
 $$\begin{eqnarray}\displaystyle & \displaystyle \left.\begin{array}{@{}l@{}}d_{L,11}=12\,m^{2},\\ d_{L,10}=6m(1-y^{2}),\\ d_{L,01}=6m((1-m)h^{2}-y^{2}+2\,y+2(m-1)h),\\ d_{L,00}=6[((1-m)h-1)y^{2}+(1+(m-1)h^{2})y+(1-m)h^{2}+(m-1)h].\end{array}\right\} & \displaystyle\end{eqnarray}$$
 $$\begin{eqnarray}\displaystyle & \displaystyle \left.\begin{array}{@{}l@{}}e_{L,11}=2mh(3y^{2}-6\,y+2+(2m-2)h^{3}+(3-2\,m)h^{2}),\\ e_{L,10}=h[((2\,m-3)h^{2}+3)y^{2}+4((1-m)h^{3}-1)(y-1)-3+(3-2\,m)h^{2}],\\ e_{L,01}=hm[(3h-h^{2})y^{2}+(2\,h^{2}-6\,h)y+(m-1)h^{4}+(1-m)h^{3}+2\,h],\\ \displaystyle e_{L,00}=\frac{h}{2}[((m-1)h^{3}-2h^{2}+3h)y^{2}+2((1-m)h^{4}+h^{2}-2\,h)y]\\ \displaystyle +\,\frac{h}{2}[2(m-1)h^{4}+(1-m)h^{3}+h].\end{array}\right\} & \displaystyle\end{eqnarray}$$
 $$\begin{eqnarray}\displaystyle & \displaystyle \left.\begin{array}{@{}l@{}}f_{L,11}=f_{H,11},\\ f_{L,10}=f_{H,10},\\ f_{L,01}=f_{H,01},\\ f_{L,00}=f_{H,00}.\end{array}\right\} & \displaystyle\end{eqnarray}$$



