In recent years there has been a renewed interest in the role of local campaigns and their effectiveness in increasing turnout and support for parties. However, there has been some disagreement between scholars over how best to measure campaign activity. Notably, Johnston and Pattie have advocated the use of campaign spending data. These have advantages of completeness of coverage and relatively little measurement error.Footnote 1 Denver and his colleagues have advocated the use of survey data that asks constituency party agents directly about the campaigns in their constituencies.Footnote 2 This is a more refined and specific instrument for the measurement of campaign intensity but is subject to survey non-response and measurement error. Seyd and Whiteley and later Whiteley and his colleagues advocated the use of constituency party membership figures and an activism index of party members obtained through a nationwide postal survey as indirect measures of constituency campaign intensity.Footnote 3 A fourth approach uses individual voter surveys such as the British Election Study (BES), which provides a direct link between exposure to the campaign and voter choice.Footnote 4
In this article, we advance the current literature on campaigning by demonstrating the potential for drawing on a variety of different data sources including administrative and survey data, and applying this to a model of local campaigning in Britain. We utilize evidence from a survey of agents carried out in 2005, official records of campaign spending and individual voter survey data to produce a combined measure of campaign intensity which we believe minimizes the problems of existing approaches and circumvents the debates about which is the best measure. We then use this combined measure of campaign effort in a structural equation model of party performance at the 2005 general election. We examine both the direct effect of campaign effort on party performance and the indirect effects of party activism through prior strength and fielding an incumbent candidate. Our findings indicate that, in terms of both the delivery and effectiveness of local campaigns, parties behave in a way consistent with a rational model of party behaviour, though constrained by contextual factors. Specifically, and contrary to evidence from previous elections, the Conservatives in 2005 were both rational and effective in their local campaigns, particularly in undermining support for their opponents. Labour ran the least effective local campaigns, whilst the Liberal Democrats’ effort was the most effective of the three major parties in increasing its own vote.
The changing character of campaigning
Two schools of thought have emerged about the importance of election campaigns. One argument is that most electors have little interest in politics generally, or in campaigns. They see little choice between party policies and regard politicians as untrustworthy.Footnote 5 Others have stressed that campaigns do matter. Not only do they boost political knowledge and strengthen party identification, they have been shown to enhance political participation, the cornerstone of any democracy.Footnote 6
Since the late 1950s, the traditional scholarly view has emphasized the importance of the national campaign. Constituency campaigns in British general elections were perceived as irrelevant and non-productive rituals performed by party activists. Since 1992, a new orthodoxy has emerged. Using different methodologies, at least three groups of British scholars have consistently shown that the more organized and intense a party’s campaign, the greater the electoral payoff.Footnote 7 Labelled originally as ‘revisionist’, this research has been complemented by local grassroots studies and has now become the ‘accepted wisdom’.Footnote 8 Scholars using individual-level survey data (such as in the British Election Studies 2001) have reaffirmed these findings.Footnote 9
However, during this period we have also seen rapid changes in the organization and conduct of local campaigns. As parties have become more professional at the national level, party organizers have also increasingly begun to focus on managing and influencing local campaigns. Central to this has been a renewed emphasis on targeting where parties focus effort and resources in key battleground seats and, recently, on individual voters. Part of the trend has been the integration and application of national campaign messages in target areas to suit the local audience (such as through direct mail, billboard advertising and centrally organized telephone banks). Former revisionists now stress the importance of nationally co-ordinated local campaigning as opposed to the more traditional locally run campaigns.Footnote 10 These trends mirrored developments which had taken place rather earlier in the United States as a response to the increasing fragmentation of the media.Footnote 11
While the objective of constituency campaigns has largely remained the same, to mobilize as many party supporters as possible on polling day, technological advances (use of telephones, computers and party software to target and mobilize key voters) have meant that mobilization techniques have changed. In both Britain and the United States, declining party membership and activism has meant that parties are becoming ever more reliant on telephone and other impersonal techniques, as opposed to doorstep canvassing to mobilize supporters on polling day. Many American scholars have berated the dominance of impersonal campaign techniques, arguing that it contributes to lower turnout. Randomized field experiments have shown face-to-face (traditional) methods to be more effective in ‘getting out the vote’ than impersonal mobilization methods.Footnote 12 Nevertheless, it is now widely recognized that parties in all advanced democracies are increasingly complementing traditional campaigning, with modern methods.
Competing measures of campaign activity
Because campaigns are multifaceted, operating both locally and nationally, and varying in intensity from one area to another, there is no single direct measure of campaign effort. Rather campaign effort is usually measured using one or more proxy indicators of such effort. One way of capturing the effectiveness of campaigns is to use individual-level voter survey data.Footnote 13 Whilst such data can clearly provide a direct link between campaign exposure and voter behaviour, they do rely on respondents making accurate and conscious recollections of such exposure. If this assumption is not met and voters are affected by campaigns without attributing that as such, then the impact of campaigns may be underestimated. Furthermore, if campaigns have an impact on only a small number of voters in selected areas, national survey methods are unlikely to be able to detect the impact, because the sample size is too small. Alternative and complementary evidence has often been provided by aggregate (geographical) data, which are particularly useful for examining the marginal impact of local campaigns on vote share. However, there has been considerable disagreement about how to measure campaign strength at the aggregate level. Two competing methods have been at the forefront of this debate: reported party campaign expenditure in each constituency, which is subject to legal constraints, and a campaign intensity indicator derived from postal surveys of electoral agents.Footnote 14 However, aggregate analysis is potentially subject to ecological fallacies and analysts using aggregate data need to be aware of confounding effects as well as the issue of endogeneity (that parties may campaign where they think they may perform well or have done so in the past).Footnote 15
Party spending data have been widely used as an indirect or surrogate measure of campaign strength. Studies of the relative amount spent (spending patterns are analysed in terms of the percentage of the maximum permitted) by parties during the election campaign have consistently reflected campaign activism. Most parties raise and spend more on average where they are likely to mount intensive campaigns. This tends to be in the most marginal seats which they hold or where they are the closest challengers. Most spending goes on printing; the more intense and active a local campaign, the more material is printed.Footnote 16 It has also been consistently demonstrated that the amount a party spends is significantly related to its electoral performance – the more a party spends relative to its opponents, particularly if it is the challenger, the more favourable the outcome.Footnote 17 These findings are consistent with North American studies which repeatedly show that incumbent campaign spending fails to increase incumbent vote share, while challenger campaign spending is far more effective.Footnote 18
Even critics concede that spending data are not only easily available but have proven validity when measured against alternative measures of campaign intensity.Footnote 19 For example, spending and self-reported activism have been shown to be highly inter-correlated.Footnote 20 Despite this, critics maintain that the many important aspects of constituency campaigning are voluntary and freeFootnote 21 and that parties often ‘bend the rules’ so that they can report expenditure below the maximum allowed. As campaigns have become more centralized and modernized, the limitations of party spending data have become more exposed. The increasing use of direct mail and telephone canvassing (by party workers from their own homes or, more likely, by organized banks of workers outside the constituency) are two examples of sources of expenditure not captured by the constituency spending data. Also party spending data represent the expenses incurred by candidates during the ‘official’ election period when maximum spending limits apply. As campaigns have become more sophisticated, the amount of campaigning prior to the ‘official’ campaign has substantially increased. There has been an undoubted increase in pre-election activity, key voters in battleground seats are now actively targeted during a ‘long campaign’, sometimes in excess of a year before the general election. Where resources allow, there has also been some evidence of continuous campaigning from one election to another.Footnote 22 These developments have meant that party spending, despite its usefulness, has become an increasingly rough approximation of campaign activity.
Since the 1992 general election, a direct measure of a party’s constituency campaigning in Britain has been available from nationwide surveys of electoral agents.Footnote 23 Early work used seven indices of campaign activities to construct a single measure of campaign strength. After controlling for underlying patterns of party support, evidence of a strong relationship between campaign strength and electoral performance was found, although this varied between parties.Footnote 24 Later work has adapted to reflect the changing organization and operation of campaigns. Campaign activity has been redefined and indexes have been developed to measure traditional campaigning (doorstep canvassing, public meetings, leaflets delivered and manual activity on polling day) and modernization (use of computers, telephone canvassing, party software and direct mail).Footnote 25 The information obtained from surveys of electoral agents has enabled scholars to trace significant developments in the conduct of campaigns.
However, this approach is not without its drawbacks. First, there is measurement error. Like any survey, the method relies on electoral agents being both accurate and honest in their responses. Critics have been sceptical about the reliability of election agents, emphasizing their ‘incentive to exaggerate the amount of activity going on in their areas … as part of an overwhelming desire to secure their own jobs’.Footnote 26 The survey requires respondents to detail activity that took place during the ‘official’ election period, although in more recent elections there have been questions about the pre-election campaign. Given the intensity of any campaigns during the ‘official’ election period, it is probable that electoral agents would struggle to recall information that took place before it. Like party spending data, the survey of electoral agents takes little account of party activism beyond the pre-campaign period, over the medium term. Secondly, there is the problem of non-response. A substantial proportion of agents simply do not return the questionnaire. Response rates peaked at just under 70 per cent in 1997 and 2001: however this fell to 33.5 per cent in 2005. Also response rates vary between parties with Conservative electoral agents responding in fewer numbers in 2001 and 2005 than their Labour and Liberal Democrat counterparts. Response rates are often lower in hopeless seats as there are few professional party agents and little organization. Given the existence of measurement error and non-response, it is clear that the campaign strength measure (campaign index), just like party spending data, can only be an approximation of campaign effort.
Campaign effectiveness
There is considerable evidence from the United States that spending money does boost the electoral fortunes of candidates, particularly challengers,Footnote 27 although a detrimental side effect of large rises in campaign spending has been the increasingly negative tone of US campaigns which may have contributed to lower levels of participation.Footnote 28 In Britain, both party spending data and the campaign strength measure (campaign index) have been used to examine the efficacy of campaigning at the constituency level. Both methods have yielded similar conclusions; local campaigning matters but efficiency varies between parties. It has also become apparent that campaign effects differ according to the context of the election.
Of the two main parties, both constituency level methods have consistently found Labour to be more effective at targeting efforts in winnable seats or close contests. At the 1997 general election, Labour was more efficient in their expenditure patterns, spending more in marginal seats and relatively small amounts where it was lying in third place or worse.Footnote 29 In 2001, Labour ran a more defensive campaign, concentrating most of its efforts where it had won seats in 1997.Footnote 30 Labour was more defensive in 2005 and preliminary evidence suggests that Labour activism was less intensive and effective than it had been four years earlier.Footnote 31 Despite consistently running the strongest constituency campaigns, the Conservatives have often concentrated their efforts in their safest seats. However, by 2001, there was some evidence that Conservative campaigning was becoming more intensive in their target seats.Footnote 32 The Liberal Democrats have consistently run the least intense campaigns, though their campaign spending tends to be concentrated in constituencies where their candidate is the incumbent or a close challenger.Footnote 33 In 2001, they mounted the most intensive campaigns of all the parties in their target seats.Footnote 34
Researchers using individual-level data from the 2001 BES have largely corroborated these constituency-level findings.Footnote 35 Multiple exposures to party campaigning had a significant effect on party choice in 2001. Direct local campaign effects were weaker for the Conservatives than Labour, while exposure to mobilization activities benefited the Liberal Democrats and increased the likelihood of tactical voting.
Combining data, sharing strength: an alternative approach to assessing campaign effectiveness
As we have shown, there is not one suitable direct measure of campaign effort. We suggested above that whilst individual survey data has the advantage of directly linking campaign exposure and voter behaviour, on its own, voter-level survey data only taps into the behaviour of a relatively small sample of individuals and assumes that voters accurately assess their exposure to the campaign whilst ignoring measurement error. Aggregate (constituency-based) measures of campaign activity also have an important role to play but there is no clear consensus on how to measure local campaign activity, and different indicators have various shortcomings. Essentially, we argue that ‘true’ campaign effort is unobservable since so many facets of the campaign are either unrecorded or are not captured by a single convenient data source. In effect, all the commonly used measures (spending, survey instruments etc.) are indicators of campaign effort, rather than a direct and error-free measure. Thus what we advocate, and attempt to do here, is to combine as many as possible sources of information about the local campaign effort to produce an estimate of the underlying (or latent) unobserved variable, campaign effort. This is facilitated by the fact that the alternative measures do tend to be correlated with each other (see below).Footnote 36 We then use that variable in a more general model of party performance in the 2005 general election.
Our underlying theoretical model is based on the assumption that parties behave in a rational manner, concentrating campaign effort where it makes sense (mobilizing supporters in close contests) and only if it is effective in improving vote share and/or undermining that of competitor parties. However, rational parties are constrained by forces of inertia. That is, they might be expected to work harder where they have done well in the past or campaign more intensely where they have more party workers. Moreover, parties are restricted by legal constraints on how much they spend. Equally, other campaign resources (as well as money) may be relatively geographically immobile (for example, local party workers may be unwilling to travel to other more marginal constituencies). Therefore, party campaigns are not wholly dictated by rational considerations but are constrained by forces of inertia. We take this into account in our modelling design by incorporating variables such as prior strength and incumbent candidates.
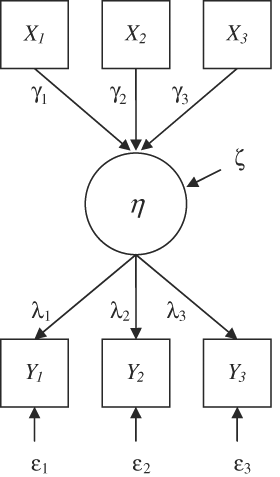
The modelling approach we use in this article falls into the broad category of latent variable modelling, whereby it is assumed that there is an unobserved variable (in our case campaign effort) and that this can be estimated from a number of observed variables. More specifically we adopt a multiple indicator, multiple cause or MIMIC model, which is derived from Item Response Theory.Footnote 37 MIMIC models are a variety of structural equation model where the latent variable that is considered to be the cause of the relationships among a set of indicator variables (such as campaign spending, campaign effort), that is itself caused by other, exogenous, variables (such as share of the electorate at a prior election, target seat status).Footnote 38Figure 1 shows the general MIMIC model structure: the unobserved, latent variable is represented by a circle (η) and the observed variables by boxes; the Ys are the indicators of the latent variable and the Xs are its exogenous causes; the arrows in Figure 1 represent the strength and direction of the causal relationships between observed and latent variables, γ for the causes (X) and λ for the indicators (Y).Footnote 39 Indicator variables are subject to measurement error (indicated by ε). Random or unmeasured effects on the latent variable are captured by ζ.
Basic structure of the Multiple Indicator Multiple Cause model (MIMIC)

Our hypotheses are:
HYPOTHESIS 1 A single latent variable captures the ‘campaign effort’ and explains a high proportion of the variance in each of the indicator variables (campaign spending, the traditional and modern campaigns of each of the major parties, and voters’ subjective exposure to local campaigns).
HYPOTHESIS 2 Parties will campaign where it is likely to make a difference (e.g. in marginal seats) but will also be constrained by inertia (e.g. previous performance).
HYPOTHESIS 3 Controlling for previous share of the electorate and other relevant variables, the campaign of each party will be associated with a larger share of the electorate for that party.
HYPOTHESIS 4 Controlling for previous share of the electorate and other relevant variables, the campaign of competitor parties will be associated with a smaller share of the electorate for each party.
The data
The campaign data are derived from a number of sources. We use the nationwide postal survey of electoral agents in the 2005 general election as one source of information.Footnote 40 The postal survey asks electoral agents to provide details of their party’s activism in their constituency. As noted earlier, the overall response rate in 2005 was just over a third.Footnote 41 To reflect the changing character and conduct of party campaigns, other scholars have created two campaign indexes to measure traditionalism and modernization.Footnote 42 We use the traditional campaign index and the updated modernization index relating to the use of direct mail, telephone knock-up and telephone canvassing. Campaign spending data is publicly available for all constituencies, and other constituency data was obtained from the British Parliamentary Constituency database 2005, except for demographic data which was taken from the 2001 Census. For individual voter data we use the 2005 BES and aggregate the individual data on exposure to party broadcasts, telephone canvassing, door to door canvassing and party knock-up to the constituency level. The BES provides data for 127 constituencies. Whilst two of these sources of data have significant missing information, by employing a combination of sources we can strengthen the validity of the latent measure of campaign effort. Indeed, the modelling framework adopted is designed explicitly to deal with missingness (see below). We use party share of the electorate as the dependent variable in our models. This is preferred to share of votes cast because parties are assumed to attempt to maximize their share of the electorate, by mobilizing existing supporters, previous abstainers, new voters and those individuals who have recently moved to the constituency. Moreover, it takes into account voter participation, given that the share of the electorate is calculated as all those who voted divided by all those who are eligible to vote, not only those who voted.
Campaign intensity measures, party campaign spending and voter exposure
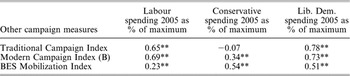
Before we examine the impact of the parties’ local campaigns on party performance in 2005, we assess the extent to which the alternative indicators are correlated with each other. If these variables are good indicators of the underlying variable, campaign effort, then we would expect them to be highly correlated. This is confirmed in Table 1 which gives the correlations between spending (available for all constituencies) and the other measures. All the correlations for Labour and Liberal Democrats are strong, positive and significant whilst only the modernization index and the BES mobilization index are significant for the Conservatives. This may partly result from the low response rates from the Conservatives in the agent survey, but may also indicate that where the Conservatives are spending more, they are spending their money on a modern campaign. In safer Conservative areas, they are likely to spend less, but to conduct a relatively strong traditional campaign mainly carried out on a voluntary basis.
Correlations between Party Spending in 2005 and Other Campaign Measures in 2005

**Correlation is significant at the 0.01 level (two-tailed).
N = 334 for Labour Campaign Measures; N = 68 for Conservative campaign measures; N = 212 for Liberal Democrats’ campaign measures.
The effectiveness of the campaigns
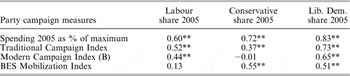
The correlations provide prima facie evidence that these measures might be considered indicators of a common underlying construct, ‘campaign effort’. However, before we seek to formalize that relationship we must ask ourselves whether these indicators, in their own right, have any relationship with the outcomes we anticipate? In other words, are these indicators, on their own, good predictors of party performance? We examine this question first by looking at the correlation between the indicators and each party’s share of the electorate (see Table 2).
Correlations between Share of the Electorate and Campaign Effort

Note: Maximum N = 334 for Labour campaign measures, maximum N=68 for Conservative campaign measures, N = 212 for Liberal Democrats’ campaign measures.
**Correlation is significant at the 0.01 level (two-tailed).
As anticipated, Table 2 does show that each major party’s share of the electorate is positively and significantly correlated with some or all of the indicators of campaign effort. For Labour and the Liberal Democrats all coefficients are positive and significant (with the exception of the Labour BES mobilization index), with the stronger relationship for the Liberal Democrats, suggesting the latter may have been most effective at targeting their efforts. Again, evidence for the Conservatives is mixed, with no significant effects found for the modern campaign. However, drawing any firm conclusions from these relationships is problematic due to potential problems of endogeneity: rather than parties performing better where they campaign, they may campaign harder where they are stronger and have more resources on the ground.
Similarly, if one examines the bivariate relationship between the campaign and change in vote share, the results may be misleading since they fail to account for other factors which may affect vote share (for example, the previous share of the electorate). Thus, in 2005 Labour’s vote fell where it campaigned harder, not because the campaign lost voters, but because for a variety of other reasons, Labour struggled to maintain their vote where they had previously performed best. Thus, although these campaigns may have been effective at stemming the loss of Labour’s vote share, the failure to take pre-existing conditions and other variables into account obscures the picture. Fortunately, statisticians have developed techniques for overcoming precisely these problems. In the following section we attempt to quantify the effectiveness of campaign effort using a structural equation modelling approach, taking into account all the relevant information in a systematic modelling framework.
Mimic models of campaign effort and party performance in 2005
The theoretical rationale and general form of the MIMIC model was described above. In relation to our specific research questions, the latent variable represents campaign effort, and the indicators of campaign effort are campaign spending, the modern campaign index, traditional campaign index and the BES mobilization index. The model can be written:

where

Yij is the i-th indicator of the j-th latent variable η j, with corresponding loading λij and unique factors εij (i.e. unshared variance and error). There were three latent variables (i.e. j=1, 2, 3), representing Conservative, Labour and Liberal Democrat campaign effort, respectively. In addition, the latent variables η j represent the effects of the regressions γij on the exogenous causes Xij, as well as the variance ζj not accounted for by Xij. Here it is assumed that error terms (εij and ζj) have a mean of 0. All continuous variables were mean-centred.
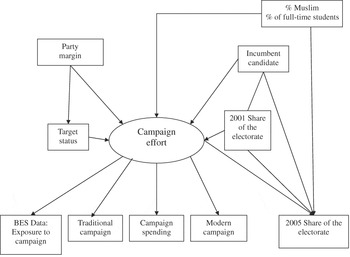
Figure 2 shows a path diagram of the model for one party with the unobserved variables excluded. By including direct effects of covariates on share of the electorate, the model is an extension of the MIMIC model described above and can be more generally described as a structural equation model.Footnote 43 The key variable for capturing the impact of continuity in party popularity and inertia in campaign targeting is the previous share of the electorate, though this is also reflected in the model by candidate incumbency (which may influence both the campaign and the eventual votes received). The model allows us to decompose the direct and indirect effects of these variables on 2005 party share of the electorate. Thus, previous share of the electorate is allowed to condition both campaign effort and vote share directly, and has an indirect effect on the latter via the former. Since we are also interested in the variables with indirect paths, we report both the indirect effects for these variables, along with the direct effects.Footnote 44 This means that part of the effect of previous share of the electorate may be transmitted via campaign effort. However, the effect of campaign effort on 2005 share is net of the direct effect of previous share and may genuinely be considered a campaign effect, albeit partly determined (itself) by the previous share of the electorate. We also include previous level of marginality, as a direct predictor of target status as well as campaign effort, in recognition of the fact that parties select their target seats partially on the basis of marginality. Marginality is defined as the percentage vote share behind the winning party (Winner %−Party X %), except for the first-placed party, where it is the distance ahead of the second-placed party (Party X %−Runner Up %). This takes account of the possibility that parties have less incentive to campaign where they are either hopelessly behind the leading party or where they are relatively safe in their lead.
Path diagram of structural equation model

We also use target status (a binary variable) as a predictor of campaign effort.Footnote 45 Common sense would dictate that parties campaign harder in target seats. This has been confirmed in previous research which has demonstrated higher levels of campaign intensity and higher levels of campaign spending in target seats.Footnote 46 We confirm these findings with the 2005 election data for each of the three major parties. For instance, all three parties do indeed spend a higher percentage of the legal maximum in target seats. Also, consistent with correlations shown in Table 1, both Labour and the Liberal Democrats’ traditional and modern campaigns are more intense in target seats.Footnote 47 The pattern is similar for the Conservative modernized campaign, although this is not true of the traditional campaign. In so far as indicators of campaign effort are higher in target seats, this would suggest that target status may be an important predictor of campaign effort, but should not properly be considered an indicator of the latent variable since campaign effort is assumed to result from a seat being identified as a target rather than the reverse.
The inclusion of predictors that take account of the socio-economic profile of the constituencies along with previous share of the electorate would inject an unacceptable amount of multicollinearity into the model. For this reason and model parsimony we excluded socio-economic factors, and use previous share of the electorate in 2001 to represent socio-economic continuity across areas. However, we include two demographic variables which have previously been shown to be important at the 2005 general election, the percentage of Muslims and the percentage of students in the area.Footnote 48 These variables do not violate established collinearity criteria.
In addition to the model structure shown in Equations 1 and 2 and Figure 2, two covariance matrices were specified. First, the latent variables ηj were allowed to correlate freely, representing the non-independence of campaign effort across party (i.e. parties may consider the likely campaigning of the others when allocating resources). The second covariance matrix allowed the residual variances for the share of the electorates to correlate, as these shares are not independent across parties (as one party’s vote goes down, that of the others will tend to increase). The model also allowed all exogenous predictors to covary freely, though in Figure 2, for illustrative purposes, we only show those we expect to be important.Footnote 49
One key aspect of the model is that there is a considerable amount of missing data from both the agents’ and voter surveys whilst spending data and other covariates are available for all constituencies. One of the major benefits of adopting this modelling approach is the ability to accommodate missing data. First, including information from a variety of sources compensates for missing data in any one source. Secondly, the Mplus software explicitly handles missing data through the estimation-mobilization (EM) algorithm to compute missing data estimates using full information maximum likelihood (FIML).Footnote 50 The FIML method uses all available data points in the dataset to construct the best first and second order moment estimates under the missing at random (MAR) assumption.Footnote 51 This missing data estimation method is widely regarded among missing data analysts as being preferable to other missing data approaches (listwise deletion, pairwise deletion and mean substitution) and has been shown to produce unbiased parameter estimates and standard errors under MAR and missing completely at random (MCAR).Footnote 52 For the fitted models to be reliable, FIML requires the incomplete data to be at least MAR, although there is evidence it is superior to other missing data options even in the non-ignorable situation.Footnote 53 To ascertain whether this was the case, we modelled ‘missingness’ using all the variables included in our SEM model plus additional variables such as the social profile of the areas and characteristics of candidates that might affect levels of response.Footnote 54 For all parties the models were very poor at predicting missingness, suggesting no serious bias. For both Labour and the Conservatives, only two of a large number of variables were significant, while only one variable (party share 2005) was significant for the Liberal Democrats.Footnote 55 The latter is not surprising given that despite recent local and parliamentary gains, the Liberal Democrats are still much smaller than the other two main parties and simply do not have the resources or infrastructure to field permanent agents where they are weakest. Even so, all the significant predictors’ related to missingness for each party are allowed for in the SEM model, and therefore, we can consider these are MAR. In other words, they are randomly missing conditional on other variables in the model.Footnote 56 This suggests that the key condition for obtaining reliable fitted models using the FIML estimator is met.
Model results
The fit of the full model was assessed against standard goodness of fit measures including the Comparative Fit Index (0.943), the Tucker Lewis Index (0.930) and the Root Mean Square of Approximation (0.005).Footnote 57 Each of these indicated a ‘good’ model fit.Footnote 58 However, these are global model fit indices that tell us little about how well the model explains particular outcomes. We therefore also report R 2 statistics for individual regressions.
Measuring the Latent Variable
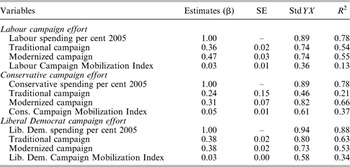
Table 3 provides the standardized and unstandardized regression estimates of campaign measurement indicators on the latent variables (for the full model), which we refer to as ‘campaign effort’. The standardized estimates (column headed StdYX) are equivalent to factor loadings from a common factor analysis. The unstandardized estimates for campaign spending are constrained to equal 1, with estimates for other indicators providing relative values. Apart from the Conservatives’ traditional campaign index, all the other indicators are significantly and positively correlated with the latent variable for each of the main parties. In all cases the largest standardized loadings are for party spending, suggesting that it is this variable which is the best indicator of the underlying latent construct, campaign effort. The Conservatives’ traditional campaign index, which, as we saw above, is poorly correlated with the other indicators, is insignificant and seems to be particularly affected by missing data.Footnote 59 However, the coefficients for all the other variables are significant suggesting that the latent variable is a good representation of each of the variables.
This is reinforced by the R 2 statistics that denote the proportion of variance in each indicator which is explained by the model, thereby confirming our first hypothesis. Because the indicators are regressed only on the latent variables, the R 2 values are directly proportional to (i.e. the square of) the standardized coefficients discussed above. Thus, the latent variable reproduces more than three-quarters of the variance in party spending for each party, and around half to two-thirds of the variance in the campaign intensity survey indicators, with the exception of the traditional Conservative campaign indicator (see Table 3). It also reproduces more than a third of the variance in the BES mobilization index, although for Labour it is just over one-tenth. In order to test the significance of the independent contribution of each indicator we re-specified the model without each of the indicators in turn. We found that the addition of each indicator made a substantial and significant contribution in the reduction of log likelihood.
Estimates of Campaign Indicators on Latent Variables†

†Factor loadings, full model.
Where Parties Campaign
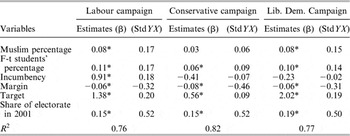
Now that we have established a measure of the campaign effort of each of the parties and before examining the impact of those variables on the 2005 share of the electorate, we first examine where parties campaign hardest. In relation to Figure 2 this is captured by the causal arrows running into the latent variable, or in other words the regression of the latent variables on the covariates by party. The estimates for these models are presented in Table 4.
Regression of Latent Variables on Covariates by Party: Labour, Conservative and Liberal Democrat Campaign Effort

*Significant at the 0.05 level.
For Labour, the standardized coefficients in Table 4 show that the most important predictor of where Labour targeted its campaign effort is previous share of the electorate. Unsurprisingly, Labour campaigned harder where they were stronger, which is likely to reflect the forces of inertia described above including the level of resources commanded by the local constituency party.Footnote 60 It will be seen below that this is true of each of the major parties. The second most important variable is the level of marginality. The greater the margin (i.e. the further Labour were behind the second-placed party, or – in seats they held – the further they were ahead) the less campaign effort the party made in 2005. This is completely consistent with the rational targeting of resources towards areas where they would be most likely to deliver seats. Indeed, there was an additional positive and significant effect of target status: that is, other things being equal including marginality, target seats were subject to stronger campaign effort than non-targets. It also made a difference whether there was an incumbent candidate standing, with incumbents running stronger campaigns. Labour’s campaign effort was also greater in areas with larger proportions of Muslims and students. Overall the model explains just over three-quarters of the variance in Labour’s campaign effort, suggesting a powerful model.
Table 4 also shows the equivalent results for the Conservatives. The model explains 82 per cent of the variance in Conservative campaign effort. The magnitude of the effects is similar to those for Labour. The most important predictors of campaign effort are marginality and previous share of the electorate (in the direction expected). Having taken these factors into account the Conservatives were also effective at concentrating effort in target seats. However, unlike Labour incumbents, Conservative incumbent candidates did not run stronger campaigns than new candidates and challengers. This reflects the election context in 2005, in which the Conservatives were running an offensive campaign in contrast to Labour’s defensive one. The Conservatives also ran strong campaigns in constituencies with larger numbers of students.
The results for the Liberal Democrats are also shown in Table 4, and these again confirm the importance of previous strength and marginality, as well as target status. The Liberal Democrats also put in more effort in Muslim areas than would otherwise have been expected, suggesting that they were attempting to mobilize opposition to the war in Iraq. Similarly, the Liberal Democrats campaigned harder in student areas in an attempt to mobilize students opposed to tuition fees.
The importance of both marginality and prior strength for each of the three major parties confirms the second hypothesis. The similarities in coefficients for the parties suggest that all the parties were focusing resources in similar types of area – more marginal seats in ‘middle England’. This is partly reflected in the correlation between the parties’ respective campaign efforts, which is also measured by the model. There were significant correlations between Liberal Democrats and Labour campaigns and also Conservative and Liberal Democrat campaigns, while the correlation between the Conservative and Labour campaign was much weaker but significant.Footnote 61 This suggests that the presence of a strong third-party campaign does bring about a more reactive increase in campaign effort by the major parties. As for Labour and Conservatives, the model explains over three-quarters of the variance in the Liberal Democrats’ campaign effort.
Campaign Effectiveness
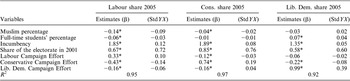
Having examined which factors stimulate campaign effort, we now turn to our third and fourth hypotheses which relate to the impact of campaign effort on vote share. Here we are interested in whether or not the parties’ campaign effort has a significant influence on the parties’ share of the electorate whilst controlling for other variables in the model (such as marginality and previous vote share). As noted above some variables have indirect as well as direct effects on 2005 share of the electorate, all of which are reported here. The direct effect estimates for these regression models by party are presented in Table 5.
Regression of 2005 Share of the Electorate on Campaign Effort and Control Variables: Labour, Conservative and Liberal Democrat Models

*Significant at the 0.05 level.
It is immediately notable that all the variables we tested did have a significant effect on Labour share of the electorate in 2005 in the anticipated direction. In brief, Labour share of the electorate was lower in those areas with a higher proportion of Muslims and students and in areas where it had polled a larger share of the electorate in 2001. Labour also performed better in seats in which it fielded an incumbent candidate. With respect to campaign effort, we found each of the coefficients to be significant and in the hypothesized direction. Thus, Labour performed better where they campaigned harder, even after controlling for other variables in the model, suggesting that the local campaign did matter for Labour. As we shall see, however, this effect turns out to be weaker than the equivalent effect for the Conservatives or the Liberal Democrats, a finding which is consistent with other research which shows campaigns to be less effective for incumbent parties.Footnote 62 Furthermore, we also find, as hypothesized, that Liberal Democrat and particularly the Conservative campaigns had the effect of suppressing the Labour vote. The model explains 95 per cent of the variation in the Labour share of the electorate indicating an exceptionally good predictive model. Whilst much of this is attributed to previous share of the electorate (i.e. continuity) as indicated by the relative size of the standardized coefficients, it is also clear that the campaign variables made a considerable contribution. Notably the standardized coefficient for Conservative campaign effort is greater than that for Labour campaign effort, suggesting that the Conservatives were more effective at reducing the Labour vote than Labour itself were at boosting it.
Table 5 also provides the equivalent results for the Conservatives. The model explains a huge 97 per cent of variance in the Conservative share of the electorate, with not surprisingly previous share constituting the most important variable. Again, most variables are significant and all in the direction expected. The Conservatives did better in constituencies with fewer Muslims and where they fielded incumbent candidates. Notably, after previous share of the electorate, the most important factor affecting the Conservative share was Conservative campaign effort. The positive impact of their campaign was much stronger than the equivalent effect for Labour. Furthermore, both the Labour and Liberal Democrat campaign had a negative impact on the Conservative share of the electorate, though both were less successful at denting Conservative support than the reverse.
Finally, Table 5 shows the impact of the campaign on the Liberal Democrats’ share of the electorate. As for the two larger parties, the model is very successful at explaining the variation in the Liberal Democrats’ share of the electorate and many of the variables are significant and in the direction hypothesized. The Liberal Democrats’ share was greater in areas with larger numbers of studentsFootnote 63 and where they fielded incumbent candidates. The latter effect is quite substantial and confirms previous findings that once the Liberal Democrats have established the credentials for winning, they are very good at retaining their vote.Footnote 64 What is most notable, however, is the size of the Liberal Democrats’ campaign effort effect, which is considerably larger than that of the other two major parties, indicating that where Liberal Democrats (are able to) campaign hard they perform very well. Indeed, the Liberal Democrat campaign effort effect was not much smaller than that of previous share of the electorate (though the latter has an indirect effect through its influence on the campaign effort). Also of note is the negative impact of the Conservative campaign, which is more effective than Labour at curtailing the Liberal Democrats’ share of the electorate in 2005. Interestingly, the strength of the Labour campaign made no impact on the Liberal Democrats’ share, the only one of the campaign effect parameter estimates which was not significant. This is likely to be linked to the widespread protest voting of Labour supporters over the Iraq War which meant that Labour lost ground to the Liberal Democrats in their own heartlands.Footnote 65 Certainly it shows that the Labour local campaign made little impact on winning over Liberal Democrat votes.
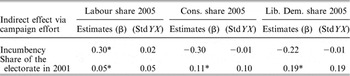
As Figure 2 implies, campaign effort is also potentially an intervening variable between both incumbency and previous performance, and share of the electorate. In other words part of the effect of both previous share of the electorate and candidate incumbency on 2005 share of the electorate is transmitted through campaign effort. Table 6 shows the estimates of these indirect effects. For each of the three main parties, previous share of the electorate had a significant indirect effect on 2005 party performance through campaign effort. This suggests that, as well as having a large direct effect through the impact of continuity in vote (many voters will stay loyal to the same party from one election to the next), past performance also positively influences current performance due to its role in increasing local campaign activity, which in turn boosts party performance. The indirect effects of incumbency are less clear cut. For Labour, incumbency had a significant indirect effect, implying that part of the benefit enjoyed by a Labour incumbent was a reflection of the fact that they ran stronger campaigns. However, the same was not true for the Conservatives or Liberal Democrats. This simply reflects the different nature of the parties’ electoral strategies. Labour was running a defensive campaign and therefore incumbents ran relatively strong campaigns, whereas this was not true for the Conservatives or Liberal Democrats who were more focused on gaining new seats.
Indirect Effect of Candidate Incumbency and 2001 Previous Share of the Electorate via Campaign Effort on 2005 Share of the Electorate: Labour, Conservative and Liberal Democrat Models

*Significant at the 0.05 level.
Discussion
Over recent years there has been a reassessment of the importance of local campaigns, particularly in relation to mobilization of supporters by political parties on polling day. The so-called ‘revisionist school’ have argued that local constituency campaigns do make a difference. Whilst most scholars are in agreement that local campaigns do have a positive impact on a party’s vote share, hitherto the quantification of the effectiveness of local campaigns has been hampered by disagreements over the best way of measuring campaign effort. On one side are those who support the use of campaign spending data, which are easily and cheaply available, and on the other there are those who argue that more refined measures based on surveys of voters or party agents provides a superior guide. We argue that the advantages and disadvantages of each approach should be recognized and, in the spirit of ‘good science’, researchers should draw on all the available evidence to hand. In an ideal world where survey response was 100 per cent and measurement error did not exist, this might not be necessary: we could simply rely on a survey of voters’ exposure or of election agents, employing a direct instrument to measure some observable outcome called ‘campaign effort’.Footnote 66 However, in reality campaign effort is not directly observable. Moreover, in the face of substantial missing data, not to mention inevitable measurement error (or misreporting), survey data alone is inadequate. In the study of the 2005 election, the survey of agents conducted as part of a study for the Electoral Commission, did indeed suffer from a low response rate. The solution we have described here was to combine the survey evidence with party campaign spending data and an individual voter survey in a MIMIC model framework. Quite simply, we used the information about the relationship between the four indicators, and their relationship with a series of covariates, to allow us to estimate ‘campaign effort’ for all areas including those with non-response. Such an approach is recommended to researchers wanting to measure an unobservable construct such as campaign effort, who have multiple data sources or measurement indicators at their disposal and especially when they face similar missing data problems. Given the availability of specialized and easy to use software, like Mplus, this is perfectly feasible for most students of elections.
As it transpired our analyses confirmed the hypothesis that each of the indicators commonly employed by analysts of campaign effects in Britain (spending, the BES mobilization index, the modern campaign index and the traditional campaign index) were all good indicators of an underlying latent construct that we call ‘campaign effort’. Indeed our models show that each of the latent variables (one for each of the three major parties) is highly correlated with almost all the indicators (Hypothesis 1). In support of those who have advocated the use of campaign spending data, we did find that spending is the indicator most highly correlated with the latent variable for each party. However, it is likely that the agent survey indicators were relatively ‘disadvantaged’ in this comparison because of the high frequency of missing data.
Although the methods employed are both robust, and not particularly difficult to employ, some might still ask, ‘Why should I bother?’ Aside from the technical argument that these are statistically superior to equivalent models based on either of the data sources alone, we think that the models reported here provide more plausible and more predictive models than those alternatives. To test whether this was true, we ran these equivalent models, replacing the latent variables in Figure 2 with each of the single indicators in turn. We found that the single indicator models provided less plausible and statistically powerful results than the combined latent variable. Whereas all but one of the coefficients for the regression of 2005 party share of the electorate on the latent variables estimated from the models described above were significant, for the traditional index only those for Liberal Democrats were significant and in the direction hypothesized, whilst all three coefficients for the Conservative traditional campaign (i.e. on their own share of the electorate, on Labour’s and on the Liberal Democrats’) were in a counter-intuitive direction, and all three for Labour were statistically insignificant. In the case of the modernized campaign index, four of the nine coefficients were statistically insignificant, including all three for Labour. Moreover, though the BES mobilization index fared only slightly better with five significant coefficients, all were in the direction expected. Spending (as we had now come to expect) performed relatively well, in so far as seven of the nine coefficients were significant, though surprisingly the insignificant effects included Labour spending on their own share of the electorate.
So if we accept our model estimates as the best possible measure of the impact of the 2005 local campaign on party performances in 2005, what substantive lessons were learnt? In general, the results are entirely consistent with the rational party framework we adopted. First, in relation to the second hypothesis, parties rationally directed their campaigns towards areas in which their effort was most likely to make a difference to the outcome (i.e. according to marginality) though this was constrained by inertia (Hypothesis 2). In keeping with our third hypothesis we showed that greater campaign effort did indeed lead to an improvement in the share of the electorate for each of the three major parties.Footnote 67 This was true after controlling for a wide array of covariates including previous share (Hypothesis 3). More specifically, the Liberal Democrats’ local campaigns had the largest effect on their own performance, whilst the local Labour campaigns were least effective. Previous research also showed that Labour became ever more defensive in 2005, running less intensive campaigns than in 2001.Footnote 68 For the Liberal Democrats, the importance of grassroots local campaigning on its electoral performance has been noted by students of previous elections and once again it has been shown to be an effective tool in the party’s armoury.Footnote 69 Furthermore, the campaign effort of each party also had the effect of suppressing the performance of opposing parties (Hypothesis 4). The one exception to this was the failure of the Labour campaign to hurt the Liberal Democrats’ performance. By far the most effective campaign in damaging opponents proved to be the Conservative campaign. This is further evidence that the Conservatives now focus their campaign effort more efficiently and to much greater effect than they have done previously. Each of these findings, we would argue, is based on statistically powerful models that employ the best data available on campaign effort in Britain. Whilst campaign effort is what statisticians call ‘unobservable’, this does not mean that we cannot measure its impact: it is simply about employing all the evidence available and the most appropriate methods at our disposal.