1 Introduction
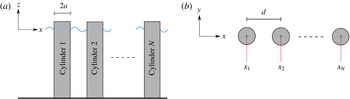
Maniar & Newman (Reference Maniar and Newman1997) studied hydrodynamic loads imposed by surface water waves on columns supporting, for example, bridges or floating airports, using a model based on linear potential-flow theory. They modelled the columns as a long, finite straight-line array of equally spaced, rigid, bottom-mounted, surface-piercing cylinders with identical circular cross-sections. Figure 1 shows schematics of their model geometry, which this study uses as the basic, unperturbed geometry. Spatial locations are defined by the Cartesian coordinate system
 $(x,y,z)$
, where
 $(x,y)$
defines locations in the infinite horizontal plane and
 $z$
is the vertical coordinate. The radius of the cylinders is denoted
 $a$
and the spacing between centres of adjacent cylinders is denoted
 $d$
. The cylinders are aligned along the
 $x$
-axis, and indexed
 $n=1,\ldots ,N$
from left to right. The geometrical centres of the disks they occupy in the horizontal plane are denoted
 $(x_{n},y_{n})$
for
 $n=1,\ldots ,N$
, where
 $x_{n}=x_{1}+(n-1)d$
and
 $y_{n}=0$
. Under the usual assumptions of linear water-wave/structure interaction theory (e.g. Linton & McIver Reference Linton and McIver2001), and noting uniformity of the geometry in the vertical plane, the hydrodynamic loads for motions at a prescribed angular frequency,
 $\unicode[STIX]{x1D714}\in \mathbb{R}_{+}$
, are defined in terms of the velocity potential
 $(g/\text{i}\unicode[STIX]{x1D714})\unicode[STIX]{x1D719}(x,y)\cosh \{k(z+h)\}/\text{cosh}(kh)$
, where
 $g\approx 9.81~\text{m}~\text{s}^{-2}$
is the constant of gravitational acceleration,
 $h$
denotes the equilibrium water depth, and the complex-valued function
 $\unicode[STIX]{x1D719}$
satisfies Helmholtz equation in the horizontal plane exterior to the cylinders with wavenumber
 $k(\unicode[STIX]{x1D714})\in \mathbb{R}_{+}$
, zero-normal-derivative conditions on the cylinder boundaries, and the Sommerfeld radiation condition in the far field.
Maniar & Newman (Reference Maniar and Newman1997) found that cylinders within the array experience extreme, resonant loads at certain frequencies, with the strongest resonance imposing in-line loads (the load in the direction of the array) 35 times that of a cylinder in isolation, for cylinders in the middle of a 100-cylinder array. This occurred for a frequency just below the frequency at which a non-trivial solution exists for the related problem of a single cylinder in the centre of a channel with width equal to the cylinder spacing, and rigid walls on which the normal derivative of the potential vanishes (a Neumann trapped mode; see Callan, Linton & Evans Reference Callan, Linton and Evans1991). They showed a weaker resonance occurs at a frequency just below the frequency at which a non-trivial solution exists for the cognate channel problem in which the potential vanishes on the channel walls (a Dirichlet trapped mode; see Evans & Porter Reference Evans and Porter1997). These trapped modes may be interpreted as solutions of the infinite-array problem, existing in the absence of ambient incident wave forcing. Maniar & Newman (Reference Maniar and Newman1997) argued that, although the trapped-mode solutions do not exist for a finite array, for long arrays incident waves excite large responses almost identical to the trapped modes around these frequencies – a phenomenon known as near trapping – explaining the resonant loads.
Schematics of the geometry considered by Maniar & Newman (Reference Maniar and Newman1997) and others, providing the unperturbed geometry for this study: (a) cross-sectional side view; and (b) plan view.

Evans & Porter (Reference Evans and Porter1999) established the Neumann trapped mode as the standing-wave limit of a so-called Rayleigh–Bloch wave – a trapped mode that propagates along an infinite array and decays exponentially away from it. For circular cylinders, Rayleigh–Bloch waves have been shown to exist for all values of cylinder radius and spacing, and all frequencies below the so-called cutoff, where the Rayleigh–Bloch wave becomes a Neumann trapped mode. Below the cutoff, the Rayleigh–Bloch wavelength is shorter than the wavelength in the surrounding open water, so that it unequivocally cannot radiate energy away from the array. In this regime, incident waves cannot excite a Rayleigh–Bloch wave on an infinite array, as the incident wave imposes a quasi-periodicity on the wave field that is incompatible with the quasi-periodicity of the Rayleigh–Bloch wave. However, incident waves can excite Rayleigh–Bloch waves on arrays with ends, for example, semi-infinite arrays, where a Rayleigh–Bloch wave is generated at the end and propagates along the array, or finite arrays, where Rayleigh–Bloch waves are generated at both ends, propagating in both directions along the array.
Evans & Porter (Reference Evans and Porter1999) found that matching the Rayleigh–Bloch wavelength to the length of the array provides a better approximation of the resonant (near-trapping) frequency for the long, finite array than the frequency of the Neumann trapped mode. They showed that at this resonant frequency the wave-surface profile along the finite array almost exactly matches the profile of the Rayleigh–Bloch wave supported by the corresponding infinite array with an appropriately tuned amplitude, except in vicinities of the array ends. Further, they showed that for cylinder-radius-to-spacing ratios greater than
 ${\sim}0.41$
, Rayleigh–Bloch waves exist that are antisymmetric with respect to the plane passing through the cylinder axes, in addition to the symmetric modes that exist for all ratios. Porter & Evans (Reference Porter and Evans1999) calculated Rayleigh–Bloch waves for non-circular cylinders numerically, and Linton & McIver (Reference Linton and McIver2002) proved Rayleigh–Bloch waves exist for cylinders of arbitrary cross-sectional shape.
Linton, Porter & Thompson (Reference Linton, Porter and Thompson2007) and Peter & Meylan (Reference Peter and Meylan2007) developed similar solution methods for semi-infinite arrays forced by plane incident waves, by expressing the wave field as a superposition of the field supported by the corresponding infinite array under the same forcing, a Rayleigh–Bloch wave propagating along the array (when operating below the cutoff), and a decaying, circular wave generated at the array end. Thompson, Linton & Porter (Reference Thompson, Linton and Porter2008) extended this approach to give an efficient approximation method for long, finite arrays, in which Rayleigh–Bloch waves propagate in both directions along the array, and circular waves are generated at both ends but are assumed to have decayed sufficiently by the time they reach the opposite end that their influence is negligible. They showed that resonance in the middle of the array is due to a combination of (i) strong excitation of Rayleigh–Bloch waves, (ii) strong reflection of Rayleigh–Bloch waves at the ends of the array and (iii) constructive interference of Rayleigh–Bloch waves following multiple reflections, all of which are satisfied just below the cutoff.
Motivated by the findings of Maniar & Newman (Reference Maniar and Newman1997) and others, Kagemoto et al. (Reference Kagemoto, Murai, Saito, Molin and Malenica2002) used laboratory wave-tank experiments to study the wave field along an array of 50 identical, evenly spaced cylinders with radius and spacing of the order 0.1 m, forced by plane waves at head-on incidence and focusing on frequencies around the Neumann trapped mode. Measurements of free-surface elevations along the array were analysed, as proxies for the loads on the cylinders. They showed that the resonance is significantly smaller than the theoretical prediction and occurs towards the front of the array rather than in the middle. They attributed this to viscous dissipation on the cylinder surfaces, acknowledging that viscous effects would be far weaker at field scales.
Rayleigh–Bloch waves exist in other branches of wave science, where they are sometimes known as edge, guided, surface or bound waves. Colquitt et al. (Reference Colquitt, Craster, Antonakakis and Guenneau2015) recently developed low- and high-frequency homogenisation theories to calculate Rayleigh–Bloch waves in an elastic medium with an infinite array of voids. Their Introduction provides an up-to-date review of Rayleigh–Bloch waves in different phenomena.
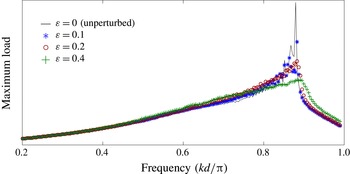
Maximum normalised in-line load on a 100-cylinder array produced by a plane incident wave at head-on incidence, with cylinder-radius-to-spacing ratio
 $a/d=0.25$
, for an unperturbed array (
 $\unicode[STIX]{x1D700}=0$
, –), and the means of ensembles of 100 randomly generated realisations of perturbed arrays, using perturbation strengths
 $\unicode[STIX]{x1D700}=0.1$
(
 $\ast$
),
 $\unicode[STIX]{x1D700}=0.2$
(○) and
 $\unicode[STIX]{x1D700}=0.4$
(
 $+$
).

The present study concerns the impacts of perturbing the cylinder locations from their regular arrangement on the excitation of resonant loads, with figure 2 acting as catalyst. It shows the frequency dependence of the normalised maximum in-line load
 $$\begin{eqnarray}\max _{n=1,\ldots ,N}|F_{n}|\quad \text{where}~F_{n}=\frac{\tanh (ka)}{ka}\int _{-\unicode[STIX]{x03C0}}^{\unicode[STIX]{x03C0}}\unicode[STIX]{x1D719}(x_{n}+a\cos \unicode[STIX]{x1D717},y_{n}+a\sin \unicode[STIX]{x1D717})\cos (\unicode[STIX]{x1D717})\,\text{d}\unicode[STIX]{x1D717}\end{eqnarray}$$
on 100-cylinder arrays, caused by an ambient incident plane wave with potential
 $$\begin{eqnarray}\unicode[STIX]{x1D719}_{am}=A\unicode[STIX]{x1D711}\quad \text{where}~\unicode[STIX]{x1D711}(x,y:\unicode[STIX]{x1D713}_{am})=\text{e}^{\text{i}k(x\,\text{cos}\,\unicode[STIX]{x1D713}_{am}+y\,\text{sin}\,\unicode[STIX]{x1D713}_{am})}\end{eqnarray}$$
and
 $A$
is a constant amplitude, at head-on incidence
 $\unicode[STIX]{x1D713}_{am}=0$
. Results are shown for the unperturbed array, with
 $a/d=0.25$
as in Maniar & Newman (Reference Maniar and Newman1997, figure 2), and perturbed arrays in which the perturbations are chosen randomly from uniform distributions, with the perturbation strength (later denoted
 $\unicode[STIX]{x1D700}$
) being half the magnitude of the maximum perturbation relative to the cylinder spacing. Results shown for the perturbed arrays are means of 100 randomly generated realisations of the array. The results are for illustrative purposes only and the values of the loads on the linearly scaled ordinate axis are omitted accordingly.
The loads for the unperturbed array display the resonance associated with the Neumann trapped mode, around
 $kd/\unicode[STIX]{x03C0}\approx 0.88535$
, as identified by Maniar & Newman (Reference Maniar and Newman1997) and others. (No attempt has been made to sample the frequency range in order to capture the resonance exactly.) The series of maxima and minima leading up to the resonance is a consequence of resonant and antiresonant interactions between the rightward- and leftward-propagating Rayleigh–Bloch waves, which can be deduced from Thompson et al. (Reference Thompson, Linton and Porter2008)’s equations (33) and (41). The frequency range shown extends just beyond the cutoff at frequency
 $kd/\unicode[STIX]{x03C0}\approx 0.88574$
, omitting the weaker resonance associated with the Dirichlet trapped mode. The focus of this investigation will be on frequencies around the strongest resonance, as in Evans & Porter (Reference Evans and Porter1999), Thompson et al. (Reference Thompson, Linton and Porter2008) and others. Perturbations significantly damp this resonance, with the damping increasing as the perturbation strength increases. Maximum loads away from the resonance are relatively unaffected by perturbations.
In many other situations involving wave propagation through some medium, random perturbations in the medium suppress wave propagation, spatially localising wave energy to a vicinity of their source – a phenomenon known as Anderson localisation (see the book by Sheng Reference Sheng2006). Localisation can be identified as exponential attenuation of the wave through the medium, for which, in the absence of perturbations, the wave would propagate without loss of intensity. It has been discovered, mainly theoretically but also experimentally, for classical waves in many contexts, including structural acoustics (Hodges & Woodhouse Reference Hodges and Woodhouse1983), ultrasonics (Weaver Reference Weaver1990) and optics (Berry & Klein Reference Berry and Klein1997).
Here, random perturbations in the locations of cylinders in the line array are shown to localise Rayleigh–Bloch waves, within the framework of linear potential-flow theory, leading to the damping of resonant loads observed in figure 2. To the authors’ knowledge, localisation of Rayleigh–Bloch modes has not been investigated in any context previously. As part of the study, a solution method is developed for line arrays that identifies Rayleigh–Bloch wave modes supported by unperturbed arrays from the scattering characteristics of individual cylinders, without evaluating slowly convergent Schlömilch series, as necessitated by standard interaction theory (e.g. Evans & Porter Reference Evans and Porter1997). The method is based on the plane-wave integral representation of the wave field (e.g. Clemmow Reference Clemmow1966), as opposed to Fourier–Bessel representations more familiar in array problems, and is adapted from the method outlined by Montiel, Squire & Bennetts (Reference Montiel, Squire and Bennetts2015, Reference Montiel, Squire and Bennetts2016) for wave propagation through large, finite arrays of scatterers/floating bodies. The key challenge is then to extract perturbed Rayleigh–Bloch wavenumbers from the overall wave fields, and this is achieved by (i) using Rayleigh–Bloch waves rather than plane waves as forcing, and (ii) combining wave fields forced by Rayleigh–Bloch waves propagating in opposite directions for each individual realisation of the perturbed array. Perturbation strengths
 $\unicode[STIX]{x1D700}=O(0.01)$
are shown to slightly decrease the Rayleigh–Bloch wavenumber, resulting in small phase shifts in the load profiles along the array and weakly damping the resonance. Perturbation strengths
 $\unicode[STIX]{x1D700}=O(0.1)$
are shown to produce imaginary components in the Rayleigh–Bloch wavenumber, causing the Rayleigh–Bloch waves to attenuate along the array, shifting the maximum load to the front of the array and strongly damping the resonance.
2 Rayleigh–Bloch waves of unperturbed problem
2.1 Reflection and transmission kernels for a single cylinder
Consider the subregion of the horizontal plane
 $$\begin{eqnarray}\unicode[STIX]{x1D6FA}=\{(x,y):x_{-}<x<x_{+}~\text{and}~y\in \mathbb{R}\},\end{eqnarray}$$
where the limits
 $x_{\pm }$
are chosen so that it contains a single cylinder only (cylinder
 $n$
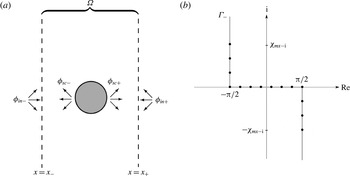
, say). Figure 3(a) shows a schematic of the subregion. The wave field incident on the cylinder in
 $\unicode[STIX]{x1D6FA}$
,
 $\unicode[STIX]{x1D719}_{in}$
, consists of the ambient incident wave and the scattered wave fields produced by all other cylinders in the array. Let the incident field be decomposed as
 $\unicode[STIX]{x1D719}_{in}=\unicode[STIX]{x1D719}_{in-}+\unicode[STIX]{x1D719}_{in+}$
, where
 $\unicode[STIX]{x1D719}_{in-}$
represents the part of the wave field incident from the left-hand boundary of
 $\unicode[STIX]{x1D6FA}$
, and
 $\unicode[STIX]{x1D719}_{in+}$
represents the part incident from the right-hand boundary, as illustrated in figure 3(a).
The incident fields are expressed in the plane-wave integral form
 $$\begin{eqnarray}\unicode[STIX]{x1D719}_{in\pm }=\int _{\unicode[STIX]{x1D6E4}_{\pm }}A_{\pm }(\unicode[STIX]{x1D712})\unicode[STIX]{x1D711}(x,y:\unicode[STIX]{x1D712})\,\text{d}\unicode[STIX]{x1D712},\end{eqnarray}$$
where the integration contours are defined by
 $$\begin{eqnarray}\unicode[STIX]{x1D6E4}_{-}=\{-\unicode[STIX]{x03C0}/2+\text{i}\unicode[STIX]{x1D6FE}:\unicode[STIX]{x1D6FE}\in \mathbb{R}_{+}\}\cup \{\unicode[STIX]{x1D6FE}\in \mathbb{R}:-\unicode[STIX]{x03C0}/2\leqslant \unicode[STIX]{x1D6FE}\leqslant \unicode[STIX]{x03C0}/2\}\cup \{\unicode[STIX]{x03C0}/2-\text{i}\unicode[STIX]{x1D6FE}:\unicode[STIX]{x1D6FE}\in \mathbb{R}_{+}\},\end{eqnarray}$$
as shown by the grey curve in figure 3(b), and
 $\unicode[STIX]{x1D6E4}_{+}=\unicode[STIX]{x1D6E4}_{-}+\unicode[STIX]{x03C0}$
. On the real branches of
 $\unicode[STIX]{x1D6E4}_{\pm }$
,
 $\unicode[STIX]{x1D711}$
defines plane waves propagating rightwards for
 $\unicode[STIX]{x1D6E4}_{-}$
and leftwards for
 $\unicode[STIX]{x1D6E4}_{+}$
. On the complex branches, it defines plane waves that decay rightwards for
 $\unicode[STIX]{x1D6E4}_{-}$
and leftwards for
 $\unicode[STIX]{x1D6E4}_{+}$
. Therefore, equation (2.2) expresses the incident wave field
 $\unicode[STIX]{x1D719}_{in-}$
as a superposition of plane waves propagating/decaying rightwards, and
 $\unicode[STIX]{x1D719}_{in+}$
as a superposition of plane waves propagating/decaying leftwards, weighted by amplitude functions
 $A_{\pm }$
, respectively.
(a) Schematic of region
 $\unicode[STIX]{x1D6FA}$
defined in (2.1), and corresponding incident and scattered fields, as defined in (2.2) and (2.7b
), respectively. (b) Integration contour
 $\unicode[STIX]{x1D6E4}_{-}$
(–) in the complex plane, as defined in (2.3), and sampled points used for numerical approximation (●, see § 2.2).

The individual plane-wave components of the incident field,
 $\unicode[STIX]{x1D711}$
, have the Fourier–Bessel series representations
 $$\begin{eqnarray}\unicode[STIX]{x1D711}(x,y:\unicode[STIX]{x1D713})=\mathop{\sum }_{m=-\infty }^{\infty }\text{e}^{\text{i}m(\unicode[STIX]{x03C0}/2-\unicode[STIX]{x1D713})}\text{J}_{m}(kr)\text{e}^{\text{i}m\unicode[STIX]{x1D703}},\end{eqnarray}$$
where
 $r=\sqrt{(x-x_{n})^{2}+(y-y_{n})^{2}}$
and
 $\unicode[STIX]{x1D703}=\arg \{(x-x_{n})+\text{i}(y-y_{n})\}$
are, respectively, the radial and azimuthal coordinates associated with the cylinder in
 $\unicode[STIX]{x1D6FA}$
, and
 $\text{J}_{m}$
is the first-kind Bessel function of order
 $m$
. The scattered wave field produced by this incident component is
 $$\begin{eqnarray}\unicode[STIX]{x1D711}_{sc}(x,y:\unicode[STIX]{x1D713})=\mathop{\sum }_{m=-\infty }^{\infty }Z_{m}\text{e}^{\text{i}m(\unicode[STIX]{x03C0}/2-\unicode[STIX]{x1D713})}\text{H}_{m}(kr)\text{e}^{\text{i}m\unicode[STIX]{x1D703}},\end{eqnarray}$$
where
 $\text{H}_{m}$
is the first-kind Hankel function of order
 $m$
and
 $Z_{m}=-\text{J}_{m}^{\prime }(ka)/\text{H}_{m}^{\prime }(ka)$
(e.g. Martin Reference Martin2006). It has the plane-wave integral representation
 $$\begin{eqnarray}\unicode[STIX]{x1D711}_{sc}(x,y:\unicode[STIX]{x1D713})=\frac{1}{\unicode[STIX]{x03C0}}\mathop{\sum }_{m=-\infty }^{\infty }Z_{m}\int _{\unicode[STIX]{x1D6E4}_{\mp }}\text{e}^{\text{i}m(\unicode[STIX]{x1D712}-\unicode[STIX]{x1D713})}\unicode[STIX]{x1D711}(x,z:\unicode[STIX]{x1D712})\,\text{d}\unicode[STIX]{x1D712}\end{eqnarray}$$
for
 $\pm (x-x_{n})\geqslant 0$
and
 $r>a$
, derived using the Sommerfeld integral representation for Hankel functions (Sommerfeld Reference Sommerfeld1949, § 19).
For the full incident wave field,
 $\unicode[STIX]{x1D719}_{in}$
, defined by (2.2), the scattered wave field is
 $$\begin{eqnarray}\displaystyle \unicode[STIX]{x1D719}_{sc}(x,y) & = & \displaystyle \int _{\unicode[STIX]{x1D6E4}_{-}}A_{-}(\unicode[STIX]{x1D713})\unicode[STIX]{x1D711}_{sc}(x,y:\unicode[STIX]{x1D713})\,\text{d}\unicode[STIX]{x1D713}+\int _{\unicode[STIX]{x1D6E4}_{+}}A_{+}(\unicode[STIX]{x1D713})\unicode[STIX]{x1D711}_{sc}(x,y:\unicode[STIX]{x1D713})\,\text{d}\unicode[STIX]{x1D713},\end{eqnarray}$$
 $$\begin{eqnarray}\displaystyle & = & \displaystyle \int _{\unicode[STIX]{x1D6E4}_{\mp }}\tilde{B}_{\pm }(\unicode[STIX]{x1D712})\unicode[STIX]{x1D711}(x,y:\unicode[STIX]{x1D712})\,\text{d}\unicode[STIX]{x1D712}\equiv \unicode[STIX]{x1D719}_{sc\pm }(x,y)\end{eqnarray}$$
 $\pm (x-x_{n})\geqslant 0$
and
 $r>a$
, where
 $$\begin{eqnarray}\tilde{B}_{\pm }(\unicode[STIX]{x1D712})=\frac{1}{\unicode[STIX]{x03C0}}\mathop{\sum }_{m=-\infty }^{\infty }Z_{m}\left\{\int _{\unicode[STIX]{x1D6E4}_{-}}\text{e}^{\text{i}m(\unicode[STIX]{x1D712}-\unicode[STIX]{x1D713})}A_{-}(\unicode[STIX]{x1D713})\,\text{d}\unicode[STIX]{x1D713}+\int _{\unicode[STIX]{x1D6E4}_{+}}\text{e}^{\text{i}m(\unicode[STIX]{x1D712}-\unicode[STIX]{x1D713})}A_{+}(\unicode[STIX]{x1D713})\,\text{d}\unicode[STIX]{x1D713}\right\}\end{eqnarray}$$
for
 $\unicode[STIX]{x1D712}\in \unicode[STIX]{x1D6E4}_{\mp }$
, are scattered amplitude functions. Equation (2.7b
) expresses the scattered field as a superposition of waves propagating/decaying leftwards on the left-hand side of the cylinder, and propagating/decaying rightwards on its right-hand side, as shown in figure 3(a).
The total wave field,
 $\unicode[STIX]{x1D719}$
, is decomposed into fields propagating/decaying rightwards and leftwards on the left- and right-hand sides of the source via the integral representations
 $$\begin{eqnarray}\unicode[STIX]{x1D719}(x,y)=\int _{\unicode[STIX]{x1D6E4}_{\pm }}A_{\pm }(\unicode[STIX]{x1D712})\unicode[STIX]{x1D711}(x,y:\unicode[STIX]{x1D712})\,\text{d}\unicode[STIX]{x1D712}+\int _{\unicode[STIX]{x1D6E4}_{\mp }}B_{\pm }(\unicode[STIX]{x1D712})\unicode[STIX]{x1D711}(x,y:\unicode[STIX]{x1D712})\,\text{d}\unicode[STIX]{x1D712}\end{eqnarray}$$
for
 $\pm (x-x_{n})\geqslant 0$
and
 $r>a$
, where
 $B_{\pm }=A_{\mp }+\tilde{B}_{\pm }$
represent outgoing amplitude functions. The
 $A_{\pm }$
are, accordingly, referred to as incoming amplitude functions. The outgoing amplitude functions are expressed in terms of the incoming amplitude functions using the scattering relations
 $$\begin{eqnarray}\displaystyle B_{-}(\unicode[STIX]{x1D712}) & = & \displaystyle \int _{\unicode[STIX]{x1D6E4}_{-}}R(\unicode[STIX]{x1D712}:\unicode[STIX]{x1D713})A_{-}(\unicode[STIX]{x1D713})\,\text{d}\unicode[STIX]{x1D713}+\int _{\unicode[STIX]{x1D6E4}_{+}}T(\unicode[STIX]{x1D712}:\unicode[STIX]{x1D713})A_{+}(\unicode[STIX]{x1D713})\,\text{d}\unicode[STIX]{x1D713}\end{eqnarray}$$
 $$\begin{eqnarray}\displaystyle \text{and}\quad B_{+}(\unicode[STIX]{x1D712}) & = & \displaystyle \int _{\unicode[STIX]{x1D6E4}_{-}}T(\unicode[STIX]{x1D712}:\unicode[STIX]{x1D713})A_{-}(\unicode[STIX]{x1D713})\,\text{d}\unicode[STIX]{x1D713}+\int _{\unicode[STIX]{x1D6E4}_{+}}R(\unicode[STIX]{x1D712}:\unicode[STIX]{x1D713})A_{+}(\unicode[STIX]{x1D713})\,\text{d}\unicode[STIX]{x1D713}.\end{eqnarray}$$
 $R$
and
 $T$
are, respectively, reflection and transmission kernels, which are defined by
 $$\begin{eqnarray}R(\unicode[STIX]{x1D712}:\unicode[STIX]{x1D713})=\frac{1}{\unicode[STIX]{x03C0}}\mathop{\sum }_{m=-\infty }^{\infty }Z_{m}\text{e}^{\text{i}m(\unicode[STIX]{x1D712}-\unicode[STIX]{x1D713})}\quad \text{and}\quad T(\unicode[STIX]{x1D712}:\unicode[STIX]{x1D713})=\unicode[STIX]{x1D6FF}(\unicode[STIX]{x1D712}-\unicode[STIX]{x1D713})+R(\unicode[STIX]{x1D712}:\unicode[STIX]{x1D713}).\end{eqnarray}$$
They determine the outgoing amplitude response in direction
 $\unicode[STIX]{x1D712}$
due to an incoming amplitude forcing in direction
 $\unicode[STIX]{x1D713}$
.
In order to calculate wave interactions between adjacent subregions, it is convenient to normalise the wave phases to the left- or right-hand side of the region, using the phase-shifted amplitude functions
 $$\begin{eqnarray}\hat{A}_{\pm }(\unicode[STIX]{x1D712})=\text{e}^{\text{i}kx_{\pm }\,\text{cos}(\unicode[STIX]{x1D712})}A_{\pm }(\unicode[STIX]{x1D712})\quad \text{and}\quad \hat{B}_{\pm }(\unicode[STIX]{x1D712})=\text{e}^{\text{i}kx_{\pm }\,\text{cos}(\unicode[STIX]{x1D712})}B_{\pm }(\unicode[STIX]{x1D712}),\end{eqnarray}$$
so that the potential can be expressed as
 $$\begin{eqnarray}\unicode[STIX]{x1D719}(x,y)=\int _{\unicode[STIX]{x1D6E4}_{\pm }}\hat{A}_{\pm }(\unicode[STIX]{x1D712})\hat{\unicode[STIX]{x1D711}}_{\pm }(x,y:\unicode[STIX]{x1D712})\,\text{d}\unicode[STIX]{x1D712}+\int _{\unicode[STIX]{x1D6E4}_{\mp }}\hat{B}_{\pm }(\unicode[STIX]{x1D712})\hat{\unicode[STIX]{x1D711}}_{\pm }(x,y:\unicode[STIX]{x1D712})\,\text{d}\unicode[STIX]{x1D712}\end{eqnarray}$$
for
 $\pm (x-x_{n})\geqslant 0$
and
 $r>a$
, where
 $\hat{\unicode[STIX]{x1D711}}_{\pm }=\text{e}^{\text{i}k\{(x-x_{\pm })\text{cos}\,\unicode[STIX]{x1D713}+y\,\text{sin}\,\unicode[STIX]{x1D713}\}}$
. The phase-shifted amplitude functions satisfy scattering relations analogous to (2.10a–b
), but with reflection and transmission kernels, respectively,
 $$\begin{eqnarray}\displaystyle \hat{R}_{\pm }(\unicode[STIX]{x1D712}:\unicode[STIX]{x1D713}) & = & \displaystyle \text{e}^{\text{i}kx_{\pm }(\text{cos}\,\unicode[STIX]{x1D712}-\text{cos}\,\unicode[STIX]{x1D713})}R(\unicode[STIX]{x1D712}:\unicode[STIX]{x1D713})\end{eqnarray}$$
 $$\begin{eqnarray}\displaystyle \text{and}\quad \hat{T}_{\pm }(\unicode[STIX]{x1D712}:\unicode[STIX]{x1D713}) & = & \displaystyle \text{e}^{\text{i}k(x_{\mp }\,\text{cos}\,\unicode[STIX]{x1D712}-x_{\pm }\,\text{cos}\,\unicode[STIX]{x1D713})}T(\unicode[STIX]{x1D712}:\unicode[STIX]{x1D713}).\end{eqnarray}$$
2.2 Numerical approximation
Following Montiel et al. (Reference Montiel, Squire and Bennetts2015, Reference Montiel, Squire and Bennetts2016), for numerical calculations the complex branches of the contour
 $\unicode[STIX]{x1D6E4}_{-}$
(and, hence,
 $\unicode[STIX]{x1D6E4}_{+}$
) are truncated, with the magnitude of the imaginary parts restricted to being less than or equal to a prescribed value
 $\unicode[STIX]{x1D712}_{mx-\text{i}}\in \mathbb{R}_{+}$
. Further, the truncated contours are sampled, with the real branch sampled at
 $J_{\text{r}}$
regular points, and the complex branches sampled at
 $J_{\text{i}}+1$
regular points. The sampled points at the ends of the real branch overlap with the sampled points at the real-valued ends of the complex branches, so that the composite contours
 $\unicode[STIX]{x1D6E4}_{\pm }$
each contain
 $2J_{\text{i}}+J_{\text{r}}$
sampled points. The black bullets on figure 3(b) are an example of the truncated and sampled version of the contour
 $\unicode[STIX]{x1D6E4}_{-}$
. The infinite series stemming from the Fourier–Bessel representations are also truncated, with the truncation limits denoted
 $\pm M$
. Results presented in §§ 3 and 4 use the truncations
 $M=5$
and
 $\unicode[STIX]{x1D712}_{mx-\text{i}}=2$
, and discretisations
 $J_{\text{r}}=J_{\text{i}}=100$
, which were found to provide sufficient accuracy, noting Montiel et al. (Reference Montiel, Squire and Bennetts2016) present relevant convergence analyses for a related problem.
The numerical approximations convert the operator form of the scattering relations satisfied by the phase-shifted amplitude functions to the array relations
 $$\begin{eqnarray}\hat{\boldsymbol{b}}_{-}=\hat{\unicode[STIX]{x1D64D}}_{-}\hat{\boldsymbol{a}}_{-}+\hat{\unicode[STIX]{x1D64F}}_{+}\hat{\boldsymbol{a}}_{+}\quad \text{and}\quad \hat{\boldsymbol{b}}_{+}=\hat{\unicode[STIX]{x1D64F}}_{-}\hat{\boldsymbol{a}}_{-}+\hat{\unicode[STIX]{x1D64D}}_{+}\hat{\boldsymbol{a}}_{+},\end{eqnarray}$$
where the amplitude vectors
 $\hat{\boldsymbol{a}}_{\pm }$
and
 $\hat{\boldsymbol{b}}_{\pm }$
have entries
 $$\begin{eqnarray}\{\hat{\boldsymbol{a}}_{\pm }\}_{j}=\hat{A}_{\pm }(\unicode[STIX]{x1D712}_{j})\quad \text{and}\quad \{\hat{\boldsymbol{b}}_{\pm }\}_{j}=\hat{B}_{\pm }(\unicode[STIX]{x1D712}_{j})\end{eqnarray}$$
for
 $j=1,\ldots ,2J_{\text{i}}+J_{\text{r}}$
, and the matrices
 $\hat{\unicode[STIX]{x1D64D}}_{\pm }$
and
 $\hat{\unicode[STIX]{x1D64F}}_{\pm }$
have entries
 $$\begin{eqnarray}\{\hat{\unicode[STIX]{x1D64D}}_{\pm }\}_{i,j}=w_{i}\hat{R}_{\pm }(\unicode[STIX]{x1D712}_{j}:\unicode[STIX]{x1D712}_{i})\quad \text{and}\quad \{\hat{\unicode[STIX]{x1D64F}}_{\pm }\}_{i,j}=w_{i}\hat{T}_{\pm }(\unicode[STIX]{x1D712}_{j}:\unicode[STIX]{x1D712}_{i})\end{eqnarray}$$
for
 $i,j=1,\ldots ,2J_{\text{i}}+J_{\text{r}}$
. The matrices combine the reflection/transmission kernels and numerical integration, where
 $w_{i}$
(
 $i=1,\ldots ,2J_{\text{i}}+J_{\text{r}}$
) denote the quadrature weights – a composite trapezoidal rule is used for calculations, as in Montiel et al. (Reference Montiel, Squire and Bennetts2015, Reference Montiel, Squire and Bennetts2016).
2.3 Spectrum for an infinite array of cylinders
Let the transfer matrix,
 $\unicode[STIX]{x1D64B}$
, which maps the amplitude functions on the left-hand side of subregion
 $\unicode[STIX]{x1D6FA}$
to the amplitude functions on the right-hand side, be defined by
 $$\begin{eqnarray}\left(\begin{array}{@{}c@{}}\hat{\boldsymbol{b}}_{+}\\ \hat{\boldsymbol{a}}_{+}\end{array}\right)=\unicode[STIX]{x1D64B}\left(\begin{array}{@{}c@{}}\hat{\boldsymbol{a}}_{-}\\ \hat{\boldsymbol{b}}_{-}\end{array}\right)\quad \text{and}\quad \unicode[STIX]{x1D64B}=\left(\begin{array}{@{}cc@{}}\hat{\unicode[STIX]{x1D64F}}_{-}-\hat{\unicode[STIX]{x1D64D}}_{+}\hat{\unicode[STIX]{x1D64F}}_{+}^{-1}\hat{\unicode[STIX]{x1D64D}}_{-} & \hat{\unicode[STIX]{x1D64D}}_{+}\hat{\unicode[STIX]{x1D64F}}_{+}^{-1}\\ \hat{\unicode[STIX]{x1D64F}}_{+}^{-1}\hat{\unicode[STIX]{x1D64D}}_{-} & \hat{\unicode[STIX]{x1D64F}}_{+}^{-1}\end{array}\right).\end{eqnarray}$$
Centring the subregion around the cylinder it contains and setting its width to be
 $d$
, i.e.
 $x_{\pm }=x_{n}\pm d/2$
are the midpoints between the cylinder in
 $\unicode[STIX]{x1D6FA}$
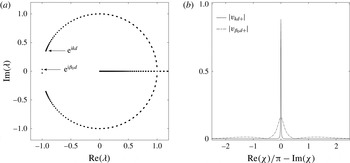
and the adjacent cylinders, the spectrum of the transfer matrix determines the modes supported by the unperturbed array. Figure 4(a) shows an example of the eigenvalues
 $\unicode[STIX]{x1D706}=\unicode[STIX]{x1D706}_{i}\;(i=1,\ldots ,4J_{\text{i}}+2J_{\text{r}})$
of the transfer matrix in the complex plane. The example problem considered is the resonant case Maniar & Newman (Reference Maniar and Newman1997) identified for
 $N=100$
cylinders, at frequency
 $kd=2.78142\;(kd/\unicode[STIX]{x03C0}\approx 0.88535)$
. The eigenvalues appear in reciprocal pairs, i.e. for
 $|\unicode[STIX]{x1D706}|=1$
if
 $\exp \{\text{i}\arg (\unicode[STIX]{x1D706})\}$
is an eigenvalue then so is
 $\exp \{-\text{i}\arg (\unicode[STIX]{x1D706})\}$
, and for
 $\arg (\unicode[STIX]{x1D706})=0$
if
 $|\unicode[STIX]{x1D706}|$
is an eigenvalue then so is
 $1/|\unicode[STIX]{x1D706}|$
. Repeated eigenvalues relate to symmetric and antisymmetric eigenfunctions with respect to
 $\unicode[STIX]{x1D712}$
.
Spectrum of transfer matrix
 $\unicode[STIX]{x1D64B}$
, defined in (2.18), for
 $a/d=0.25$
at the resonant frequency for the 100-cylinder array,
 $kd/\unicode[STIX]{x03C0}\approx 0.88535$
. (a) Eigenvalues
 $\unicode[STIX]{x1D706}$
in the complex plane, with eigenvalues supporting head-on incidence in the positive
 $x$
-direction,
 $\exp (\text{i}kd)$
, and the Rayleigh–Bloch mode propagating in the positive
 $x$
-direction,
 $\exp (\text{i}\unicode[STIX]{x1D6FD}_{0}d)$
, indicated. (b) The moduli of the corresponding eigenfunctions associated with rightward propagating/decaying motions,
 $v_{kd+}$
and
 $v_{\unicode[STIX]{x1D6FD}_{0}d+}$
, respectively, as functions of the spectral parameter
 $\unicode[STIX]{x1D712}$
.

The eigenvalues forming the backwards

 $x$
-axis,
 $\unicode[STIX]{x1D713}_{am}$
, is related to the argument of the eigenvalue via
 $\arg (\unicode[STIX]{x1D706})=kd\cos (\unicode[STIX]{x1D713}_{am})$
. Therefore, the eigenvalues at
 $\unicode[STIX]{x1D706}=1$
correspond to incident waves normal to the array, propagating parallel to the
 $y$
-axis, and the eigenvalues at the tips of the backwards

 $x$
-axis. The eigenvalue at the upper tip, which is labelled
 $\exp (\text{i}kd)$
, corresponds to a rightward propagating incident wave, and the eigenvalue at the lower tip,
 $\exp (-\text{i}kd)$
(unlabelled), corresponds to a leftward propagating incident wave.
The subset of eigenvalues on the positive real axis form the discrete approximation to the continuous spectrum, generalised to forcing waves that decay exponentially. Eigenvalues smaller than unity decay rightwards, and eigenvalues greater than unity decay leftwards. The set of eigenvalues greater than unity extends beyond the figure limits.
The pair of eigenvalues on the unit circle closest to negative unity correspond to Rayleigh–Bloch wave modes. These eigenvalues are denoted
 $\exp (\pm \text{i}\unicode[STIX]{x1D6FD}_{0}d)$
, where
 $\unicode[STIX]{x1D6FD}_{0}\in \mathbb{R}_{+}$
is the Rayleigh–Bloch wavenumber. They form the discrete spectrum, i.e. they correspond to solutions for which wave energy decays with distance away from the array. The eigenvalue in the upper half of the complex plane, which is labelled
 $\exp (\text{i}\unicode[STIX]{x1D6FD}_{0}d)$
, relates to the mode that propagates rightwards along the array, and the eigenvalue in the lower half of the complex plane,
 $\exp (-\text{i}\unicode[STIX]{x1D6FD}_{0}d)$
(unlabelled), to the mode that propagates leftwards. As these eigenvalues are separated from the

 $\unicode[STIX]{x1D6FD}_{0}>k$
, confirming that the Rayleigh–Bloch waves are shorter than the waves in the surrounding open water.
The definitions of continuous and discrete spectra used here are in terms of quasi-periodicities of possible solutions for a given frequency. This differs from, for example, Porter & Evans (Reference Porter and Evans1999), who define the spectra in terms of frequencies at which solutions exist for a given quasi-periodicity. In simple terms, the spectral parameter used here relates to the directional spectrum, whereas in Porter & Evans (Reference Porter and Evans1999) and others it relates to the frequency spectrum.
Figure 4(b) shows the moduli of the rightward-propagating/decaying components of the eigenfunctions,
 $v_{kd+}(\unicode[STIX]{x1D712})$
and
 $v_{\unicode[STIX]{x1D6FD}_{0}d+}(\unicode[STIX]{x1D712})$
, associated with the labelled eigenvalues
 $\exp (\text{i}kd)$
and
 $\exp (\text{i}\unicode[STIX]{x1D6FD}_{0}d)$
, respectively. The eigenfunctions are approximated using the eigenvectors associated with the eigenvalues, and are normalised so that their
 $L_{2}$
-norm is unity. The eigenfunction
 $v_{kd+}$
displays a sharp spike at
 $\unicode[STIX]{x1D712}=0$
. This is an approximation of a Dirac delta function, corresponding to the plane ambient incident wave in the infinite-array problem. In contrast, the eigenfunction
 $v_{\unicode[STIX]{x1D6FD}_{0}d+}$
is smooth, indicating that it is an unforced solution of the infinite-array problem. Its dominant energy is spread around
 $\unicode[STIX]{x1D712}=0$
, and it has sidebands extending onto the complex branches (
 $|\text{Re}(\unicode[STIX]{x1D712})/\unicode[STIX]{x03C0}-\text{Im}(\unicode[STIX]{x1D712})|>0.5$
).
3 Damping of resonant loads
3.1 Solution method for finite, perturbed arrays
Positional disorder is introduced into the problem via random perturbations in the locations of the cylinders. The perturbed locations of the cylinder centres are denoted
 $$\begin{eqnarray}(x_{n},y_{n})=(x_{1}+(n-1)d,0)+\boldsymbol{p}_{n}\quad \text{for}~n=1,\ldots ,N.\end{eqnarray}$$
A parameter
 $\unicode[STIX]{x1D700}$
is used to control the perturbation strength, with the perturbation vectors expressed as
 $$\begin{eqnarray}\boldsymbol{p}_{n}=\unicode[STIX]{x1D700}d(\unicode[STIX]{x1D707}_{n},\unicode[STIX]{x1D708}_{n})\quad \text{for}~n=1,\ldots ,N,\end{eqnarray}$$
where
 $\unicode[STIX]{x1D707}_{n}$
and
 $\unicode[STIX]{x1D708}_{n}$
are randomly selected from uniform distributions over the interval
 $[-0.5,0.5]$
. The perturbation strength is bounded by
 $\unicode[STIX]{x1D700}<1-2a/d$
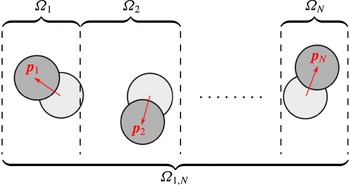
so that cylinders cannot overlap. Figure 5 shows a schematic of the perturbed geometry.
Schematic plan view of the perturbed geometry.

A contiguous sequence of subregions
 $\unicode[STIX]{x1D6FA}_{n}\;(n=1,\ldots ,N)$
is chosen, as shown in figure 5, with each subregion containing the cylinder of the corresponding index. (As indicated in figure 5, it is unnecessary for the subregions to contain the corresponding unperturbed cylinders.) The amplitude functions and reflection/transmission matrices associated with subregion
 $\unicode[STIX]{x1D6FA}_{n}$
are assigned superscripts
 $(n)$
, with the reflection/transmission matrices calculated using the method outlined in §§ 2.1–2.2.
For
 $1\leqslant p\leqslant q\leqslant N$
,
 $\unicode[STIX]{x1D6FA}_{p,q}$
denotes the region contained between the left-hand boundary of
 $\unicode[STIX]{x1D6FA}_{p}$
and the right-hand boundary of
 $\unicode[STIX]{x1D6FA}_{q}$
, with figure 5 showing
 $\unicode[STIX]{x1D6FA}_{1,N}$
as an example. Let
 $\hat{\unicode[STIX]{x1D64D}}_{\pm }^{(p,q)}$
and
 $\hat{\unicode[STIX]{x1D64F}}_{\pm }^{(p,q)}$
denote the reflection and transmission matrices for this region, i.e.
 $$\begin{eqnarray}\hat{\boldsymbol{b}}_{-}^{(p)}=\hat{\unicode[STIX]{x1D64D}}_{-}^{(p,q)}\hat{\boldsymbol{a}}_{-}^{(p)}+\hat{\unicode[STIX]{x1D64F}}_{+}^{(p,q)}\hat{\boldsymbol{a}}_{+}^{(q)}\quad \text{and}\quad \hat{\boldsymbol{b}}_{+}^{(q)}=\hat{\unicode[STIX]{x1D64F}}_{-}^{(p,q)}\hat{\boldsymbol{a}}_{-}^{(p)}+\hat{\unicode[STIX]{x1D64D}}_{+}^{(p,q)}\hat{\boldsymbol{a}}_{+}^{(q)}.\end{eqnarray}$$
The reflection and transmission matrices for
 $\unicode[STIX]{x1D6FA}_{p,q}$
with
 $\unicode[STIX]{x1D6FA}_{q+1}$
appended to its right-hand side,
 $\hat{\unicode[STIX]{x1D64D}}_{\pm }^{(p,q+1)}$
and
 $\hat{\unicode[STIX]{x1D64F}}_{\pm }^{(p,q+1)}$
, can be calculated from
 $\hat{\unicode[STIX]{x1D64D}}_{\pm }^{(p,q)}$
,
 $\hat{\unicode[STIX]{x1D64F}}_{\pm }^{(p,q)}$
,
 $\hat{\unicode[STIX]{x1D64D}}_{\pm }^{(q+1)}$
and
 $\hat{\unicode[STIX]{x1D64F}}_{\pm }^{(q+1)}$
via
 $$\begin{eqnarray}\displaystyle \unicode[STIX]{x1D64D}_{-}^{(p,q+1)} & = & \displaystyle \unicode[STIX]{x1D64D}_{-}^{(p,q)}+\unicode[STIX]{x1D64F}_{+}^{(p,q)}\left(\unicode[STIX]{x1D644}-\unicode[STIX]{x1D64D}_{-}^{(q+1)}\unicode[STIX]{x1D64D}_{+}^{(p,q)}\right)^{-1}\unicode[STIX]{x1D64D}_{-}^{(q+1)}\unicode[STIX]{x1D64F}_{-}^{(p,q)},\end{eqnarray}$$
 $$\begin{eqnarray}\displaystyle \unicode[STIX]{x1D64F}_{+}^{(p,q+1)} & = & \displaystyle \unicode[STIX]{x1D64F}_{+}^{(p,q)}\left(\unicode[STIX]{x1D644}-\unicode[STIX]{x1D64D}_{-}^{(q+1)}\unicode[STIX]{x1D64D}_{+}^{(p,q)}\right)^{-1}\unicode[STIX]{x1D64F}_{+}^{(q+1)}\end{eqnarray}$$
 $$\begin{eqnarray}\displaystyle \unicode[STIX]{x1D64D}_{+}^{(p,q+1)} & = & \displaystyle \unicode[STIX]{x1D64D}_{+}^{(q+1)}+\unicode[STIX]{x1D64F}_{-}^{(q+1)}\left(\unicode[STIX]{x1D644}-\unicode[STIX]{x1D64D}_{+}^{(p,q)}\unicode[STIX]{x1D64D}_{-}^{(q+1)}\right)^{-1}\unicode[STIX]{x1D64D}_{+}^{(p,q)}\unicode[STIX]{x1D64F}_{+}^{(q+1)},\end{eqnarray}$$
 $$\begin{eqnarray}\displaystyle \text{and}\quad \unicode[STIX]{x1D64F}_{-}^{(p,q+1)} & = & \displaystyle \unicode[STIX]{x1D64F}_{-}^{(q+1)}\left(\unicode[STIX]{x1D644}-\unicode[STIX]{x1D64D}_{+}^{(p,q)}\unicode[STIX]{x1D64D}_{-}^{(q+1)}\right)^{-1}\unicode[STIX]{x1D64F}_{-}^{(p,q)},\end{eqnarray}$$
 $\unicode[STIX]{x1D644}$
is the identity matrix of dimension
 $2J_{\text{i}}+J_{\text{r}}$
. These relations are derived from the scattering relations for an individual region (2.15), on the basis that (i) the outgoing wave field on the right-hand side of cylinder
 $q$
is the incoming field on the left-hand side of cylinder
 $q+1$
, and (ii) the outgoing field on the left-hand side of cylinder
 $q+1$
is the incoming field on the right-hand side of cylinder
 $q$
, i.e.
 $$\begin{eqnarray}\hat{\boldsymbol{a}}_{-}^{(q+1)}=\hat{\boldsymbol{b}}_{+}^{(q)}\quad \text{and}\quad \hat{\boldsymbol{a}}_{+}^{(q)}=\hat{\boldsymbol{b}}_{-}^{(q+1)}.\end{eqnarray}$$
Versions of relations (3.4) have been used by Botten et al. (Reference Botten, White, Asatryan, Langtry, de Sterke and McPhedran2004), Peter & Meylan (Reference Peter and Meylan2009) and Bennetts (Reference Bennetts2011), among others, for electromagnetic, water wave and acoustic problems, respectively.
The reflection and transmission matrices
 $\hat{\unicode[STIX]{x1D64D}}_{\pm }^{(1,n)}$
and
 $\hat{\unicode[STIX]{x1D64F}}_{\pm }^{(1,n)}$
for
 $n=1,\ldots ,N$
are obtained by beginning with the leftmost region,
 $\unicode[STIX]{x1D6FA}_{1}$
, recursively appending the next region to the right and applying (3.4). The process is initialised with the identities
 $$\begin{eqnarray}\hat{\unicode[STIX]{x1D64D}}_{\pm }^{(1,1)}=\hat{\unicode[STIX]{x1D64D}}_{\pm }^{(1)}\quad \text{and}\quad \hat{\unicode[STIX]{x1D64F}}_{\pm }^{(1,1)}=\hat{\unicode[STIX]{x1D64F}}_{\pm }^{(1)}.\end{eqnarray}$$
Similarly, the reflection and transmission matrices
 $\hat{\unicode[STIX]{x1D64D}}_{\pm }^{(n,N)}$
and
 $\hat{\unicode[STIX]{x1D64F}}_{\pm }^{(n,N)}$
for
 $n=1,\ldots ,N$
are obtained by beginning at the rightmost region,
 $\unicode[STIX]{x1D6FA}_{N}$
, then recursively appending the next region to the left and applying similar equations to (3.4) for region
 $\unicode[STIX]{x1D6FA}_{p,q}$
with
 $\unicode[STIX]{x1D6FA}_{p-1}$
appended to its left-hand side.
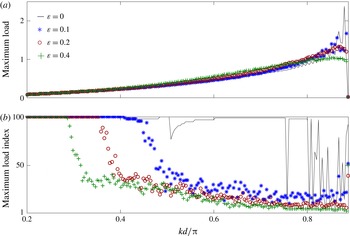
(a) As in figure 2 but for a Rayleigh–Bloch ambient incident wave. (b) Corresponding indices of the cylinders experiencing the maximum loads.

The sampled amplitude functions throughout the array are obtained from the reflection and transmission matrices via
 $$\begin{eqnarray}\hat{\boldsymbol{b}}_{+}^{(n)}=\left(\unicode[STIX]{x1D644}-\hat{\unicode[STIX]{x1D64D}}_{+}^{(1,n)}\hat{\unicode[STIX]{x1D64D}}_{-}^{(n+1,N)}\right)^{-1}\left(\hat{\unicode[STIX]{x1D64F}}_{-}^{(1,n)}\hat{\boldsymbol{a}}_{-}^{(1)}+\hat{\unicode[STIX]{x1D64D}}_{+}^{(1,n)}\hat{\unicode[STIX]{x1D64F}}_{+}^{(n+1,N)}\hat{\boldsymbol{a}}_{+}^{(N)}\right)\end{eqnarray}$$
and
 $$\begin{eqnarray}\hat{\boldsymbol{a}}_{+}^{(n)}=\left(\unicode[STIX]{x1D644}-\hat{\unicode[STIX]{x1D64D}}_{-}^{(n+1,N)}\hat{\unicode[STIX]{x1D64D}}_{+}^{(1,n)}\right)^{-1}\left(\hat{\unicode[STIX]{x1D64D}}_{-}^{(n+1,N)}\hat{\unicode[STIX]{x1D64F}}_{-}^{(1,n)}\hat{\boldsymbol{a}}_{-}^{(1)}+\hat{\unicode[STIX]{x1D64F}}_{+}^{(n+1,N)}\hat{\boldsymbol{a}}_{+}^{(N)}\right)\end{eqnarray}$$
for
 $n=1,\ldots ,N-1$
. The vectors
 $\hat{\boldsymbol{a}}_{-}^{(1)}$
and
 $\hat{\boldsymbol{a}}_{+}^{(N)}$
are, respectively, the sampled directional spectra for the prescribed rightward and leftward propagating/decaying components of the ambient incident wave field,
 $\hat{A}_{am-}=\hat{A}_{-}^{(1)}$
and
 $\hat{A}_{am+}=\hat{A}_{+}^{(N)}$
, defined via
 $$\begin{eqnarray}\unicode[STIX]{x1D719}_{am}=\int _{\unicode[STIX]{x1D6E4}_{-}}\hat{A}_{am-}(\unicode[STIX]{x1D712})\hat{\unicode[STIX]{x1D711}}_{-}^{(1)}(x,y:\unicode[STIX]{x1D712})\,\text{d}\unicode[STIX]{x1D712}+\int _{\unicode[STIX]{x1D6E4}_{+}}\hat{A}_{am+}(\unicode[STIX]{x1D712})\hat{\unicode[STIX]{x1D711}}_{+}^{(N)}(x,y:\unicode[STIX]{x1D712})\,\text{d}\unicode[STIX]{x1D712},\end{eqnarray}$$
where
 $\hat{\unicode[STIX]{x1D711}}_{-}^{(1)}$
and
 $\hat{\unicode[STIX]{x1D711}}_{+}^{(N)}$
are the phase-shifted plane-wave potentials defined below (2.13) for subregions
 $\unicode[STIX]{x1D6FA}_{1}$
and
 $\unicode[STIX]{x1D6FA}_{N}$
, respectively. Bennetts & Squire (Reference Bennetts and Squire2009) originally presented equivalent expressions to (3.7) for a problem involving multiple rows of floating bodies. Calculation of the amplitude functions completes the solution process.
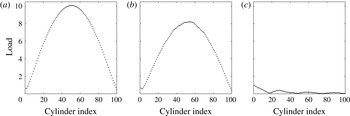
Example realisations of load profiles on 100-cylinder arrays for
 $a/d=0.25$
,
 $kd/\unicode[STIX]{x03C0}\approx 0.88535$
, and (a) no perturbation, (b) perturbation strength
 $\unicode[STIX]{x1D700}=0.01$
, and (c)
 $\unicode[STIX]{x1D700}=0.2$
.

3.2 Numerical results
To simplify the analysis, the ambient incident wave field is set to be the rightward-propagating Rayleigh–Bloch mode, i.e.
 $\hat{A}_{am-}=v_{\unicode[STIX]{x1D6FD}_{0}d+}$
and
 $\hat{A}_{am+}=0$
. Figure 6(a) shows the maximum (normalised) load on a 100-cylinder array computed from (1.1), as a function of frequency,
 $kd/\unicode[STIX]{x03C0}$
, for different perturbation strengths,
 $\unicode[STIX]{x1D700}$
. It is equivalent to figure 2 for the Rayleigh–Bloch incident wave rather than the plane incident wave, with the frequency range truncated due to the cutoff at
 $kd/\unicode[STIX]{x03C0}\approx 0.88574$
. For frequencies immediately beyond the cutoff, the Rayleigh–Bloch wavenumbers become complex and the Rayleigh–Bloch wave decays along the array (as identified by Thompson et al.
Reference Thompson, Linton and Porter2008).
For the unperturbed problem, the Rayleigh–Bloch incident wave excites a resonance at the same frequency as the plane incident wave,
 $kd/\unicode[STIX]{x03C0}\approx 0.88535$
, preceded by a series of maxima and minima. This is expected, as these features are caused by interactions between rightward- and leftward-propagating Rayleigh–Bloch waves (as explained in § 1, cf. Thompson et al.
Reference Thompson, Linton and Porter2008). Moreover, in an identical fashion to the plane-wave case, perturbations damp the resonance for the Rayleigh–Bloch incident wave field.
Figure 6(b) shows the index of the cylinder at which the maximum load is attained, as a function of frequency and for the different perturbation strengths. For low frequencies, the maximum is attained at the farthest cylinder from the source of the incident wave field (the right-hand end of the array,
 $n=100$
), due to cylinders refracting the rightward-propagating incident wave energy in towards the array (Maniar & Newman Reference Maniar and Newman1997). This low-frequency behaviour is consistent for the different perturbation strengths, as the perturbations are small in comparison to the wavelength,
 $2\unicode[STIX]{x03C0}/k$
, in this regime. For the unperturbed array, the maximum load is attained at the right-hand end of the array up to
 $kd/\unicode[STIX]{x03C0}\approx 0.4{-}0.5$
. As the frequency increases beyond this limit, the location of the maximum begins to jump around erratically, as it moves between different local maxima of comparable magnitudes along the array. For the perturbed arrays, the maximum load departs the right-hand end of the array for lower frequencies than the unperturbed array, with the departure frequency decreasing as the perturbation strength increases. The location of the maximum then transitions relatively smoothly towards the front cylinder (left-hand end of the array,
 $n=1$
), as frequency increases.
Figure 7 shows example profiles of the loads on the array at the resonant frequency
 $kd/\unicode[STIX]{x03C0}\approx 0.88535$
. It shows the profile for the unperturbed array and for two random realisations of the perturbed array, for perturbation strengths
 $\unicode[STIX]{x1D700}=0.01$
and 0.2. The profile for the unperturbed array is qualitatively identical to that presented by Maniar & Newman (Reference Maniar and Newman1997) for a plane incident wave – it is an approximately symmetric hump, with the maximum load attained at the centre (
 $n=51$
), due to coherence between strongly excited rightward- and leftward-propagating Rayleigh–Bloch modes (Thompson et al.
Reference Thompson, Linton and Porter2008). The weak perturbation (
 $\unicode[STIX]{x1D700}=0.01$
) preserves the near symmetry but slightly shortens the length of the resonant hump and damps the maximum load. The strong perturbation (
 $\unicode[STIX]{x1D700}=0.2$
) fundamentally changes the qualitative properties of the profile, eliminating symmetry and resonance altogether. The profile attenuates from the front of the array to the rear, with accompanying oscillations, indicating a localised state has been reached.
4 Localisation of Rayleigh–Bloch waves
4.1 Perturbed Rayleigh–Bloch wavenumber calculation
For the unperturbed array forced by a Rayleigh–Bloch ambient incident wave, the wave field along the array is dominated by rightward- and leftward-propagating Rayleigh–Bloch modes. For a perturbed array, it is hypothesised that, similarly, the wave field is dominated by perturbed Rayleigh–Bloch modes, with complex-valued wavenumbers
 $\unicode[STIX]{x1D6FD}_{+}(\unicode[STIX]{x1D700})\in \mathbb{R}_{+}+\text{i}\mathbb{R}_{+}$
for the rightward-propagating mode and
 $\unicode[STIX]{x1D6FD}_{-}(\unicode[STIX]{x1D700})\in \mathbb{R}_{-}+\text{i}\mathbb{R}_{-}$
for the leftward-propagating mode. It is expected that
 $\unicode[STIX]{x1D6FD}_{-}\approx -\unicode[STIX]{x1D6FD}_{+}$
, on average at least, due to symmetry of the perturbations, and for the unperturbed array
 $\unicode[STIX]{x1D6FD}_{\pm }(0)=\pm \unicode[STIX]{x1D6FD}_{0}$
. The change in the real parts of the wavenumbers, with respect to the unperturbed Rayleigh–Bloch wavenumbers, induces phase shifts in the modes, and the introduction of imaginary components produces attenuation of the modes, resulting in localisation for sufficiently large attenuation rates.
The perturbed wavenumbers,
 $\unicode[STIX]{x1D6FD}_{\pm }$
, are extracted from wave fields for the perturbed arrays, using a version of an approach proposed by Bennetts & Peter (Reference Bennetts and Peter2013). For each realisation of the perturbed array, the wave fields are calculated for
-
(i) a rightward-propagating Rayleigh–Bloch incident wave (
 $\hat{A}_{am-}=v_{\unicode[STIX]{x1D6FD}_{0}d+}$
and
$\hat{A}_{am+}=0$
, as in § 3),
-
(ii) and a leftward-propagating Rayleigh–Bloch incident wave (
$\hat{A}_{am-}=0$
and
$\hat{A}_{am+}=v_{-\unicode[STIX]{x1D6FD}_{0}d-}=v_{\unicode[STIX]{x1D6FD}_{0}d+}$
),



where
 $v_{-\unicode[STIX]{x1D6FD}_{0}d-}$
is the component of the eigenfunction associated with
 $-\unicode[STIX]{x1D6FD}_{0}$
that propagates/decays leftwards, and
 $v_{\unicode[STIX]{x1D6FD}_{0}d+}$
is defined in § 2.3.
The rightward- and leftward-propagating directional amplitude functions along the array for these wave fields are denoted
 $$\begin{eqnarray}\unicode[STIX]{x1D709}_{\unicode[STIX]{x1D6FD}_{\pm }d}^{(n)}=\hat{B}_{+}^{(n-1)}\quad \text{and}\quad \unicode[STIX]{x1D701}_{\unicode[STIX]{x1D6FD}_{\pm }d}^{(n)}=\hat{B}_{-}^{(n)}\end{eqnarray}$$
for
 $n=1,\ldots ,N+1$
, respectively, where the undefined amplitude functions at the boundaries of the array are replaced by the equivalent functions of the ambient incident wave fields,
 $$\begin{eqnarray}\hat{B}_{+}^{(0)}\equiv \hat{A}_{am-}\quad \text{and}\quad \hat{B}_{-}^{(N+1)}\equiv \hat{A}_{am+}.\end{eqnarray}$$
The hypothesis that the wave fields are dominated by perturbed Rayleigh–Bloch modes is translated into the ansatzes
 $$\begin{eqnarray}\displaystyle \unicode[STIX]{x1D709}_{\unicode[STIX]{x1D6FD}_{\pm }d}^{(n)} & {\approx} & \displaystyle a_{\pm }^{(\unicode[STIX]{x1D709})}\text{e}^{\text{i}\unicode[STIX]{x1D6FD}_{+}dn}v_{\unicode[STIX]{x1D6FD}_{+}d+}+b_{\pm }^{(\unicode[STIX]{x1D709})}\text{e}^{\text{i}\unicode[STIX]{x1D6FD}_{-}d(N+1-n)}v_{\unicode[STIX]{x1D6FD}_{-}d+}\end{eqnarray}$$
 $$\begin{eqnarray}\displaystyle \text{and}\quad \unicode[STIX]{x1D701}_{\unicode[STIX]{x1D6FD}_{\pm }d}^{(n)} & {\approx} & \displaystyle a_{\pm }^{(\unicode[STIX]{x1D701})}\text{e}^{\text{i}\unicode[STIX]{x1D6FD}_{+}dn}v_{\unicode[STIX]{x1D6FD}_{+}d-}+b_{\pm }^{(\unicode[STIX]{x1D701})}\text{e}^{\text{i}\unicode[STIX]{x1D6FD}_{-}d(N+1-n)}v_{\unicode[STIX]{x1D6FD}_{-}d-},\end{eqnarray}$$
 $a_{\pm }^{(\bullet )}(\unicode[STIX]{x1D700})$
and
 $b_{\pm }^{(\bullet )}(\unicode[STIX]{x1D700})$
are coefficients/amplitudes,
 $v_{\unicode[STIX]{x1D6FD}_{\pm }d+}$
is the component of the eigenfunction associated with
 $\unicode[STIX]{x1D6FD}_{\pm }$
that propagates/decays rightwards, and
 $v_{\unicode[STIX]{x1D6FD}_{\pm }d-}$
is the component propagating/decaying leftwards.
Ansatzes (4.3a–b ) are combined, as in Bennetts & Peter (Reference Bennetts and Peter2013), to produce the expression
 $$\begin{eqnarray}\text{eig}(\unicode[STIX]{x1D648}^{(n)})=\{\text{e}^{\text{i}\unicode[STIX]{x1D6FD}_{+}dn},\text{e}^{\text{i}\unicode[STIX]{x1D6FD}_{-}dn}\}\quad \text{for}~n=1,\ldots ,N,\end{eqnarray}$$
where
 $$\begin{eqnarray}\unicode[STIX]{x1D648}^{(n)}=\unicode[STIX]{x1D648}^{(n,N+1)}\text{inv}(\unicode[STIX]{x1D648}^{(1,N+2-n)}),\quad \unicode[STIX]{x1D648}^{(p,q)}=\left(\begin{array}{@{}cc@{}}\unicode[STIX]{x1D709}_{\unicode[STIX]{x1D6FD}_{+}d}^{(p)}(0) & \unicode[STIX]{x1D709}_{\unicode[STIX]{x1D6FD}_{-}d}^{(q)}(0)\\ \unicode[STIX]{x1D701}_{\unicode[STIX]{x1D6FD}_{+}d}^{(p)}(0) & \unicode[STIX]{x1D701}_{\unicode[STIX]{x1D6FD}_{-}d}^{(q)}(0)\end{array}\right),\end{eqnarray}$$
and
 $\text{eig}(\bullet )$
denotes the set of eigenvalues of the included matrix. The values of the amplitude functions corresponding to wave components propagating parallel to the
 $x$
-axis only are used because the ansatzes essentially reduce the problem to a single dimension.
Eigenvalues of matrix
 $\unicode[STIX]{x1D648}^{(n)}$
, given in (4.4), corresponding to rightward-propagating (a,b) and leftward-propagating (c,d) Rayleigh–Bloch modes for
 $a/d=0.25$
,
 $kd/\unicode[STIX]{x03C0}\approx 0.88535$
and
 $\unicode[STIX]{x1D700}=0.2$
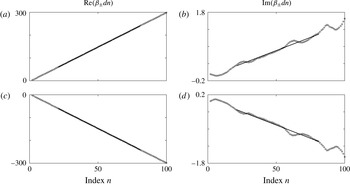
. (a,c) Real parts of the natural logarithms of the modes (phases) and (b,d) imaginary parts (attenuation), calculated as means of an ensemble of 500 simulations (○). Straight-line fits (–) used to extract the Rayleigh–Bloch wavenumbers are overlaid.

Figure 8 shows an example of natural logarithms of eigenvalues of the matrix
 $\unicode[STIX]{x1D648}^{(n)}$
, as a function of cylinder index
 $n$
, for a 100-cylinder array with perturbation strength
 $\unicode[STIX]{x1D700}=0.2$
at the resonant frequency for the unperturbed array,
 $kd/\unicode[STIX]{x03C0}\approx 0.88535$
. The eigenvalues are separated into real and imaginary parts (a,c and b,d, respectively), and those corresponding to
 $\unicode[STIX]{x1D6FD}_{+}$
and
 $\unicode[STIX]{x1D6FD}_{-}$
(a,b and c,d, respectively). The results are the means of ensembles of 500 randomly generated realisations of the perturbations.
The log-eigenvalue profiles are approximately linear – noise is visible in the imaginary parts but not in the real parts, which are dominated by the eigenvalues of the underlying unperturbed array. Straight-line fits are overlaid on the profiles, from which the non-dimensional Rayleigh–Bloch wavenumbers,
 $\unicode[STIX]{x1D6FD}_{\pm }d$
, are extracted as the slopes. The fits are made to the interior of the profiles only to avoid contamination by local effects of the array ends, just visible in the imaginary parts. The extracted Rayleigh–Bloch wavenumbers display the expected symmetry (to three decimal places), with
 $\unicode[STIX]{x1D6FD}_{+}d\approx 3.02058+0.01536\text{i}$
and
 $\unicode[STIX]{x1D6FD}_{-}d\approx -3.02055-0.01548\text{i}$
.
Extracting array wavenumbers (in this case Rayleigh–Bloch wave numbers) from mean log-eigenvalue profiles is more stable than Bennetts & Peter (Reference Bennetts and Peter2013)’s method of extracting array wavenumbers from log-eigenvalue profiles of individual realisations and then averaging. The Rayleigh–Bloch wavenumbers are not those of the effective (mean) wave field, as the amplitudes and phases are separated prior to averaging.
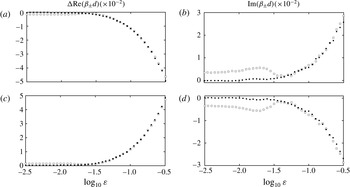
(a,c) Phase changes of perturbed Rayleigh–Bloch wavenumbers relative to the unperturbed wavenumbers, as functions of disorder strength for
 $a/d=0.25$
and
 $kd/\unicode[STIX]{x03C0}\approx 0.88535$
. (b,d) Corresponding attenuation rates. (a,b) Results for the rightward-propagating/attenuating Rayleigh–Bloch mode, and (c,d) results for the leftward-propagating/attenuating mode. Results are calculated using a 100-cylinder array (▫) and a 200-cylinder array (▪).

4.2 Numerical results
Figure 9 shows the extracted wavenumbers as functions of perturbation strength for the resonant frequency, and using ensembles of 100 realisations for each perturbation strength. The real parts (phases) are shown as relative deviations from the Rayleigh–Bloch wavenumbers of the unperturbed array,
 $$\begin{eqnarray}\unicode[STIX]{x1D6E5}\text{Re}(\unicode[STIX]{x1D6FD}_{\pm }d)=\frac{\text{Re}(\unicode[STIX]{x1D6FD}_{\pm }d)\mp \unicode[STIX]{x1D6FD}_{0}d}{\unicode[STIX]{x1D6FD}_{0}d},\end{eqnarray}$$
in (a,c), with the imaginary parts (attenuation rates) shown in (b,d). Wavenumbers supporting rightward-propagating/attenuating modes are shown in (a,b), with those for the leftward-propagating/attenuating modes in (c,d). Results are shown for 100- and 200-cylinder arrays.
The results again show the expected symmetry
 $\unicode[STIX]{x1D6FD}_{-}\approx -\unicode[STIX]{x1D6FD}_{+}$
. The phase changes are similar for the 100- and 200-cylinder arrays, indicating that the real parts of the Rayleigh–Bloch wavenumbers do not depend on array length (beyond
 $N=100$
, at least). Deviations between the phases for the two array lengths are evident for weak perturbations, approximately
 $\log _{10}\unicode[STIX]{x1D700}<-1.5\;(\unicode[STIX]{x1D700}<0.03162)$
, with the phase changes approximately zero in this regime for the 200-cylinder arrays, i.e.
 $\unicode[STIX]{x1D6FD}_{\pm }(\unicode[STIX]{x1D700})\approx \pm \unicode[STIX]{x1D6FD}_{0}$
for
 $\unicode[STIX]{x1D700}\ll 1$
as expected, but being a small finite value for the 100-cylinder array. The errors for the 100-cylinder array are due to 100 cylinders not providing an interval long enough to average out the presence of oscillations caused by the circular wave fields generated at the array ends, which compromise the validity of ansatzes (4.3). Stronger perturbations,
 $\log _{10}\unicode[STIX]{x1D700}>-1.5$
, clearly reduce the modulus of the phase of the Rayleigh–Bloch wavenumbers, with the reduction steadily increasing as the perturbation strength increases.
In the weak-perturbation regime,
 $\log _{10}\unicode[STIX]{x1D700}<-1.5$
, deviations between the two array lengths are exacerbated for the attenuation rates, as the attenuation is negligible so that the oscillations caused by the circular wave fields dominate the imaginary-component profiles. The 200-cylinder array provides attenuation rates that are approximately zero for very weak perturbations, approximately
 $\log _{10}\unicode[STIX]{x1D700}<-2\;(\unicode[STIX]{x1D700}<0.01)$
, as expected, whereas attenuation rates for the 100-cylinder array are visibly non-zero in this regime. For stronger perturbations,
 $\log _{10}\unicode[STIX]{x1D700}>-1.5$
, the moduli of the attenuation rates increase with increasing perturbation strength and the attenuation rates for the 100-cylinder array rapidly transition to agreement with those of the 200-cylinder array. This marks the regime in which attenuation dominates the profiles of the imaginary components of the eigenvalues of
 $\unicode[STIX]{x1D648}^{(n)}$
.
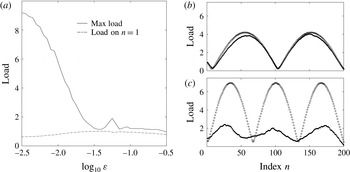
(a) Maximum load (–) and load on the first cylinder (– - –), caused by a rightward-propagating Rayleigh–Bloch ambient incident wave on a 200-cylinder array for
 $a/d=0.25$
and
 $kd/\unicode[STIX]{x03C0}\approx 0.88535$
, as functions of disorder. (b) A corresponding load-profile realisation for
 $\log _{10}\unicode[STIX]{x1D700}=-2$
(●), and the profile for the unperturbed problem with
 $kd/\unicode[STIX]{x03C0}\approx 0.88532$
(○). (c) As in (b) but for
 $\log _{10}\unicode[STIX]{x1D700}=-1.25$
(●) and
 $kd/\unicode[STIX]{x03C0}\approx 0.88487$
(○).

Figure 10(a) shows the corresponding maximum load on the 200-cylinder array produced by a rightward-propagating Rayleigh–Bloch ambient incident wave field and the load on the front cylinder (
 $n=1$
), as functions of perturbation strength. The resonance in the maximum load for the unperturbed 200-cylinder array at
 $kd/\unicode[STIX]{x03C0}\approx 0.88535$
manifests as two symmetric humps in the load profile, where each hump is almost identical to that shown in figure 7(a) for the 100-cylinder array. (A stronger, single-hump resonance for the 200-cylinder array, analogous to that shown by figure 7(a) for the 100-cylinder array, is obtained at a slightly higher frequency.)
For weak perturbations,
 $\log _{10}\unicode[STIX]{x1D700}<-1.5$
, resonance in the maximum load is damped, as indicated in figure 7(b) for the 100-cylinder array, with the damping gradually increasing as the perturbation strength increases. Figure 10(b) shows an individual load profile in the weak-perturbation regime, with
 $\log _{10}\unicode[STIX]{x1D700}=-2$
, for which
 $\unicode[STIX]{x1D6FD}_{\pm }d\approx \pm 3.109\pm 0.000\text{i}$
. The profile is similar to the two-hump resonant profile occurring for the unperturbed array at this frequency, but with the resonances damped and the hump lengths reduced. The load profile for the unperturbed array with frequency
 $kd/\unicode[STIX]{x03C0}\approx 0.88532$
, for which
 $\unicode[STIX]{x1D6FD}_{0}d\approx 3.109$
, is superimposed on the panel. It is almost identical to the profile for the perturbed array, indicating that a weakly perturbed array acts like an unperturbed array with a slightly shortened cylinder spacing and/or to slightly shifted forcing. (A similar profile can be obtained at the resonant frequency by increasing the number of cylinders in the unperturbed array to
 $N=204$
. Alternatively, reducing the perturbed array to
 $N=196$
cylinders produces a profile approximating the two-hump resonance for the unperturbed array with
 $N=200$
.)
For stronger perturbations,
 $\log _{10}\unicode[STIX]{x1D700}>-1.5$
, the maximum load is approximately equal to the load on the front cylinder, as the attenuation rates are, in general, sufficiently large to produce localised states, as shown in figure 7(c) for the 100-cylinder array. A weak resonance in the maximum load around
 $\log _{10}\unicode[STIX]{x1D700}=-1.25\;(\unicode[STIX]{x1D700}\approx 0.05623)$
causes it to deviate away from the load on the front cylinder. Figure 10(c) shows an individual load profile for
 $\log _{10}\unicode[STIX]{x1D700}=-1.25$
, for which
 $\unicode[STIX]{x1D6FD}_{\pm }\approx \pm 3.094\pm 0.003\text{i}$
, with the load profile for the unperturbed array at frequency
 $kd/\unicode[STIX]{x03C0}\approx 0.88487$
superimposed, for which
 $\unicode[STIX]{x1D6FD}_{0}\approx 3.094$
. The profile for the unperturbed array is resonant, as indicated by the three humps and the symmetry of the profile, although it is a weaker resonance than the two-hump resonance at
 $kd/\unicode[STIX]{x03C0}\approx 0.88535$
. The three humps are visible in the profile for the perturbed array, driving the resonance in the maximum load around
 $\log _{10}\unicode[STIX]{x1D700}=-1.25$
. However, attenuation produced by the imaginary component of the Rayleigh–Bloch wavenumber significantly reduces the hump peaks, so that the resonance is weak.
5 Summary and conclusions
A solution method has been presented for water-wave interactions with line arrays of rigid, bottom-mounted, surface-piercing cylinders, in which the wave field excited by an ambient incident wave is calculated recursively. The directional scattering kernels for a solitary cylinder, used in the method, identify the Rayleigh–Bloch modes responsible for causing resonant loads in the interior of the array. It was shown that Rayleigh–Bloch modes can be used as the ambient incident wave field to excite the resonant loads, considerably simplifying the analysis.
The method readily permits perturbations to be introduced into the array. It was shown that perturbations in the positions of the cylinders damp the resonant loads. Perturbation strengths
 $\unicode[STIX]{x1D700}=O(0.01)$
(i.e. of order 1 % of the cylinder spacing) were shown to damp the resonance weakly. These perturbations produce small phase shifts in the load profiles along the arrays, meaning the arrays respond in a similar fashion to an unperturbed array with slightly smaller cylinder spacings. Perturbation strengths
 $\unicode[STIX]{x1D700}=O(0.1)$
strongly damp the resonance, resulting in the maximum load occurring close to the front of the array, with the loads generally diminishing with distance along the array.
The strong damping was associated with the localisation phenomenon. Perturbed Rayleigh–Bloch wavenumbers were calculated for the perturbed arrays by combining wave fields excited by unperturbed Rayleigh–Bloch incident fields, for ensembles of randomly generated realisations of the perturbations. For perturbation strengths
 $\unicode[STIX]{x1D700}=O(0.01)$
, the perturbed Rayleigh–Bloch wavenumbers remain approximately real, relating to the phase shifts in the load profiles, and the weak damping of resonances. Perturbation strengths
 $\unicode[STIX]{x1D700}=O(0.1)$
produce imaginary components of appreciable magnitudes in the perturbed Rayleigh–Bloch wavenumbers, attenuating the corresponding modes as they propagate along the arrays, so that the maximum load is attained close to the front of the array, and resulting in localisation if the attenuation rates are sufficiently large with respect to the array length.
It would be difficult to confirm the localisation predicted here experimentally, as it would have to be disentangled from the dissipative mechanisms inevitable in water-wave problems. For instance, the attenuation of the wave profile along the array found by Kagemoto et al. (Reference Kagemoto, Murai, Saito, Molin and Malenica2002), which they attributed to viscous dissipation, is, superficially, similar to attenuation signalling localisation. Although it is clearly not a localisation effect in this case (e.g. positional inaccuracies equivalent to perturbation strengths
 $\unicode[STIX]{x1D700}<0.006$
are reported), viscous dissipation would still play a role for stronger perturbations. Analogous issues are inherent in many other phenomena where localisation is predicted (see the discussion in Weaver Reference Weaver1990).
Acknowledgements
The Australian Research Council funds an early career research fellowship for L.G.B. (DE130101571). The US Office of Naval Research funds a postdoctoral fellowship for F.M. (award no. N00014-131-0279). The University of Adelaide hosted M.A.P. for a sabbatical, during which this work was accomplished. L.G.B. and M.A.P. acknowledge useful discussions with R. Porter regarding Rayleigh–Bloch waves.