



Introduction
With increased demand of Internet of Things (IoT) and the advent of 5th generation (5G) of mobile communication, more number of electronic devices communicate with each other wirelessly [Reference Birwal, Singh, Kanaujia and Kumar1]. This will not only overload the existing wireless networks, but also generate new wireless traffic. In view of this, electromagnetic (EM) radiation coming out from these wireless networks or electronic devices becomes a critical challenge and give rise to other problems such as electromagnetic interference and compatibility between these devices. These EM waves not only affect devices, but also have many severe health effects on human beings [Reference Hwang, Kang, Kwon and Park2], as we are in continuous exposure to these waves in both indoor and outdoor environments. To cater such challenges a high-performance EM shield/absorber is required to block all the frequencies around us. In other words, an ultra-wideband (UWB) frequency selective surface (FSS) is required with wide stop-band characteristics. Conventional methods to block EM waves are based on multi-layer approaches and are bulky in nature [Reference Hemming3]. Thus, a single-layer, lightweight surface with wide band-stop is an attractive solution. Such surfaces are popularly known as FSS and widely reported by many researchers in recent past.
In [Reference Ranga, Matekovits, Weily and Esselle4], a double-layer FSS using a combination of square-loop and a cross is proposed to achieve ultra-wide stop-band from 3.85 to 11.23 GHz on an FR4 substrate. Both reported unit cells have square shape geometry with a dimension of 15 mm and a spacing of 9.5 mm between them. In [Reference Kushwaha, Kumar, Ram Krishna and Oli5], a single-side double-layer UWB FSS printed on an FR4 substrate is presented. The unit cell consists of a loop type structure on both sides of substrate and provides a bandwidth of 8 GHz from 2.87 to 10.87 GHz. In [Reference Bashiri, Ghobadi, Nourinia and Majidzadeh6], a novel circular-shaped design printed on both sides of a substrate is reported. The overall rejection bandwidth of this FSS is 6.3–16.3 GHz in both transverse electric (TE) and transverse magnetic (TM) polarized waves. A square-shaped polarization independent of FSS is reported in [Reference Sivasamy, Moorthy, Kanagasabai, George, Lawrance and Rajendran7]; the unit cell is printed on both sides of a substrate and provides a wide bandwidth from 3.87 to 11.4 GHz with angular stability up to 45°. Another most widely used application of FSS is to improve the impedance bandwidth and gain of wideband antenna by placing the FSS below the antenna. For this purpose, a square-shaped unit cell consists of two rectangular metallic strips joined by three narrow metallic lines to provide a bandwidth of 9 GHz (3–12 GHz) presented in [Reference Tahir, Arshad, Ullah and Flint8]. A square slot type FSS of bandwidth 7.2 GHz (3.9–11.10 GHz) reported in [Reference Kushwaha, Kumar and Oli9] is used to enhance the gain of an antenna between 3 and 5 dB where the unit cell is printed on both sides of an FR4 substrate. A multi-layer FSS is proposed in [Reference Xu and He10], which consists of four layers starting from square grid, square patch, square loop, and square slots. All are arranged in a parallel configuration one over the other to achieve wide bandwidth.
The FSS characteristics are mainly dependent on the size and inter-element spacing. Many shapes of different sizes have been designed in recent past. Most of the reported designs are single-, double-, or multi-layer structures to achieve wide bandwidth. Such structure suffers from a problem in integration with conformal applications which requires a single-side printed FSS.
In this paper, an UWB single-layer single-side printed FSS using modification in conventional square loop and cross (CSLC) is proposed. The design is simple, compact, and low profile printed on one side of a low-cost FR4 substrate. The FSS unit cell is designed by modifying all the four quadrants of CSLC and having a dimension of 0.282λ 0 × 0.282λ 0 × 0.026λ 0, where λ 0 is the free-space resonant wavelength. Final optimized design offers up to 45° angular stability for both TE and TM polarizations. Details about the evolution steps of FSS unit cell, parametric study, and equivalent circuit (EC) model are presented and discussed. The designed FSS has found many applications in UWB systems such as shielding [Reference Hashemi and Abdolali11], antenna gain enhancement by reducing back-lobe radiation [Reference Kushwaha and Kumar12], and as high reflection layers [Reference Xi, Long, Shi, Zhu and Chen13].
FSS design
This section explains the unit cell design analysis of the proposed FSS. The FSS is printed on one side of a low-cost FR4 substrate material (ɛr = 4.4 and tan δ = 0.04), with a thickness (h) of 1.6 mm and copper cladding of 35 μm.
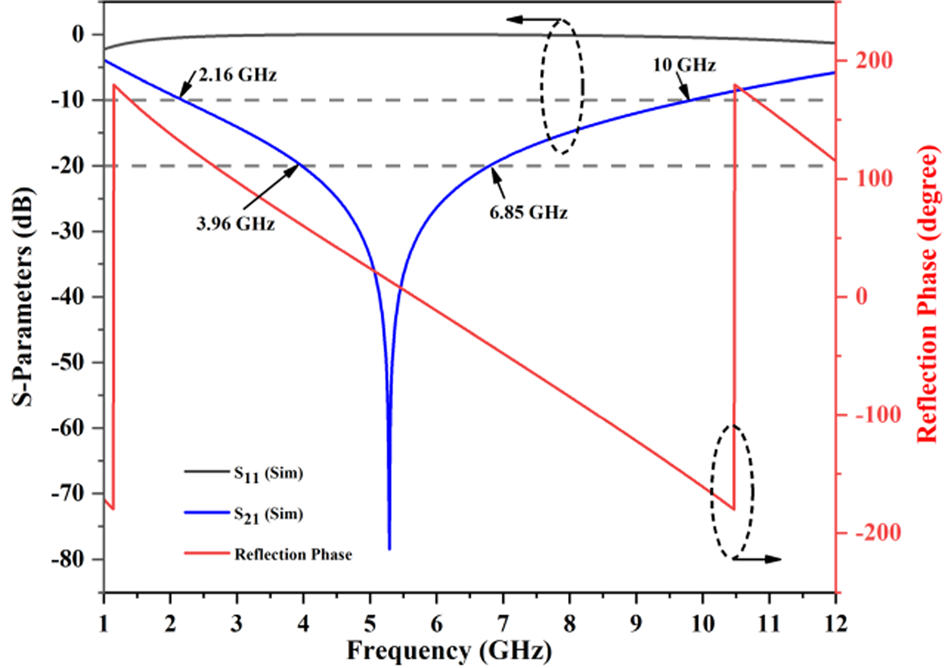
The geometry and three-dimensional (3D) prototype of the proposed FSS along with its geometrical dimensions is given in Figs 1(a) and 1(b). A fabricated prototype on the FR4 board is shown in Fig. 2. To get better understanding of the design procedure, the evolution steps of the unit cell geometry is proposed as shown in Fig. 3. Here the unit cell is excited using a special port available in CST Microwave Studio called floquet port [14], which simulates the incident plane wave toward the unit cell along the z-axis and record the portion of reflected and transmitted waves to measure the S-parameters which is shown in Fig. 4. In step 1, a conventional square loop at a resonance frequency of 2 GHz is designed, whereas in step 2 a cross is designed at 6 GHz, respectively. In step 3, both the structure are combined together to form an enclosed cross type structure whose resonant frequency is in between step 1 and step 2, i.e. 3.17 GHz with a −10 dB stop-bandwidth of 3.25 GHz (1.81–5.06 GHz), which is around 94.61%. Finally, in step 4, additional cross (after introducing 45° tilt) is inserted in all the four quadrants to form the unit cell of the proposed FSS. This arrangement shifts the resonant frequency to 5.28 GHz and improves the bandwidth to 7.84 GHz (2.16–10 GHz), which is 34.33% more than the conventional enclosed cross shown in step 3. The overall structure is equivalent to a wide stop-band filter with unit cell grid represents an equivalent inductor L and spacing among them represents an equivalent capacitor C.
Geometry and 3D prototype of the proposed FSS: (a) geometrical dimensions of unit cell and (b) 3D view of proposed FSS structure. Dimensions: p = 16, d = 15.8, w = 0.5, g = 0.2, and h = 1.5 (all dimensions are in mm).

Fabricated prototype of the proposed FSS on the FR4 board showing the zoom view of four-elements.

Evolution stages of the proposed FSS unit cell: (a) step 1, (b) step 2, (c) step 3, and (d) step 4.

S-parameters during evolution stages of FSS.

In order to realize this band-stop response, the frequency of incident wave must match with the resonance frequency of the filter. Simulation of FSS unit cell obtained in step 4 is carried out using CST Microwave Studio [14] by assuming a periodic boundary condition in both the dimensions i.e. x- and y-axis whereas the z-axis is equipped with floquet port excitation.
The S-parameter characteristic of the unit cell is shown in Fig. 5; it provides a wide stop-band (2.16–10 GHz) with linear reflection phase throughout the operating band. The fractional bandwidth considering −10 and −20 dB threshold is 128.94 and 53.4%, respectively. Here, each frequency component suffers a different phase shift. This property is useful in antenna gain enhancement by redirecting the back-lobe radiation toward the antenna, which then adds up in phase to the main radiation.
S-parameters and reflection phase of FSS.
Equivalent circuit (EC) model of FSS
To analyze the unit cell of the proposed FSS, an EC model has been proposed in Fig. 6, which shows the array of six elements. The metallic grid shown in Fig. 6(a) can be modeled by equivalent inductance (L), whereas the interspacing gap between elements is represented by equivalent capacitance (C) as shown in Fig. 6(c). A band-stop response can be realized using a series combination of L and C, which can be easily analyzed using any circuit simulator. Here, the EC model is analyzed using an open source circuit simulator named Quite Universal Circuit Simulator (QUCS; http://qucs.sourceforge.net/). The extracted values of L and C using this simulator are 0.179 nH and 5 pF, respectively; whereas, capacitors C 1 = 2.2 and C 2 = 5.04 pF control the upper and lower cut-off frequencies. The results show a wideband single resonance at 5.3 GHz.
EC associated with FSS: (a) six element FSS, (b) unit cell of FSS, and (c) EC of unit cell.

It has been observed that the lumped circuit simulation follows the response of full wave EM simulation, and is compared together in Fig. 7.
Comparison of full wave EM simulations with the circuit simulations of the proposed FSS.

Parametric study
This section mainly focuses on various parameters of unit cell and their impact on the transmission characteristics of FSS. The designed FSS is very flexible, where any resonant frequency can be achieved by changing the length of unit cell. As can be seen in Fig. 8, as the size of square loop “p” is varied from 14 to 18 mm, resonance starts to shift toward lower side i.e. from 6.66 to 4.48 GHz.
Transmission response for different values of parameter “p.”

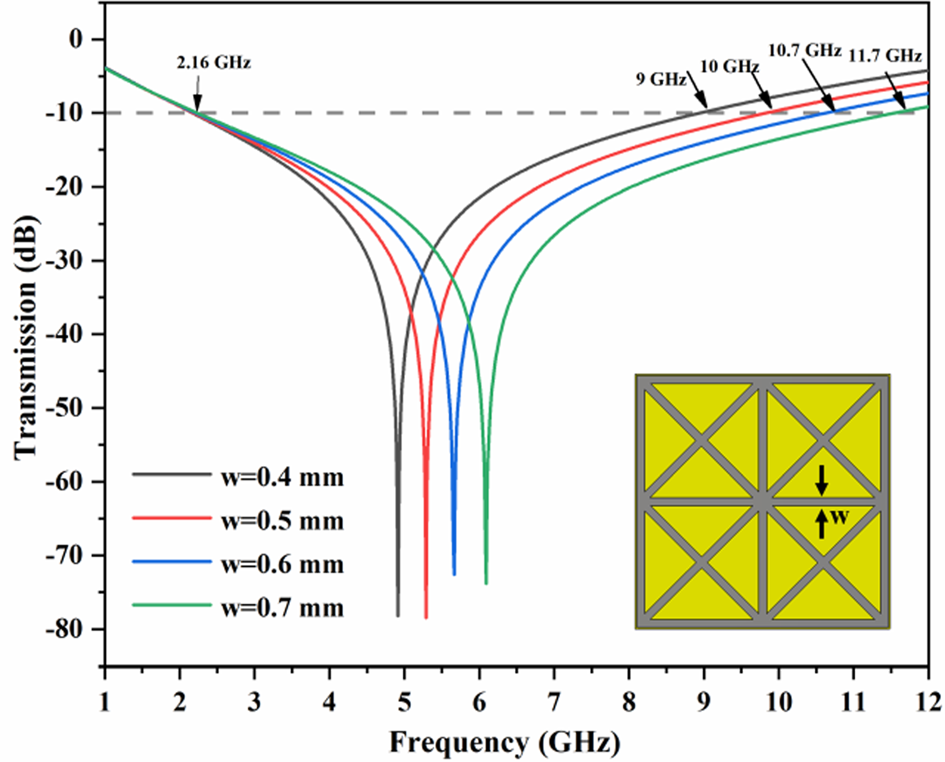
Figure 9 shows a parametric study of width “w” on the transmission characteristic of FSS. It has been found that the width has an impact on the bandwidth response of FSS. As the width “w” is increased from 0.4 to 0.7 mm in the step of 0.1 mm, the bandwidth also increased proportionally. This could be due to the improvement in coupling between elements as we increase the metal width “w.”
Transmission response for different values of parameter “w.”
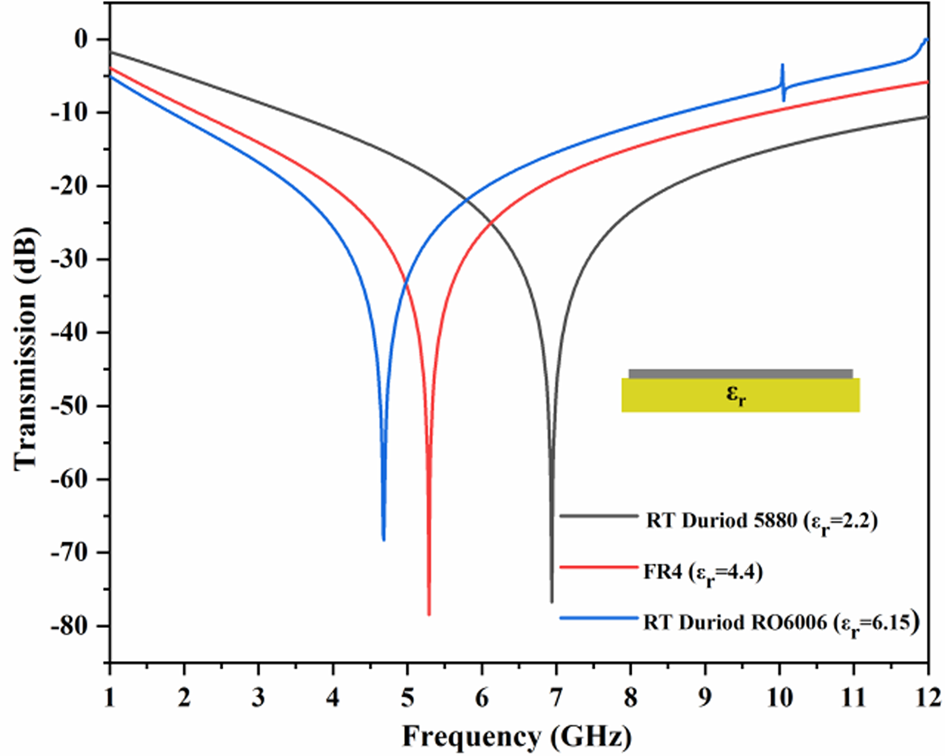
Another important parameter which impacts the performance of FSS is the substrate permittivity (ɛr). Transmission response under different substrate permittivities, such as RT Duriod 5880 (ɛr = 2.2), FR4 (ɛr = 4.4), and RT Duriod RO 6006 (ɛr = 6.15) is plotted in Fig. 10. It can be seen from the graph that by increasing the substrate permittivity (ɛr) the resonant frequency shifts toward lower side due to its inverse relationship with ɛr.
Transmission response for different values of substrate permittivity (ɛr).
Another important evaluation that has been carried out in this research paper is the effect of inductive mesh on the transmission response of the proposed FSS. As can be seen from Fig. 11, that many designs have been simulated by placing different geometries in all the four quadrants of CSLC. In the first iteration, each quadrant is filled with only single cross geometry as shown in Figs 11(a)–11(c). It has been noticed that the resonance frequency and bandwidth remain unchanged. In the second iteration, each quadrant is filled with two crosses with a 45° shift between them as shown in Fig. 11(d), thus making a denser inductive grid network. This shifts the resonance frequency toward higher side and increase the bandwidth to 11.97 GHz (2.16−14.13 GHz). In the third and final iterations, this inductive grid is further increased by first inserting a cross in four quadrants, which creates further four quadrants i.e. 16 slots, these are again filled with cross of smaller size as shown in Fig. 11(e), thus making a denser grid. This arrangement shifts the resonance frequency toward higher side and improves the bandwidth to 14.46 GHz (2.16–16.62 GHz). It is concluded that −10 dB fractional bandwidth is increased to 154% in the third iteration, which is 6.43% more compared to second iteration and 24.45% more compared to the first iteration i.e. the proposed FSS.
Comparison of transmission response from low mesh to high mesh.

Polarization and angular stability analysis
Another important aspect of FSS structure is analyzed when the unit cell is exposed to EM wave of different polarizations and incident angles. In view of this condition, an FSS should provide a stable response without being affected by any external or environmental disturbances [Reference Simovski, de Maagt and Melchakova15]. To understand this angular stability effect, both TE and TM polarizations were studied under different θ and φ incidence, varying from 0 to 45° in steps of 15°. Figures 12(a) and 12(b) show the simulated TE and TM polarizations for different incident angles θ keeping polarization angle φ = 0°. As can be seen from Fig. 12(a) that for θ angles beyond 15°, minor deviation in resonance frequency is observed, whereas a better stability is observed for φ angle variation as shown in Figs 13(a) and 13(b). Therefore, it can be concluded that a stable response is provided by FSS in both polarizations. The resonance frequency and wide stop-band are almost remain same for both θ and φ incidence, which makes this FSS a suitable candidate for communication systems (https://en.wikipedia.org/wiki/5G_NR_frequency_bands#Frequency_Range_1).
Simulated transmission characteristics (S 21) for different incident angles θ (φ = 0°): (a) TE mode and (b) TM mode.
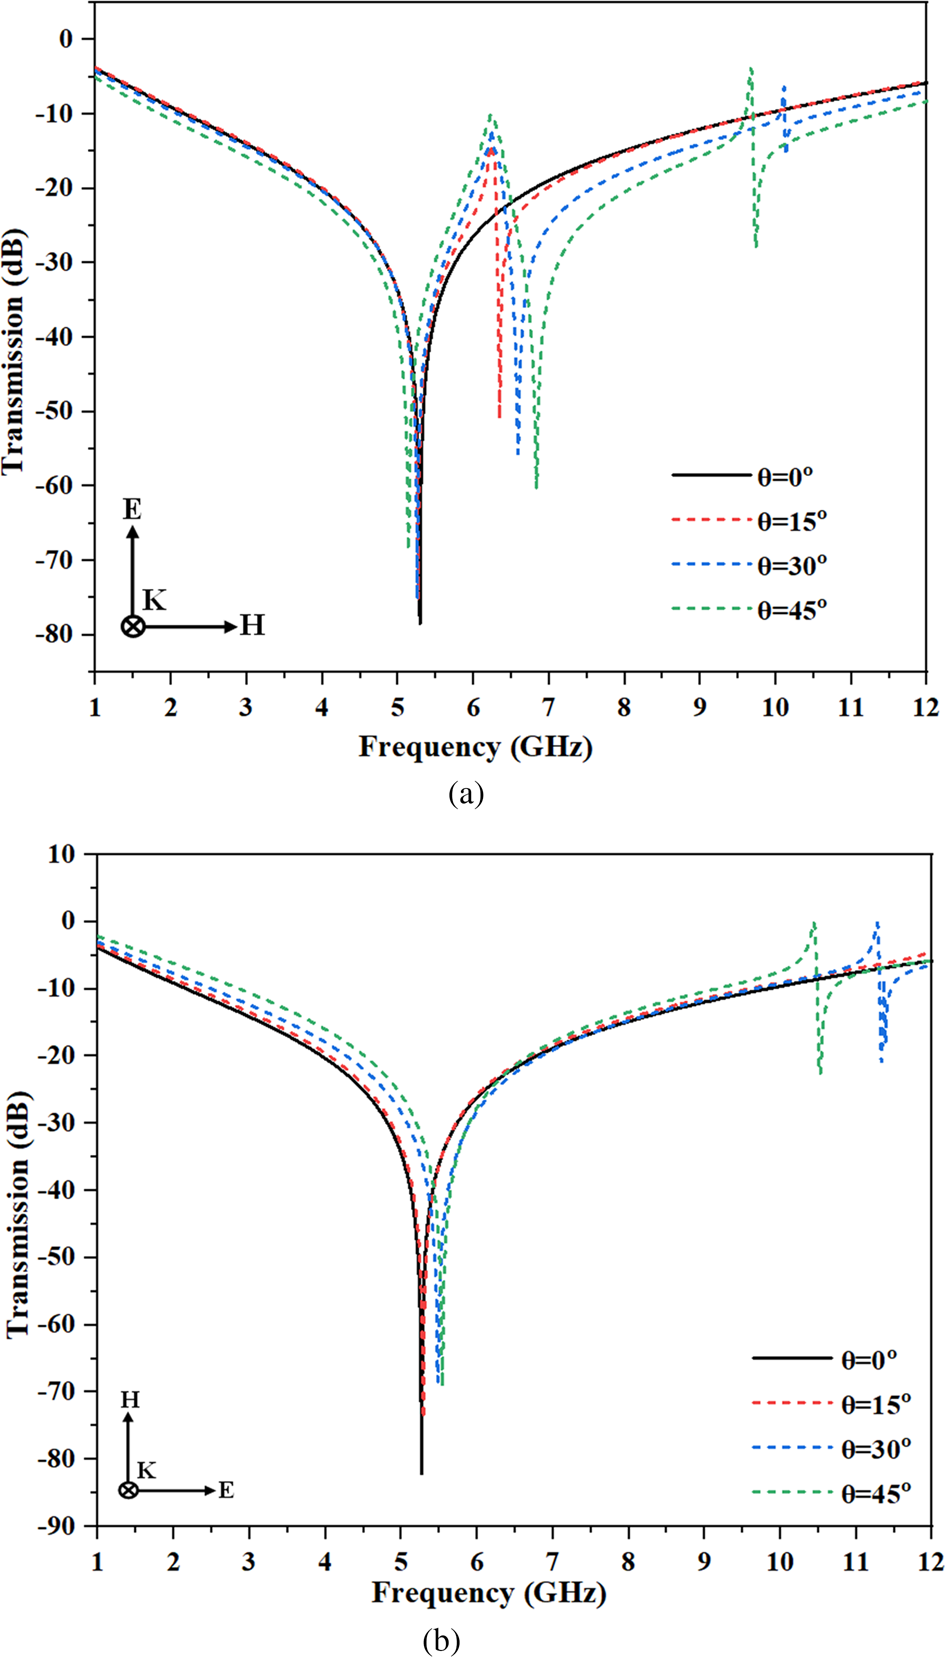
Simulated transmission characteristics (S 21) for different incident angles φ (θ = 0°): (a) TE mode and (b) TM mode.

To discuss about the novelty, compactness, and advantages of the proposed FSS with other previously reported design, a comparative study is shown in Table 1. Here the comparison is carried out based on the dimension of unit cell, architecture (single or double layer), −10 dB fractional/wide stop-bandwidth, and angular stability of TE/TM mode. Compared to other reported design in the table, the proposed FSS is of single layer and printed on one side only, also having the highest fractional stop-bandwidth of 128.9% and covering the lower frequency up to 2.16 GHz, which makes it a good candidate for EM shield for waves operating at 5G sub-6 GHz band [Reference Mondal, Reddy, Sarkar and Sarkar16] and other IoT-based applications operating at ISM band.
Comparison of the proposed FSS with the previously reported studies

Antenna design and its application with FSS
FSS has found many applications in the field of antenna design where it is used to enhance its radiation characteristic and impedance bandwidth [Reference Mondal, Reddy, Sarkar and Sarkar16, Reference Yahya, Nakamura, Itami and Denidni17]. To demonstrate this potential application, an antenna is designed and placed above the FSS and its effects on antenna performance are monitored. The antenna used in this study is designed by introducing a V-shaped slot in the radiating patch which is excited by a co-planar waveguide (CPW) feed. The final optimized dimension of the proposed antenna is shown in Table 2. The resonance at lower frequencies can be achieved by introducing a longer current path using a V-shaped slot in the patch, which results in the overall bandwidth enhancement [Reference Fang, Wen, Inserra, Huang and Li18]. The antenna is fabricated on the same FR4 substrate which is also used for fabricating FSS. A simulated and fabricated prototype of the proposed antenna is shown in Figs 14(a) and 14(b).
CPW-fed antenna: (a) simulated and (b) fabricated prototype.

Dimensions of the proposed CPW-fed antenna

The simulation result of the antenna provides a UWB response from 2 to 12 GHz, which fulfills our requirement to be used for broadband FSS applications. The reflection coefficient (S 11) and gain measurement of the fabricated antenna is carried out using a Keysight N5227A vector network analyzer (VNA) which found to be in good agreement with the simulated results as shown in Fig. 18(b).
Since, in CPW-fed antenna both ground plane and radiating patch are on the same side of the substrate, almost half of the radiation is confined at the back side, giving rise to radiation on both ±z directions. To redirect these unwanted back radiations, the proposed FSS is placed at back side of the antenna as shown in Fig. 15(a). By using this arrangement these back-lobe radiations can be converted to broad-side radiations. The distance between FSS and antenna has a significant impact on antenna parameters i.e. return loss S 11 and gain of the antenna. To improve the gain of antenna the radiated EM wave needs to be in phase with the EM wave reflected by the FSS [Reference Yuan, Xi and Zhao19].
CPW-fed antenna on top of FSS: (a) simulated model and (b) fabricated prototype.

Based on the optimization results, a distance of 35 mm is chosen between antenna and FSS, which provides the optimum results. A simulated model and its fabricated prototype are shown in Figs 15(a) and 15(b), where a foam-based material (ɛr ≈ 1) of height 35 mm is used as a spacer to model the free space between FSS and antenna. Here the antenna is placed at a height of 35 mm above the FSS which acts as a reflector. The measurement of transmission characteristics (S 21) of the FSS and its impact on the antenna characteristics is discussed briefly in the next section.
Results and discussion
To test the performance of the proposed FSS for applications based on real-world devices and to validate the simulation results, a prototype of the proposed FSS is fabricated as shown in Fig. 2. The top single-layer structure based on CSLC is printed on a 160 mm × 160 mm × 1.6 mm FR4 substrate which consists of 100-unit cells. The measurement was carried out in an anechoic chamber using two broadband printed log-periodic dipole antennas (LPDAs) acting as a transmitter and a receiver in the wide frequency range of 1–12 GHz. The measurement setup used in this study is shown in Fig. 16(a). The FSS is placed at the center surrounded by the microwave absorbers. The transmitting and receiving LPDAs were connected to the VNA at a distance of 120 cm to maintain the far field condition and the absorbing material with a square aperture at the center is placed in the middle of two antennas to ensure that a sufficient amount of radio waves passes through the aperture.
Experimental setup for (a) transmission response (S 21) of FSS and (b) antenna gain measurement with FSS.

Initially, a reference measurement of empty aperture was taken for the calibration of measurement system. Later, the fabricated FSS prototype is fixed in the aperture and the transmission coefficient (S 21) is measured for different incident angles θ for both the TE and TM polarizations as shown in Figs 17(a) and 17(b), respectively. As the proposed FSS is equivalent to the ultra-wide band-stop filter, so all the frequency signals are stopped and did not reach the receiver LPDA. It has been observed that a close agreement is found between simulated and measured transmission coefficient (S 21) in both the modes i.e. TE and TM. The measurement setup to measure the gain of the antenna placed above FSS is shown in Fig. 16(b). The transmitting antenna is a standard wideband double ridge horn antenna having the operating frequency range from 2 to 18 GHz. The receiving antenna or the antenna under test (AUT) is a CPW-fed antenna mounted on FSS and placed at a distance of 120 cm from the transmitting antenna. The measured gain and reflection coefficient of AUT is plotted in Figs 18(a) and 18(b). A considerable improvement has been observed in the gain of AUT by approximately 5 dBi i.e. from 2–4 to 7–9 dBi with improved reflection coefficient (S 11), especially at lower frequencies which slightly improves the impedance bandwidth within the operating band.
Comparison of simulated and measured transmission coefficient (S 21) for different incident angles θ: (a) TE mode and (b) TM mode.

Comparison of simulated and measured (a) gain and (b) reflection coefficient (S 11) of AUT.

Conclusion
A novel FSS design of ultra-wide stop-band is presented in this paper. The proposed FSS design consists of single layer and printed only on one side of an FR4 substrate. The design is simple, where the desired resonance frequency can be easily achieved by changing the length of unit cell. It has also been shown that the bandwidth can further be enhanced by increasing the width of metallic layers or by increasing the inductive mesh size. The results are also validated by using the EC model. The final proposed design of dimension 0.282λ 0 × 0.282λ 0 × 0.026λ 0 shows a −10 dB fractional bandwidth of 128.94% (2.16–10 GHz) which is 34.33% (1.81–5.06 GHz) more as compared to the bandwidth of combined CSLC. The design is fabricated and the obtained results are found to be in good agreement with the simulated results. The design provides excellent stability for both TM and TE polarizations. Furthermore, the application of FSS below the CPW-fed patch antenna is investigated, which improves the impedance bandwidth and antenna gain. Some further investigation in the design may include the use of circular geometry instead of square or to study the multilayer design. The design is useful in many applications such as antenna gain enhancement, EM wave shielding for Wi-Fi/5G systems, and other IoT-based applications.
 Amit Birwal received a Master of Technology in Microwave Electronics from the University of Delhi in 2006 and received his B.Tech. degree in Electronics & Tele-communication engineering from GGSIPU in 2003. He worked at various levels in development and test phases of telecom devices at Ericsson India. He now holds a position of Assistant Professor at the Department of Electronic Science, University of Delhi South Campus. His main research interests are design and optimization of planar antennas for IoT-based systems.
 Sanjeev Singh has worked in the area of optical electronics and had obtained his Doctorate in Electronics in 1997 from the University of Delhi. He holds a position of Associate Professor at the Institute of Informatics and Communication, University of Delhi and has published over 50 research publications in international/national journals and conferences. He is also Fellow of EU-India Cross Cultural Innovation Network. His current research area is IoT-based system design, security models, and cyber physical systems.
 Binod Kumar Kanaujia received his B.Tech. degree in Electronics Engineering from Kamla Nehru Institute of Technology, Sultanpur, India in 1994. He completed his M.Tech. and Ph.D. in 1998 and 2004, respectively, from the Department of Electronics Engineering, Indian Institute of Technology, Banaras Hindu University, Varanasi, India. At present, he is working as a Professor in the School of Computational and Integrative Sciences, Jawaharlal Nehru University, New Delhi, India. He has been credited to publish more than 250 research papers with more than 1200 citations and an h-index of 18 in several peer-reviewed journals and conferences. He is also a member of several academic and professional bodies, i.e. IEEE, Institution of Engineers (India), Indian Society for Technical Education, and The Institute of Electronics and Telecommunication Engineers of India.



