Introduction
For many years, two Macrolophus species, M. melanotoma (Costa) (frequently quoted in the literature under its junior synonym M. caliginosus (Wagner) according to Carapezza (Reference Carapezza1995)) and M. pygmaeus (Rambur) (Hemiptera: Miridae), have been referred to as efficient predators of several key pests of vegetable crops in Europe (Costanzi & Pini, Reference Costanzi and Pini1991; Malausa & Trottin-Caudal, Reference Malausa, Trottin-Caudal, Alomar and Wiedenmann1996; Lykouressis et al., Reference Lykouressis, Perdikis and Chalkia2000a; Perdikis & Lykouressis, Reference Perdikis and Lykouressis2000; Urbaneja et al., Reference Urbaneja, González-Cabrera, Arnó and Gabarra2012). More specifically, in the Mediterranean region, naturally occurring populations of these predators have been referred colonizing field and greenhouse vegetable crops, and several non-crop host plants have been identified that harbour abundant populations (Alomar et al., Reference Alomar, Goula and Albajes1994, Reference Alomar, Goula and Albajes2002; Lykouressis et al., Reference Lykouressis, Perdikis and Tsagarakis2000b; Tavella & Goula, Reference Tavella and Goula2001; Ingegno et al., Reference Ingegno, Pansa and Tavella2009). Taking advantage of this fact, biological control programs based on the conservation of these species keep pest levels below damage thresholds in several locations (Castañé et al., Reference Castañé, Alomar, Goula and Gabarra2004; Gabarra et al., Reference Gabarra, Alomar, Castañé, Goula and Albajes2004). Additionally, predators labelled as ‘M. caliginosus’ have been marketed commercially with great success for biological control of whiteflies and other pests in greenhouses (van Lenteren, Reference van Lenteren and van Lenteren2003; Perdikis et al., Reference Perdikis, Fantinou and Lykouressis2011). However, due to their great morphological similarity, these Macrolophus species have been confused and probably many identifications were made based on their geographical origin. In fact, even Wagner when describing M. caliginosus may have contributed to the confusion. In the keys to the mirids of the Mediterranean Basin, he mentions that “In the Mediterranean it [M. pygmaeus] has been largely confused with M. caliginosus. Therefore, it is possible that most of the references to M. pygmaeus from there [the Mediterranean] probably refer to the previous species [M. caliginosus]” (Wagner, Reference Wagner1974). This messiness has had important consequences for both mass rearing of these species for inoculative releases and for the implementation of programs based on the conservation of their natural populations. The fact is that an important part of the scientific literature addressing the efficiency of Macrolophus as a predator refers to M. caliginosus.
The members of the genus Macrolophus exhibit a very simple morphology in comparison with other Dicyphini, and the characters that have been used to delineate these species show a great deal of intraspecific variation (Josifov, Reference Josifov1992; Goula & Alomar, Reference Goula and Alomar1994). This high variation in morphological characters suggested that it is not unlike that M. pygmaeus and M. melanotoma were conspecific (Kerzhner & Josifov, Reference Kerzhner, Josifov, Aukema and Rieger1999). In fact, Goula & Alomar (Reference Goula and Alomar1994) attempted to distinguish these species by examining several morphological characters without reaching a conclusion.
According to Josifov (Reference Josifov1992), morphometric measures, such as total body length, the ratio of the interocular distance to eye width and the length of the antennal segments, were of no use in differentiating these species due to the high variability in their populations and seasonal variability. Additionally, paramers of the male genitalia, which are a commonly used character for species identification in Miridae, are very similar between both Macrolophus species (Martinez-Cascales et al., Reference Martinez-Cascales, Cenis, Cassis and Sánchez2006; O. Alomar unpublished results). However, Josifov (Reference Josifov1992) indicated that the colour patterns of the first antennal segment and the black band-shape macula behind the eye were useful in discriminating M. melanotoma and M. pygmaeus. Subsequently, Perdikis et al. (Reference Perdikis, Margaritopoulos, Stamatis, Mamuris, Lykouressis, Tsitsipis and Pekas2003) showed that all colour patterns of the first antennal segment were present in both M. melanotoma and in M. pygmaeus; this character varies according to sex and rearing temperature, thus being of no use for identifying the two species. With respect to the macula behind the eyes, Josifov (Reference Josifov1992) gave it great importance, but Martinez-Cascales et al. (Reference Martinez-Cascales, Cenis, Cassis and Sánchez2006) confirmed that “this trait maybe used as a diagnostic character to differentiate both species with some degree of confidence”. Perdikis et al. (Reference Perdikis, Margaritopoulos, Stamatis, Mamuris, Lykouressis, Tsitsipis and Pekas2003) also indicated that the shape and size of the respiratory horn of the egg might be used as a discriminating character.
Macrolophus melanotoma was originally described by Wagner (Reference Wagner1951) from samples taken on Dittrichia viscosa (L.) Greuter and subsequent work on species identity has used populations taken from this plant and from tomato. In crossing experiments using Greek populations, Perdikis et al. (Reference Perdikis, Margaritopoulos, Stamatis, Mamuris, Lykouressis, Tsitsipis and Pekas2003) showed that M. melanotoma females collected on D. viscosa plants did not produce viable eggs when crossed with M. pygmaeus males collected on tomato; and, conversely, females collected from tomato did not produce viable eggs when crossed with males from D. viscosa plants. These authors also showed that these two species differed regarding the amplification pattern generated by three restriction enzymes and two random amplified polymorphic DNA (RAPD) primers. Although in their study these authors were able to separate the two species using this molecular technique, RAPDs are not a reliable tool for taxonomic identification due to its high variability in performance. RAPD has been criticized because it usually shows low levels of repeatability and because it can potentially generate spurious bands (Pérez et al., Reference Pérez, Albornoz and Domínguez1998; Rabouam et al., Reference Rabouam, Comes, Bretagnolle, Humbert, Periquet and Bigot1999). Additionally, Martinez-Cascales et al. (Reference Martinez-Cascales, Cenis, Cassis and Sánchez2006) analysed the sequence variation of a Cytochrome b (Cytb) fragment from Spanish populations of M. melanotoma collected on D. viscosa and of M. pygmaeus collected on tomato. They showed that M. melanotoma and M. pygmaeus were grouped into two different clusters in a phylogenetic tree supported by high bootstrap values at the species-level nodes. The inferred phylogeny presents M. pygmaeus as a sister species of another species, M. costalis Fieber, with M. melanotoma being basal to the clade of these two species. These results indicate that M. pygmaeus and M. melanotoma are two sympatric species. Although sequencing a DNA fragment is a reliable tool for species identification, a PCR reaction with specific primers is more adequate if we aim to discriminate between high numbers of individuals from few species.
Because most morphometric characters evaluated to date are not reliable or are not practical for routine species identification, the purpose of the present study is to develop efficient tools to identify these two Macrolophus species. Because they are morphologically very similar, we first confirmed the specific status of populations collected on their respective host plants through crossing experiments. Finally, we determined whether multivariate morphometric analysis and molecular methods can be used to distinguish these two Macrolophus species.
Materials and methods
Insect colonies
The original field populations used in these experiments were collected in summer, in the coastal area north of Barcelona, Spain. A sample of 108 Macrolophus females was collected from a D. viscosa patch on an experimental plot located at IRTA, Cabrils. Another sample of 69 Macrolophus females was collected in a nearby commercial tomato field. This crop had been naturally colonised by the mirid predator.
Shape of the respiratory horn of the egg
Females from both field populations were individually confined to oviposit in cages (7 cm diameter × 3.5 cm high with a ventilated lid) that had a layer of 0.5% agar and a tobacco leaf disc placed on top of it, with the abaxial surface facing upwards). After two days, they were classified by the shape of the respiratory horns of the eggs under a stereomicroscope according to Perdikis et al. (Reference Perdikis, Margaritopoulos, Stamatis, Mamuris, Lykouressis, Tsitsipis and Pekas2003). As they described, a single-lobbed, short respiratory horn is characteristic of M. melanotoma, and a branched, long respiratory horn is characteristic of M. pygmaeus. Therefore, each individual collected from the field was then described as either M. melanotoma when collected on D. viscosa and exhibiting eggs with a short respiratory horn or M. pygmaeus when collected on tomato and presenting eggs with a long respiratory horn. Subsequently, M. melanotoma and M. pygmaeus females were confined for one week on a tobacco plant with the aim of obtaining their progeny (F0) to perform the interbreeding crossings. Ephestia kuehniella Zell. (Lepidoptera, Pyralidae) eggs were supplied as prey.
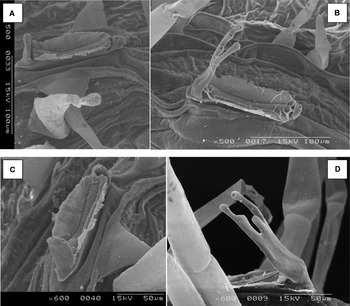
To visualise the differences in the shapes of the respiratory horns from the two species, scanning electron microscope (SEM) images of eggs deposited on the tobacco leaf discs were obtained at the Scientific and Technological Centers of the University of Barcelona.
Shape of the macula of the eye
The black stain located laterally between the eye and the collar (band-shaped macula) was described in terms of its sharpness (‘well defined’ or ‘less well defined’) and shape (‘parallel’ or ‘convergent’ sides) according to the terms used by Martinez-Cascales et al. (Reference Martinez-Cascales, Cenis, Cassis and Sánchez2006) for all females collected in the field that laid eggs.
Crossing experiments
All experiments were performed under controlled conditions (25 ± 2 °C; 70 ± 10% Relative Humidity and 16:8 h Light:Dark photoperiod). The offspring (F0) of field-collected females were used and reared on a small tobacco plant and with E. kuehniella eggs as prey. To ensure that the adults used in the experiments were virgins, 5th instar nymphs were isolated in small ventilated cages with a small piece of bean pod and E. kuehniella eggs. Newly emerged adults were then sexed and maintained in isolation until they were sexually mature, five to seven days later (Castañé et al., Reference Castañé, Alomar, Riudavets and Gemeno2007). Conspecific and heterospecific crosses were performed and each replicate consisted of one female and three males. The reason for the use of three males was to ensure that each female was able to mate in case of the death of one male. Each replicate was carried out in a ventilated cage (24 cm height × 12 cm diameter) with a small tobacco plant and E. kuehniella eggs as prey. The following crosses were performed:
1♀ M. melanotoma × 3♂♂ M. melanotoma
1♀ M. melanotoma × 3♂♂ M. pygmaeus
1♀ M. pygmaeus × 3♂♂ M. melanotoma
1♀ M. pygmaeus × 3♂♂ M. pygmaeus
There were 30 replicates performed for conspecific crossings and 31 for heterospecific crossings. After three days, each female and the three corresponding males were transferred to a new tobacco plant. On day 7, the crossings in which the female have died were discarded. During the next 10 to 15 days after the females were removed from the cages, the offspring were periodically scored on the two plants offered to each female. These newly emerged nymphs were allowed to develop to adults (F1) on new tobacco plants and then stored at –20 °C until further morphological and genetic analyses.
Reproductive characterisation of F0 females and morphology of their eggs
F0 females surviving the crossing experiments were dissected to evaluate the abundance of developed eggs and the presence of motile sperm in their ovaries, as described in Franco et al. (Reference Franco, Jauset and Castañé2011). A female's abdomen was removed, and an incision was made along the left side under saline solution; the ovaries were carefully removed, submerged in a new drop of saline solution on a microscope slide and covered with a cover glass. The lateral oviducts and ovarioles were examined under a light microscope (100×) for the presence of motile sperm. The number of chorionated eggs per female was annotated, and the length of the respiratory horn of five eggs per female was measured at 125 × . A total of 50 females from M. melanotoma and 56 from M. pygmaeus were analysed.
Morphological characters of F1 adults
Morphological characters were studied in the F1 adults, the offspring of conspecific crossings described previously. The shape and sharpness of the eye's macula were described in the same manner as for females of the F0 generation.
Dorsal and lateral images (20× for total body length and tibiae and 40× for all other measurements) of each individual were obtained under a stereomicroscope and were analysed using the ImageJ 1.43u programme (http://rsbweb.nih.gov/ij/). The following measurements were recorded in six females and six males: tibial length of the anterior leg (ATL); tibial length of the middle leg (MTL); total body length, from the most apical point of the head to the tip of the wings (TotL); length of antennal segments I, II, III and IV (AI, AII, AIII and AIV); ocular width, from a side view (OWside); ocular length, from a side view (OLside); black macula behind the eye at its maximal width (BMW); minimum interocular width, from a top view (IOWmin); head width, including the eyes, from a top view (HW); ocular width from a top view (OWtop); anterior pronotum width (CW); and posterior pronotum width (PW). These measures and, especially, certain ratios between them are commonly used in the taxonomic keys of mirids (Wagner, Reference Wagner1951, Reference Wagner1974; Stichel, Reference Stichel1962). As a description of the shape of the pronotum, we also measured the length of the pronotum lateral side and calculated the tangent of the bottom pronotum angle (TPA) as a measure for the shape of the pronotum.
Molecular markers of Macrolophus sp.
We tested primers previously designed for the two Macrolophus species, and we subsequently also designed a new pair of specific primers.
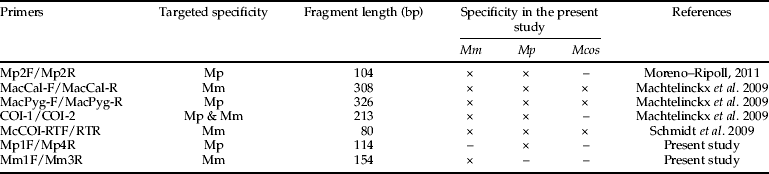
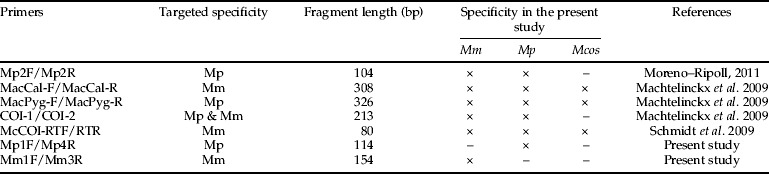
The previously designed primers used in this study were (table 1): (i) M. pygmaeus primers (Mp2F and Mp2R) designed from the mitochondrial cytochrome oxidase I (COI) region (Moreno-Ripoll, Reference Moreno-Ripoll2011), (ii) M. melanotoma (MacCal-F and MacCal-R), and (iii) M. pygmaeus (MacPyg-F and MacPyg-R) primers designed from the mitochondrial Cytochrome b region (Machtelinckx et al., Reference Machtelinckx, Van Leeuwen, Vanholme, Gehesquière, Dermauw, Vandekerkhove, Gheysen and De Clercq2009), (iv) Macrolophus-specific primers (COI-1 and COI-2) designed from the COI region (Machtelinckx et al., Reference Machtelinckx, Van Leeuwen, Vanholme, Gehesquière, Dermauw, Vandekerkhove, Gheysen and De Clercq2009) and (v) M. melanotoma primers (McCOI/RTF and McCOI/RTR) designed from the COI region by Schmidt et al. (Reference Schmidt, Almeida, Rosati and Arpaia2009). All primers were tested using the original PCR conditions described in the respective publications. Additionally, RAPDs were tested using the primers OPA-18 and OPA-20, as described in Perdikis et al. (Reference Perdikis, Margaritopoulos, Stamatis, Mamuris, Lykouressis, Tsitsipis and Pekas2003).
Specificity and length of the fragments amplified by conventional PCR using the primers tested to discriminate between Macrolophus pygmaeus (Mp) collected on tomato, Macrolophus melanotoma (Mm) collected on Dittrichia viscosa and Macrolophus costalis (Mcos) collected on Cistus albidus. The species for which amplification products were obtained in the present study are indicated with an ×. The targeted specificity is the specificity described in the corresponding references.
Two pairs of M. melanotoma and M. pygmaeus-specific primers were also designed in the present study from the Cytb region as described in Agustí et al. (Reference Agustí, Unruh and Welter2003). Sequences from the GenBank database (www.ncbi.nlm.nih.gov) (DQ372111, DQ372111 and DQ372121 for M. pygmaeus and DQ372117, DQ372118 and DQ372120 for M. melanotoma) were used. Sequence alignments were performed using CLUSTALW (http://www.ebi.ac.uk/clustalw). PCR amplifications were carried out in a volume of 25 μl containing 1 μl of resuspended DNA with 0.6 U of Taq DNA polymerase (Invitrogen), 0.2 mM dNTPs (Promega), 0.2 μM each primer and 1 mM (M. melanotoma) or 2 mM (M. pygmaeus) MgCl2 in 10× manufacturer's buffer. The samples were amplified using a first cycle of denaturation at 94 °C for 2 min, followed by 35 cycles of 94 °C for 20 s, 62 °C for 30 s and 72 °C for 45 s, with a final extension at 72 °C for 5 min.
DNA was extracted in all cases from individual insects using the DNeasy Tissue Kit (QIAGEN GmbH, protocol for animal tissues; Hilden, Germany). Total DNA was eluted in 100 ml of AE buffer provided by the manufacturer and stored at –20 °C. Negative controls were added to each set of DNA extractions. The samples were amplified in a 2720 thermal cycler (Applied Biosystems, Frederick, MD, USA). Target DNA and water were always included as positive and negative controls, respectively. All PCR products were separated by electrophoresis in 3.5% agarose gels, stained with ethidium bromide and visualised under UV light.
To determine the specificity of all of the tested specific primers, three individuals from three different populations collected on three different plants were tested. The first of these populations was originally collected on tomato and reared at our facilities (IRTA, Cabrils) as described in Agustí & Gabarra (Reference Agustí and Gabarra2009a,Reference Agustí and Gabarrab).The second population was collected on D. viscosa. According to the results from the morphological characterization of field collected females, we assumed that Macrolophus collected on tomato were M. pygmaeus and those collected on D. viscosa were M. melanotoma. A third population was collected on Cistus albidus L., which was identified as M. costalis (Josifov, Reference Josifov1992). All of these populations came from the same area.
Finally, the same M. pygmaeus, M. melanotoma and M. costalis individuals together with six males and six females from the F1 generation, corresponding to the progeny of the conspecific crossings, were also tested exclusively using the molecular markers allowing correct discrimination among both first species. Also, using these primers, some individuals from old IRTA's lab colonies and kept in 70% alcohol (n = 8 individuals per year; years 2001, 2002 and 2003) were tested to determine the species reared.
Data analysis
The effect of conspecific and heterospecific crossings on the number of nymphs produced by F0 females over a seven-day period was analysed using a Kruskal-Wallis one-way ANOVA followed by a Wilcoxon test because the obtained variances lacked homescedasticity (Bartlett's test). The effect of the crossings on the number of chorionated eggs in F0 females was analysed by a one-way ANOVA followed by a Tukey test. The length of the respiratory horn of the eggs from F0 females was analysed by a Student's t-test.
To test the effect of species, sex and the species by sex interaction on morphometric characters of F1 adults, a two-way-ANOVA was performed. As the results (not shown) indicated that the differences between species were due mostly to males, additional measurements were taken in males (n = 11) of both species. These extra measurements were taken only for morphometric characters that were significantly different between species. Ratios of all possible binary combinations were calculated as ratios are commonly used in taxonomic works of mirids (Stichel, Reference Stichel1962; Wagner, Reference Wagner1951, Reference Wagner1974). The potential ability of these morphometric ratios to distinguish between species was assessed with a t-test. A multivariate principal component analysis biplot was produced to illustrate possible clustering of the two species and the correlations between morphometric ratios. The morphometric ratios that showed the most highly significant differences between species (P < 0.01) were retained, and linear discriminant analysis (LDA) was performed among various combinations of morphometric ratios. LDA is able to find linear combinations that minimise the variance among individuals of the same species and maximise the variance between individuals from different species. Only linear combinations that classified all individuals correctly were retained, and a MANOVA test was performed. The statistical analyses were performed using R (R Development Core Team, 2008).
Results
Morphological characterization of field collected females of M. pygmaeus and M. melanotoma
Shape of the respiratory horn of the egg
Figure 1 shows SEM images from operculum and respiratory horn of eggs from M. melanotoma and M. pygmaeus females on a tobacco plant. The egg respiratory horns of M. pygmaeus were branched and longer than those of M. melanotoma.
Egg respiratory horns of Macrolophus melanotoma, (A) 500× and (C) 600 × , and Macrolophus pygmaeus, (B) 500× and (D) 600 × , laid on a tobacco leaf nerve, under a scanning electron microscope.

Sixty M. melanotoma females (from the 108 collected on D. viscosa) and 46 M. pygmaeus females (from the 69 collected on tomato) were selected to produce progeny after examining the shape of their eggs’ respiratory horn. The discarded females died during the oviposition period or laid no eggs. Only two females from D. viscosa were discarded because the shape of the egg respiratory horn was less defined. Therefore, most of the females collected on D. viscosa corresponded to the morphology of M. melanotoma, and all of the females collected on tomato corresponded to the morphology of M. pygmaeus (fig. 1).
Size and shape of the black macula behind the eye
The results of applying the criteria of the shape and sharpness of the eye's macula for the separation of species among field-collected females did not agree with the classification based on the shape of the respiratory horns. Most of the M. melanotoma individuals (92.3%) had a macula with well-defined limits and convergent or very convergent sides, which would correspond to M. melanotoma, but 7.7% of them had a macula with well-defined margins and parallel sides, which would correspond in part to M. pygmaeus (Josifov, Reference Josifov1992; Martinez-Cascales et al., Reference Martinez-Cascales, Cenis, Cassis and Sánchez2006). However, only 55.2% of M. pygmaeus would be correctly assigned to their species based on this character because, among the other 44.8% of individuals, 13.8% had less defined margins but convergent sides, and 31% of them had parallel sides but well-defined margins.
Crossing experiments
Reproductive characterisation of females and morphology of their eggs
Most of the F0 females survived the seven-day period of the experiment, with the percentages ranging between 80% and 93.3% (corresponding to 24 to 28 females) (table 2). The insemination success rates, which were measured as the percentage of females with motile sperm in their ovarioles, were 100% and 72.0% in conspecific crosses of M. pygmaeus or M. melanotoma, respectively. However, in heterospecific crosses, the insemination success was very low, with a success of 0% of M. pygmaeus females with M. melanotoma males and 6.5% of M. melanotoma females with M. pygmaeus males being observed. The same pattern was observed for reproductive rates, with 96.4% and 60% of the surviving females laying eggs in the conspecific crosses, but only 0% and 3.6% of females laying eggs in the heterospecific crosses (table 2). Conspecific crosses between adults of M. pygmaeus and M. melanotoma resulted in the successful production of progeny, as would be expected. In contrast, heterospecific crosses resulted in no or few nymphs being produced (table 2). None of these N1 nymphs from the M. melanotoma×M. pygmaeus heterospecific crossings completed preimaginal development, with all dying before reaching the adult stage. Significantly more nymphs per female were produced in the conspecific crossing of M. pygmaeus than in the conspecific crossing of M. melanotoma (χ2 = 81.58; df = 3; P < 0.0001).
Chorionated oocytes in the ovaries of F0 females
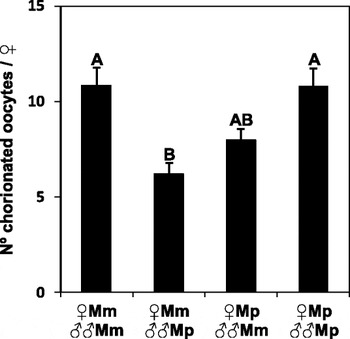
The number of chorionated oocytes in the ovaries of F0 females from the two conspecific crosses was significantly greater than in the heterospecific cross of M. melanotoma females with M. pygmaeus males (F = 7.15; df = 7, 15; P = 0.0002). Females of M. pygmaeus crossed with males of M. melanotoma exhibited an intermediate egg load (fig. 2).
Number of chorionated oocytes in the ovaries of F0 females from conspecific and heterospecific crosses, one week after mating and one week of oviposition (n = 24–28 females).

Percentage of F0 females surviving the crossings, percentage of inseminated females of those surviving, percentage of females that laid eggs of those inseminated and number of nymphs produced by females from conspecific and heterospecific crossings over seven days (values followed by different letters are significantly different, P < 0.05) (n = 30–31).

Length of the respiratory horn of the egg in F0 females
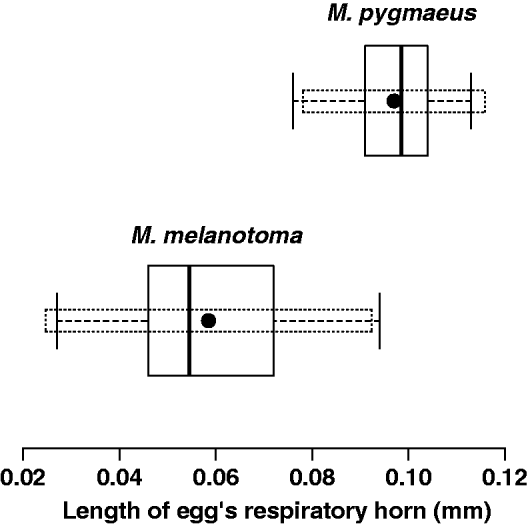
As expected, mean lengths of the egg respiratory horns were significantly different (t = –14.30; df = 75.2; P < 0.0001) in the two species, being longer in M. pygmaeus (mean ± SD= 0.097 ± 0.0094 mm) than M. melanotoma (0.059 ± 0.0168 mm) (fig. 3). However, when calculating the 1–α = 0.95 confidence intervals for the population means, there is overlap between the two populations. The upper limit of the confidence interval for M. melanotoma is 0.093 mm, and the lower limit for M. pygmaeus is 0.078 mm; thus, 22% of F0 females could belong to either of the two populations. Therefore, it does not appear to be reasonable to classify the species using only this criterion.
Boxplot representing the length of the egg respiratory horn from F0 generation females of M. melanotoma and M. pygmaeus. Dotted boxes represent the 1–α = 0.95 confidence intervals for population means.

Morphological characters of F1 adults
Size and shape of the black macula behind the eye
Most of the M. melanotoma individuals (95%) exhibited a macula with well-defined margins, but only 55% of these individuals had convergent sides as expected. In the case of M. pygmaeus, 88% of individuals presented less-defined margins, but only 54% of them had parallel margins as expected. Mean values of the ratios of macula width to eye width are not significantly different between M. melanotoma and M. pygmaeus males and females (0.29 ± 0.02, 0.33 ± 0.02 and 0.36 ± 0.04, 0.37 ± 0.04, respectively; t-test, P > 0.05). Therefore, neither the criterion of sharpness and shape of margins nor the relative size were appropriate to discriminate between individuals from the two species.
Morphometric characters of individuals
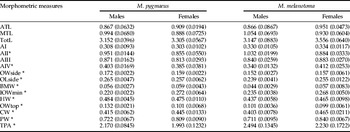
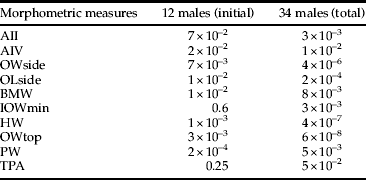
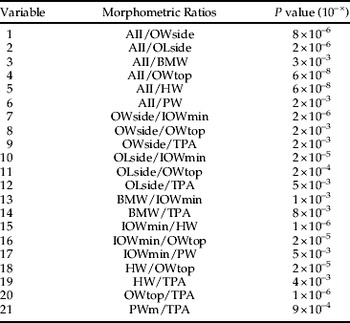
Table 3 shows the mean and standard deviation of the morphometric characters evaluated in the offspring of conspecific crossings when they reached the adult stage. Table 4 shows the characters that best separated males of M. pygmaeus and M. melanotoma, and table 5 presents the morphometric ratios that best separate both species; only ratios with P values lower than 0.01 were retained.
Morphometric measures (in mm) of males and females from populations of M. pygmaeus and M. melanotoma (mean (standard deviation)) (n = 6 for all measures, except for males for characters with an *, for which n = 17). Tibial length of anterior leg (ATL); tibial length of middle leg (MTL); total body length, from the most apical point of the head to the tip of the wings (TotL); antennal segments I, II, III and IV (AI, AII, AIII and AIV); ocular width from a side view (OWside); ocular length from a side view (OLside); black macula behind the eye at its maximal width (BMW); minimum interocular width, excluding the eyes, from a top view (IOWmin); head width, including the eyes, from a top view (HW); ocular width from a top view (OWtop); anterior pronotum width (CW); posterior pronotum width (PW); tangent of pronotum angle (TPA).

P values (t-test) of the morphometric measures that best separate male population means. See table 3 for abbreviations.
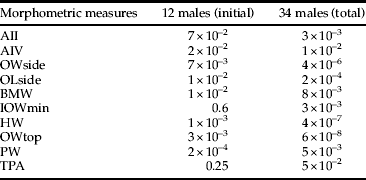
t values (t-test) of the morphometric ratios for males that best (P < 0.01) separate the population means of the two species. See table 3 for abbreviations.

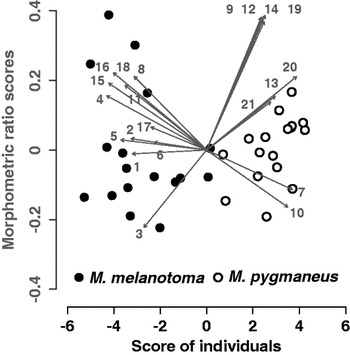
The principal component analysis biplot shown in fig. 4 illustrates the relative position of the retained morphometric ratios (table 5) and individuals in the space defined by the first two components. Although the map explains only 67% of the variance of the data (47% and 20% by the horizontal and vertical axis, respectively), it shows a good separation of individuals according to species. Macrolophus pygmaeus has larger values for morphometric ratios OWside/IOWmin (7), OLside/IOWmin (10), and OWtop/TPA (20), while M. melanotoma has larger values for the ratios AII/HW (5), AII/OWtop (4), IOWmin/HW (15), IOWmin/OWtop (16) and HW/OWtop (18). The dispersion among individuals from M. melanotoma is greater than that of individuals from M. pygmaeus.
Principal component analysis biplot representing the relative positions of the morphometric ratios from table 3 depicted as numbers and individuals in a bidimensional space (variance of horizontal and vertical axis, 47% and 20%, respectively).

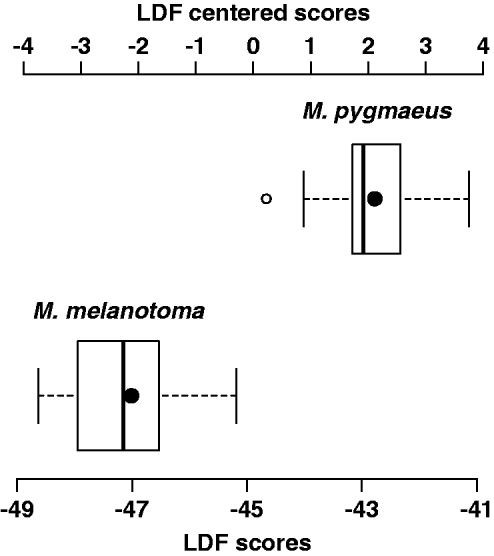
With respect to the discriminant analysis, no single morphometric ratio classified all individuals correctly. Correct classification was also not obtained with linear discriminant combinations of two or three morphometric ratios. The best linear combination of four morphometric ratios was obtained with AII/OWtop, AII/HW, OWside/IOWmin and IOWmin/HW, for which the coefficients of the linear discriminant function are 3.09, −17.24, 4.92 and −77.13, respectively. The mean and standard deviation of the LDF are −44.82 and 2.35, respectively. Positive values of the centred linear discriminant function correspond to M. pygmaeus individuals, and negative values correspond to M. melanotoma individuals (fig. 5). The MANOVA test for this combination gives a λ Wilks value of 0.17 and a P value of 1 × 10⁻¹⁰.
Boxplot representing linear discriminant function scores (LDFS) of M. melanotoma and M. pygmaueus males (LDFS= 3.09 × AII/OWtop–17.24 × AII/HW + 4.92 × OWside/IOWmin–77.13 × IOWmin/HW) and centred LDF scores (LDFC); LDFC = LDFS + 44.82 (average LDFS). LDFC < 0 correspond to M. melanotoma and LDFC > 0 to M. pygmaeus (black dot inside the boxes represent average values of each species).
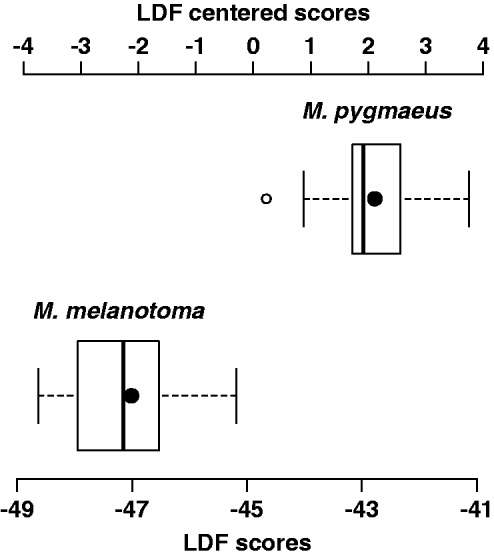
When testing this function with the mean values of morphometric characters provided in Martinez-Cascales et al., (Reference Martinez-Cascales, Cenis, Cassis and Sánchez2006), both M. pygmaeus and M. melanotoma were also correctly classified.
Molecular markers for Macrolophus sp.
When three females from each of M. pygmaeus, M. melanotoma and M. costalis were tested, none of the five molecular markers previously developed by other authors were able to discriminate between M. pygmaeus and M. melanotoma (table 1). Primers Mp2F and Mp2R amplified a fragment of 104 bp in both M. melanotoma and M. pygmaeus, whereas no product was amplified from M. costalis. The primer pairs MacCal-F/MacCal-R and MacPyg-F/MacPyg-R amplified fragments of 308 and 326 bp, respectively, but they were not able to distinguish between M. melanotoma, M. pygmaeus and M. costalis. Using primers COI-1/COI-2, a fragment of 213 bp was obtained from both M. melanotoma and M. pygmaeus. With primers McCOI/RTF-McCOI/RTR, a fragment of 80 bp was amplified from M. melanotma, M. pygmaeus and M. costalis. Finally, OPA-18 and OPA-20 were tested, as in Perdikis et al. (Reference Perdikis, Margaritopoulos, Stamatis, Mamuris, Lykouressis, Tsitsipis and Pekas2003), but the obtained banding patterns were not the same as described by these authors and they did not allow their discrimination.
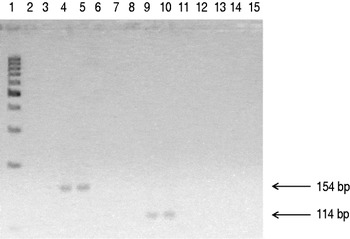
Only the specific primer pairs designed in the present study for M. pygmaeus and M. melanotoma were able to discriminate between the two species, amplifying fragments of 114 and 154 bp, respectively (fig. 6). No product was amplified from M. costalis with either pair of primers. The sequences of these primers were as follows:
5′-GTAACATAGATAAAATCCCATTTC-3′ (Mp1F),
5′-CCAAGTAATTGAGGCTCTCATAT-3′ (Mp4R),
5′-CTTCTTGATGCCTTTTATTGTGGC-3′ (Mm1F)
5′-TTATCATACCTATGTAGTCCTTGATT-3′ (Mm3R).
Additionally, when these primers were tested in six males and six females from the F1 generation corresponding to the progeny of the conspecific crossings, Mp1F/Mp4R produced amplification products from all M. pygmaeus collected on tomato but none of the M. melanotoma collected on D. viscosa. Conversely, the primers Mm1F/Mm3R only amplified products from M. melanotoma collected on D. viscosa but not M. pygmaeus from tomato.
PCR products obtained using M. pygmaeus and M. melanotoma-specific primers: Mp1F/Mp4R (lanes 9–15) and Mm1F/Mm3R (lanes 2–8) (114 and 154 bp, respectively). Lanes 2–3 and 9–10 are M. pygmaeus; lanes 4–5 and 11–12 are M. melanotoma; lanes 6–7 and 13–14 are M. costalis, a species included as an outgroup. Lanes 8 and 15 are the negative control. Lane 1, 100 bp molecular size-marker.

Finally, all tested Macrolophus samples coming from old IRTA's lab colonies (years 2001, 2002 and 2003) were identified as M. pygmaeus.
Discussion
Macrolophus pygmaeus and M. melanotoma are sympatric species at least in part of their geographical distribution. They are also ‘cryptic’ because they are, at least superficially, morphologically indistinguishable. Although the two species were previously described based on several morphological traits, most of these traits have shown great plasticity, as previously discussed. In the present study, we review some of these identification traits that are still accepted and propose new traits to aid in this task.
As indicated, we previously confirmed the specific status of populations collected on their respective host plants through crossing experiments. The populations of M. melanotoma collected on D. viscosa and M. pygmaeus from tomato used in these trials were intrinsically reproductively isolated lineages, as no viable progeny were produced in the interspecific crossings; and they, therefore, represent two distinct species under the Biological Species Concept. Only one M. melanotoma female crossed with M. pygmaeus males was able to produce nymphs, but they did not survive to adulthood. Perdikis et al. (Reference Perdikis, Margaritopoulos, Stamatis, Mamuris, Lykouressis, Tsitsipis and Pekas2003) did not obtain any nymphs when crossing M. melanotoma with M. pygmaeus using Greek populations. This difference compared to our results probably has to do with the lower number of replicates performed (ten pairs in their case), which reduced the chances of observing interbreeding. Reproductive incompatibility seems to be high between these two species because only two M. melanotoma females out of 31 were inseminated by M. pygmaeus males, whereas no M. pygmaeus females were inseminated by M. melanotoma males. M. pygmaeus is a monoandrous species (Castañé et al., Reference Castañé, Alomar, Riudavets and Gemeno2007; Gemeno et al., Reference Gemeno, Alomar, Riudavets and Castañé2007), and females still have sperm in their ovaries 21 days after their single copula (Franco et al., Reference Franco, Jauset and Castañé2011). Therefore, if sperm was not found in female's ovaries seven days after being with males, it was because interspecific copulas have not occurred or, if they did, copulas were not effective in the transmission of sperm.
Among the morphological characters that have not yet been clearly discarded for identification of these species is the black macula behind the eyes. In this study, the shape and sharpness of the macula did not allow correct assignment of individuals to each Macrolophus species. A total of 8% of field-collected individuals and 45% of F1 individuals of M. melanotoma would have been misidentified using the criterion of a well-defined macula and with convergent margins specified by Martinez-Cascales et al. (Reference Martinez-Cascales, Cenis, Cassis and Sánchez2006). In the case of M. pygmaeus, 44% of the field-collected individuals and 46% of F1 individuals would also have been misidentified using the criterion of a shadowy macula with parallel margins. Wagner (1970) and Josifov (Reference Josifov1992) both also described that the dark stripe behind the eye was broader in M. pygmaeus than in M. melanotoma and used the ratio of its width to the eye width in their keys. However, both authors used different threshold values (1/2 and 1/3, respectively), already suggesting some variability in the measures. Our results indicate that this ratio does not significantly differ between both species, and neither the sharpness nor the relative width can be used as a diagnostic character to separate these two species.
A character that can be used to distinguish species of true bugs within a habitat or region is the exterior surface pattern of the egg and the shape of the operculum (Lundgren, Reference Lundgren2011). Eggs of cimicomorpha have a true operculum at their apex formed by aeropyles that circumscribe the cephalic end of the egg. Aeropyles are invaginations of the chorion that function in gas exchange. In some bugs of the family Miridae (all Dicyphus and Macrolophus species), aeropyles are grouped together and open at the apexes of one or two respiratory horns (Cobben, Reference Cobben1968). In the case of M. pygmaeus (=M. nubilus H-S) Cobben (Reference Cobben1968) reported a long, two-branch respiratory horn of 0.086 mm in length. Perdikis & Lykouressis (Reference Perdikis and Lykouressis2002) and Perdikis et al. (Reference Perdikis, Margaritopoulos, Stamatis, Mamuris, Lykouressis, Tsitsipis and Pekas2003) also described a long and branched respiratory horn on the eggs of M. pygmaeus, while the eggs of M. melanotoma exhibit a short and unbranched horn. The M. melanotoma females used in our crossing experiments presented eggs with a short and unbranched respiratory horn, as shown by the SEM images, and most of their daughters produced eggs with short respiratory horns. Similar results were found for M. pygmaeus; the mothers exhibited eggs with long and branched respiratory horns, and most of their daughters also produced eggs with long respiratory horns. Nevertheless, when measuring the length of respiratory horns of eggs from dissected females, 22% of daughters from both populations exhibited eggs with respiratory horns of intermediate sizes, although the shape of the horns was not evaluated. The shape of the respiratory horn of oviposited eggs (fig. 1) seems more reliable than only measuring the length of the horn. Therefore, this character presents some plasticity that deserves further investigation to evaluate the within-species variation before it can be fully recommended as a single classification character.
As previously discussed, morphometric measures of the body have been studied by other authors, but only mere descriptions of linear measures or their ratios, without any statistical elaboration, have been described. In contrast, in the present study, we propose a linear discriminant function that combines the length of the second antennal segment (AII) with the relative sizes of eyes and the head (OWtop, Owside, HW, IOWmin). This function separated males of the two species without error, resulting in positive values for M. pygmaeus and negative values for M. melanotoma. This indicates that there is a subtle but consistent difference in the male head shape in the two species. In his description of M. melanotoma, Wagner (Reference Wagner1951) indicated that, among others, this species was characterised by the large 2nd antennal article, small eyes and a large interocular distance. Although Josifov (Reference Josifov1992) considered that many of the measures and ratios proposed by Wagner were too variable and should be taken with caution, it is clear that the combined use of them in a discriminant function allows differentiating both species. Negative scores of the LDF are favoured by the high coefficients of (AII/HW) that indicates a relatively larger AII, and of (IOWmin/HW), that indicates smaller eyes. The morphometric measures addressed in the present study are the most commonly used for characterising individuals in the family Miridae (Wagner, Reference Wagner1951, Reference Wagner1974). However, there are probably other morphometric measures or combinations that can show consistent differences between the two species that could be further investigated, especially for females.
Although a number of molecular markers have previously been developed for M. pygmaeus and/or M. melanotoma, none of these markers were able to discriminate between these two Macrolophus species in the present study. All of the primers tested were used under the published PCR conditions; but, when populations of the two species were tested, these primers were not sufficiently specific, and some of them even amplified products from M. costalis. The tested primers from Moreno-Ripoll (Reference Moreno-Ripoll2011) were designed based only on M. pygmaeus sequences from IRTA's lab colony, and M. melanotoma sequences were not considered. Therefore, they are not M. pygmaeus specific. Although the three pairs of primers described by Machtelinckx et al. (Reference Machtelinckx, Van Leeuwen, Vanholme, Gehesquière, Dermauw, Vandekerkhove, Gheysen and De Clercq2009) were designed based on published sequences of M. melanotoma and M. pygmaeus, the authors only tested them on a commercial population labelled as M. caliginosus, and never on a population of M. melanotoma. Therefore, the specificity of these primers was never demonstrated. Results presented here show they are not species-specific either. Finally, the pair of primers described in Schmidt et al. (Reference Schmidt, Almeida, Rosati and Arpaia2009) were designed from newly obtained sequences of M. caliginosus from Koppert, Italy, but the authors did not test them on any other Macrolophus population. We have demonstrated that these primers detect all three Macrolophus species. The results using the RAPDs proposed by Perdikis et al. (Reference Perdikis, Margaritopoulos, Stamatis, Mamuris, Lykouressis, Tsitsipis and Pekas2003) were inconsistent, producing banding patterns different than those described by the previous authors. For this reason, two new pairs of specific primers were designed in the present study based on the previously published sequences from Martinez-Cascales et al. (Reference Martinez-Cascales, Cenis, Cassis and Sánchez2006). These newly designed primers were sufficiently specific to discriminate between these two Macrolophus species, and amplification was successful in only M. pygmaeus or M. melanotoma using their respective specific primers. Then, when Macrolophus from the crossing populations were tested using these primers, it was possible to molecularly identify them as M. pygmaeus or M. melanotoma. The use of the primers proposed in this study allowed species identification to be achieved by performing a simple PCR reaction, avoiding the need to sequencing each individual, as proposed by Martinez-Cascales et al. (Reference Martinez-Cascales, Cenis, Cassis and Sánchez2006). The analysis of voucher samples coming from old IRTA's lab colonies (years 2001, 2002 and 2003) were identified in the present study as M. pygmaeus in all cases. Therefore, we can be certain that the articles we have published on biology of M. caliginosus in the laboratory should actually refer to M. pygmaeus (Lucas & Alomar, Reference Lucas and Alomar2001, 2002a,b; Montserrat et al., Reference Montserrat, Albajes and Castañé2004; Castañé & Zapata, Reference Castañé and Zapata2005; Alomar et al., Reference Alomar, Riudavets and Castañé2006; Castañé et al., Reference Castañé, Quero and Riudavets2006, Reference Castañé, Alomar, Riudavets and Gemeno2007; Fréchette et al., Reference Fréchette, Rojo, Alomar and Lucas2007; Gemeno et al., Reference Gemeno, Alomar, Riudavets and Castañé2007; Lucas et al., Reference Lucas, Fréchette and Alomar2009). We can also hypothesize that most of the field work on ‘M. caliginosus’ in the Mediterranean Basin and presumably also in the rest of Europe, which is mainly centred in tomato crops, may actually refer to M. pygmaeus. This hypothesis is based on the fact that Macrolophus sequenced by Martinez-Cascales et al. (Reference Martinez-Cascales, Cenis, Cassis and Sánchez2006) as M. pygmaeus were all collected on tomato crops; Macrolophus we identified as M. pygmaeus in the present study were also collected on tomato greenhouses; and our colonies that are periodically refreshed with Macrolophus adults were collected on tomato crops are also M. pygmaeus.
The classification we made of field-collected females, based on the morphology of the respiratory horn of their eggs when inserted in the plant tissue, was confirmed by molecular methods tested on their offspring. We, therefore, can assume that there is a clear difference between the shapes of eggs of both species. Cobben (Reference Cobben1968), Hillert et al. (Reference Hillert, Jackel and Plate2002) and Perdikis et al. (Reference Perdikis, Margaritopoulos, Stamatis, Mamuris, Lykouressis, Tsitsipis and Pekas2003) depicted M. pygmaeus eggs with long and branched respiratory horns. However, some older drawings and pictures of respiratory horns of M. caliginosus were also branched and long (Constant et al., Reference Constant, Grenier and Bonnot1994; Malausa, Reference Malausa1989). According to our hypothesis, this can be attributed to the mentioned confusion, and it is very plausible that M. pygmaeus were incorrectly labelled as M. caliginosus. Therefore, the synonymy of M. caliginosus and M. melanotoma does not necessarily mean that all references to M. caliginosus should be attributed to M. melanotoma (e.g. Martinez-Cascales et al., Reference Martinez-Cascales, Cenis, Cassis and Sánchez2006; Perdikis et al., Reference Perdikis, Favasa, Lykouressis and Fantinou2007), but may actually refer to M. pygmaeus. Conversely, nor should all references to ‘M. caliginosus’ be equalled with M. pygmaeus. Macrolophus individuals collected on D. viscosa by Martinez-Cascales et al. (Reference Martinez-Cascales, Cenis, Cassis and Sánchez2006) and by us in the present study have been molecularly identified as M. melanotoma. Therefore, the references to M. caliginosus on D. viscosa in Alomar et al. (Reference Alomar, Goula and Albajes2002) may actually correctly refer to M. melanotoma.
Integrative taxonomy is a multisource approach that takes advantage of complementarities among disciplines, and the combination of at least three disciplines is recommended. Both genetics and morphology should be included in the first set of disciplines, but morphological identification is generally much easier. The delimitation hypothesis is considered to be significant when more than 95% of the specimens fit it, which is a pragmatic level that has been suggested by other authors (Schlick-Steiner et al., Reference Schlick-Steiner, Steiner, Seifert, Stauffer, Christian and Crozier2010). If we apply these criteria to the available data from different disciplines for M. melanotoma and M. pygmaeus, we can make the following conclusions:
According to the delimitation hypothesis of reproductive incompatibility, these are two different species because, in this study, only 3.6% of females (one female) were able to produce hybrid progeny in the interspecific crossings, and none of these progeny were viable. Similar results were previously showed by Perdikis et al. (Reference Perdikis, Margaritopoulos, Stamatis, Mamuris, Lykouressis, Tsitsipis and Pekas2003). Reproductive incompatibility may also be supported by the consistent differences observed in the profiles of cuticular hydrocarbons in the two species, which can be used to discriminate between them (Gemeno et al., Reference Gemeno, Laserna, Riba, Valls, Castañé and Alomar2012). The insect cuticle is coated with a thin lipid layer containing a high proportion of hydrocarbons, which are often specific to a species, population, sex or developmental or physiological stage (Bagnères & Wicker-Thomas, Reference Bagnères, Wicker-Thomas, Blomquist and Bagnères2010). Therefore, this biochemical character can be very important in the recognition of conspecific mates and for discriminating them among heterospecific mates.
According to the delimitation hypothesis of comparative morphology, one of the characters examined was conclusive for separating the two species, while another was helpful, but in combination with other characters; a combination of head morphometric measurements in the form of a linear discriminant function allows discriminating between the males of the two species without any errors; the length of the egg's respiratory horn, associated with 22% error, was not conclusive for separating the two species.
According to the delimitation hypothesis of mitochondrial DNA, Martinez-Cascales et al. (Reference Martinez-Cascales, Cenis, Cassis and Sánchez2006) classified M. melanotoma and M. pygmaeus as two distinct species because nodes at the species level were supported by high bootstrap values. Two pairs of specific primers designed in the present study allowed species identification by performing a simple PCR assay.
In conclusion, accurate taxonomic characterisation of natural enemies is of crucial importance for successful biological control programmes (Rosen & DeBach, Reference Rosen and DeBach1973). As observed in other biological control organisms inhabiting crops in the Mediterranean area, M. pygmaeus appears to often colonise tomato crops from native habitats and host plants occurring adjacent to crop (Alomar et al., Reference Alomar, Goula and Albajes1994; Lykouressis et al., 2000; Gabarra et al., Reference Gabarra, Alomar, Castañé, Goula and Albajes2004; Ingegno et al., Reference Ingegno, Pansa and Tavella2009). It has been shown previously that D. viscosa is an important host plant for M. melanotoma in habitats adjacent to the crop-growing regions (Alomar et al., Reference Alomar, Goula and Albajes1994; Perdikis et al., Reference Perdikis, Margaritopoulos, Stamatis, Mamuris, Lykouressis, Tsitsipis and Pekas2003, Reference Perdikis, Favasa, Lykouressis and Fantinou2007). However, due to the morphological similarities of these two Macrolophus species, we were not able to recognise that populations of M. melanotoma inhabiting D. viscosa differed genetically and behaviourally from populations of M. pygmaeus inhabiting tomato. Identification of native plants that are sources of the predator that colonises the tomato crop is a key element in the implementation of Conservation Biological control programmes for this crop. With the tools developed in the present study, it will be feasible to identify the Macrolophus species present on the sampled plants. Further studies have to elucidate to what extent both species may coexist on crops or non-crop host plants in our region and in other geographical areas, and whether M. melanotoma is restricted to D. viscosa, the host plant originally identified by Wagner (Reference Wagner1951). Martinez-Cascales et al. (Reference Martinez-Cascales, Cenis, Cassis and Sánchez2006) list several host plants of M. melanotoma and M. pygmaeus, but they are a compilation of previous records that were apparently not confirmed with the results from their work. Host plants of both species, therefore, still remain largely unknown.
Acknowledgements
We are grateful to Dr Marta Goula (University of Barcelona) for her collaboration in obtaining SEM images of predator's eggs. We also thank Thaïs Aznar for her technical support in the molecular analysis. This work was funded by projects AGL2008-00546, AGL2010-18811 and AGL2011-24349 of the Spanish Ministry of Science and Innovation.