INTRODUCTION
The surface of the benthic habitat is colonized predominantly by photosynthetic active microorganisms. Thus, the term microphytobenthos refers to the microscopic, unicellular eukaryotic algae (Bacillariophyceae, Chlorophyceae and Dinophyceae) and the prokaryotic Cyanobacteria that live on sediment surfaces. They grow in habitats ranging from intertidal sand and mud flats, salt marshes and submerged aquatic vegetation beds to subtidal sediments. Although less conspicuous than macroalgae or vascular plants, the microphytobenthos itself can contribute significantly to primary production in littoral zones (Daehnick et al., Reference Daehnick, Sullivan and Moncreiff1992; Pinckney & Zingmark, Reference Pinckney and Zingmark1993) and have a strong influence on the flux of substances across the sediment surface (Wiltshire, Reference Wiltshire2000). In many shallow aquatic systems the biomass of benthic microalgae exceeds that of the phytoplankton in the overlying waters.
Humic substances (HS) are a series of naturally occurring high molecular weight compounds, which are the main component of organic matter in soils and aquatic habitats (Aiken et al., Reference Aiken, McKnight, Wershaw, MacCarthy, Aiken, McKnight, Wershaw and MacCarthy1985). However, evidence gathered during the past decade based on a wide range of techniques indicates the large molecular weights of HS is only apparent, and results, rather, from self-assembly of relatively small and heterogeneous humic molecules into large supramolecular species stabilized by weak dispersive forces (Carlos et al., Reference Carlos, Pedersen, Ogilby and Mártire2011). The term HS is used as a generic name to describe the coloured material or its fractions obtained on the basis of solubility characteristics: humic acids (HA), the soluble fraction of HS at pH values higher than 2; fulvic acids (FA), the soluble fraction of HS under all pH conditions; and humin, the insoluble fraction of HS at any pH conditions.
The importance of the knowledge about HS in aquatic ecosystems consists of their great complexing ability, which is attributed to the different oxygen-containing functional groups, such as carboxylic, phenolic and carbonyl groups. HS form both soluble and insoluble complexes with metal ions and affects their transport to plant roots and potentially to microalgae. Therefore, metal–HS interactions affect the bioavailability of metal ions and potentially the nutrient ions in the marine sediment (Campbell, Reference Campbell, Tessier and Turner1995; Steinberg et al., Reference Steinberg, Kamara, Prokhotskaya, Manusadzianas, Karasyova, Timofeyev, Jie, Paul, Meinelt, Farjalla, Matsuo, Burnison and Menzel2006) and thereby their availability as micronutrients to microalgae in marine ecosystems. Humic substances have been used to demonstrate the adsorption of natural dissolved organic matter (DOM) onto the surfaces of phytoplankton (Campbell et al., 1997; Sánchez Marín & Beiras, Reference Sánchez-Marín and Beiras2011). Humic substances have also been shown to affect the membrane permeability of phytoplankton (Vigneault et al., 2000).
In general, the main limiting factors on the growth of marine diatoms in the sediment are the availability of nutrients and light (Wolff, Reference Wolff1979; MacIntyre et al., Reference MacIntyre, Geider and Miller1996). Thus, microphytobenthic assemblages are found at the uppermost surface layers of the sediments, right at the sediment–water interface. Dissolved organic matter in coastal waters mainly derives from HS from land run-off and can accumulate in the sediment–intersurface layer on the sea bottom. HS are, therefore, present in the same layer as benthic diatoms and thus there is an increasing interest regarding the influence of these substances on the microphytobenthic diatom community within the marine habitat. The need for knowledge about the role of HS in aquatic ecosystems is indeed underpinned by this complexing ability of HA (Prakash & Rashid, Reference Prakash and Rashid1968; Lund, Reference Lund, Broekaert, Güçer and Adams1990; Chen et al., Reference Chen, Porcher, Campbell and Fortin2013).
Not much is known of the effects of HS on the growth of diatoms. Prakash et al. (Reference Prakash, Rashid, Jensen and Subbarao1973) observed that humic and fulvic acids extracted from decomposed residues of two littoral marine algae, Laminaria digitata and Fucus vesiculosus, and from mangrove leachates, stimulated the growth of several marine diatoms. This stimulatory effect was dependent on the concentration as well as on the molecular size of the humic additive. Low molecular size fractions at low concentrations generated the maximum growth responses, as evidenced by increased cell yield, growth rate, chlorophyll concentration and radiocarbon assimilation (Prakash et al., Reference Prakash, Rashid, Jensen and Subbarao1973).
The main aims of this study are the characterization of the HS extracted from the marine sediment, and the evaluation of their effect on the growth of different marine diatoms. For this purpose two benthic pennate diatoms isolated from the Baltic Sea, Navicula ramosissima (C. Agardh) Cleve, 1895 and Entomoneis paludosa (W. Smith) Reimer, 1975, as well as two tychopelagic centric diatoms isolated from the North Sea, Melosira nummuloides C. Agardh, 1824 and Paralia sulcata (Ehrenberg) Cleve, 1873 were chosen, and their growth was monitored in media containing different amounts of HS.
MATERIALS AND METHODS
NaOH, Ba(OH)2, HCl, KCl, KOH, sodium acetate, acetone, potassium biphtalate were all from Merck (USA). For the identification and quantification of pigments by HPLC commercial standards from Sigma-Aldrich (USA) were used. Deionized water (>18 MΩ cm−1, <20 ppb of organic carbon) was obtained from a Millipore system.
Two samples were purchased from the International Humic Substance Society (IHSS) pool of reference materials, the Waskish Peat FA (1R107F) and HA (1R107H). Complementary information on these samples can be found on the IHSS home page (IHSS, 2008).
Sampling site of the marine sediment
Helgoland (54°11.3′N 7°54.0′E), a small offshore island, is situated in the North Sea, German Bight about 60 km from the mainland and the estuaries of the Rivers Elbe and Weser. The surface of the marine sediments was sampled at the beach of Helgoland (54°11′N 7°53′E) in March 2008. The sediments were sterilized, and stored at −20°C before use.
Extraction of the humic acids
The extraction of the HA from the marine sediment was carried out after the method of Moreda-Piñeiro et al. (Reference Moreda-Piñeiro, Bermejo-Barrera and Bermejo-Barrera2004, Reference Moreda-Piñeiro, Seco-Gesto, Bermejo-Barrera and Bermejo-Barrera2006) with the following modifications: a volume of 2 l of 0.1 M HCl mixed with 400 g of the marine sediment was shaken for 4 h at room temperature and decanted overnight. Then, the supernatant was eliminated and the residue was neutralized with 2 l of 0.1 M NaOH under an O2-free atmosphere. During this alkaline extraction the mixture was shaken for 8 h at room temperature and settled overnight. After decantation, the supernatant was acidified with 6 M HCl to pH = 1 and resuspended for 24 h. Following a centrifugation at 7500 r min−1 for 10 min, the solid phase was dissolved by adding 4.4 g KCl and 200 ml 0.1 M KOH. The solution was shaken for a few minutes under an O2-free atmosphere and centrifuged at high speed to remove suspended solids. Thereafter, the HA in the supernatant was precipitated by addition of 6.0 M HCl and the suspension was stored at −20°C for 24 h. After centrifugation, the precipitated HA was filtered and washed several times with sterile distilled water and kept in a stove at 36°C for 5 d to allow elimination of water. After the extraction 7.98 g of an HA extract were obtained from 400 g of the marine sediment. This value was taken as a natural value of HA concentration in the sediment from Helgoland. Thus, the concentration of the extractable HA in the natural marine sediment was Co = 0.020 g of extract per gram of sediment.
Characterization of the HA extract
UV-VISIBLE SPECTROSCOPY
The UV-visible spectra of solutions of the HA extract of the marine sediment were obtained at pH 7 with a UV-1800 SHIMADZU (Japan) spectrophotometer with bandwidth in the range of 0.2 and 4.0 nm according to the selected slit width. From the quotient of the absorbance at 465 nm and 665 nm of 20 mg l−1 aqueous solution of HS, the E4/E6 ratios were obtained. This ratio, used by soil scientists, is reported to be independent of concentration but different for HS derived from different types of soil (Chen et al., Reference Chen, Senesi and Schnitzer1977).
FOURIER TRANSFORM INFRARED SPECTRA (FTIR)
Fourier transform infrared spectra (FTIR) in the range from 4000 to 400 cm−1 were recorded on a Bruker (USA) EQUINOX 25 apparatus with a resolution of 1 cm−1, using a KBr disk. To obtain a high signal/noise ratio 128 scans were accumulated for each sample.
FLUORESCENCE EXCITATION–EMISSION MATRICES (EEM)
Fluorescence measurements were made using a JOBIN-YVON (Japan) spex fluorolog FL3-11 spectrofluorometer with a Xe lamp as the excitation source. The slits were set to 5 nm for both excitation and emission. Corrected fluorescence EEMs (Chen et al., Reference Chen, Westerhoff, Leenheer and Booksh2003) were obtained with excitation wavelengths increasing from 200 to 550 nm in 5 nm steps. For each excitation wavelength, the emission was detected from 300 to 600 nm in 5 nm steps. Air-saturated aqueous solutions of the HA extract of A550 = 0.05 at pH 7 were employed.
DETERMINATION OF ACIDIC FUNCTIONAL GROUPS
The total acidity of HA extract was determined by pH titrimetry with Ba(OH)2 and back-titration with standard solution of HCl (Schnitzer & Khan, Reference Schnitzer and Khan1972). The carboxylic (COOH) acidity was carried out by addition of calcium acetate followed by pH titration of the formed acetic acid (Schnitzer & Gupta, Reference Schnitzer and Gupta1965). The amount of phenolic (OH) groups was obtained by the difference between total and carboxylic acidity. For comparison the characterization of references HS samples (IHSS Waskish Peat FA and HA) of different origin was also done. All samples were analysed in triplicate.
DETERMINATION OF TOTAL ORGANIC CARBON (TOC)
The total organic carbon (TOC) was measured with a high-temperature carbon analyser (Shimadzu TOC 5000 A) using a calibration curve with potassium biphtalate standard. Standard solutions were run before each analysis to check for instrumental shifts.
Growth experiment with the marine diatoms
ISOLATION AND ALGAE CULTURES
Both centric diatoms from the North Sea were isolated at Helgoland Roads (54°11.3′N 7°54.0′E) in January 2007 (Paralia sulcata) and March 2007 (Melosira nummuloides), both pennate diatoms from the Baltic Sea (Navicula ramosissima and Entomoneis paludosa) were isolated in February 2008. The diatoms were cultivated in natural seawater enriched with f/2 medium (Guillard & Ryther, Reference Guillard and Ryther1962) with a salinity of 18 for the Baltic Sea diatoms and 30 for the North Sea diatoms. All diatoms were grown under constant conditions in a culture room with 12:12 light:dark photoperiod at 14–15°C and approximately 50–60 µE s−1 m−2.
TREATMENTS AND EXPERIMENTAL DESIGN
To test our hypothesis that the HS influence the growth of benthic diatoms positively due to the supply of nutrients and light reduction we chose four different treatments: (1) control = a mix of 2/3 seawater and 1/3 f/2 medium, which reflects low nutrient conditions; (2) low HA extract = low concentration of the HA extract with 2/3 seawater and 1/3 f/2 medium; (3) high HA extract = high concentration of the HA extract with 2/3 seawater and 1/3 f/2 medium; and (4) f/2 = full medium with high nutrient concentration.
For each diatom and treatment four replicates were used and the growth was monitored in 500 ml glass flasks (Erlenmeyer) with approximately 10 g sterile quartz sand as growth conditions. The media and the seawater for the diatoms were prepared concerning different salinity conditions. For both pennate diatoms from the Baltic Sea the salinity was set to 18; for both centric diatoms from the North Sea the salinity was set to 30. The low and high HA extract concentrations were 5.5 and 18.6 mg of C l−1, respectively. These values are within the range of dissolved organic carbon found in the natural environment of the diatoms employed here (Beck et al., Reference Beck, Olaf, Fischer, Schnetger and Brumsack2012).
The starting volume of media was 300 ml for each treatment. Due to the thick cultures the starting biovolume for N. ramosissima, E. paludosa and M. nummuloides was 1 × 108 µm3 ml−1 and for P. sulcata 1 × 107 µm3 ml−1. The biovolume was determined according to Hillebrandt et al. (Reference Hillebrand, Dürselen, Kirschtel, Pollingher and Zohary1999) by measuring the cell size of each diatom in the culture stock.
The monitoring of the growth of the diatoms were performed in a culture room with 12 h light:dark cycle, 15°C and 50–60 µE s−1 m−2 light intensity. The position of each flask relative to the light source was randomly assigned every day in order to avoid different light influences on the culture flasks in the culture room.
SAMPLING AND DATA ANALYSIS
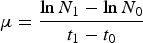
To investigate the growth of the four diatoms sampling was performed every second day working under sterile conditions. The flasks were gently mixed before sampling and 2 ml aliquots of the samples for cell counts were taken from each flask and fixed with 50 µl of Lugol's solution. The cells were enumerated using Sedgwick Rafter counting chambers (Graticules Limited, UK) under a light microscope (Axioskope, Carl Zeiss, Germany) with 100 fold magnification. For each sample the whole chamber or a minimum of 400 chains (cells were counted as single units) were counted to estimate the abundance of the cells ml−1. To compare the growth of the four diatoms, the specific growth rate (µ, d−1) was calculated during the exponential phase of each diatom according to Frost (Reference Frost1972):
 $$\mu = \displaystyle{\ln N_1 - \ln N_0 \over t_1 - t_0}$$
where N 1 is the cell density at the end of the exponential growth phase at time t 1, and N 0 is the cell density at the beginning of the exponential growth phase at the time t 0.
The chlorophyll-a concentration (µg l−1) was measured daily in all replicates to observe the development of the growth in situ. A culture sample (25 ml) was taken from each flask and the chlorophyll a concentration was determined via in situ fluorescence in the laboratory using a multialgal fluorescence analyser (BBE Moldaenke, Germany) (Beutler et al., Reference Beutler, Wiltshire, Meyer, Moldaenke, Luring, Meyerhofer, Hansen and Dau2002). The algae analyser measures the fluorescence of different pigments in situ, and calculates the total content of chlorophyll a (µg l−1). After the measurement the sample was decanted back into its original flask. To avoid a contamination between the treatments the glass cuvette was washed with ethanol (90%) and repeatedly with Millipore water.
In the middle of the exponential growth phase and in the stationary phase (end of the growth experiment) 30 ml culture samples of each replicate and treatment were filtered through 0.45 µm nylon membrane filters (Whatman, UK) under dimmed light conditions to avoid the loss of pigments during the filtration process. The filters were transferred in 15 ml polypropylene conical tubes, subsequently fixed with 2 ml acetone (100%) for chemical extraction of the chlorophyll and then frozen at −80°C for the determination of pigments via high performance liquid chromatography (HPLC). The preparation and extraction of the pigments by HPLC was performed according to the method of Wiltshire et al. (Reference Wiltshire, Harsdorf, Smidt, Blocker, Reuter and Schroeder1998) and Knefelkamp et al. (Reference Knefelkamp, Carstens and Wiltshire2007). Pigments were separated and identified using the retention time and the integrated area in combination with a commercial standard for each pigment (Wiltshire, Reference Wiltshire2000).
At the stationary phase the residual culture media was filtrated through 0.45 µm membrane filters (Whatman) and the filtrate was frozen at −20°C for the analysis of nutrients. The colorimetric determination of nutrients (silicate, nitrate, nitrite, ammonia and phosphate concentrations) were analysed according to the method of Grasshoff (Reference Grasshoff1976) using a spectrophotometer (Hitachi U-1100, Hitachi Ltd, Japan).
STATISTICAL ANALYSIS
To test the hypothesis that the HA influence the growth of diatoms positively, each growth rate of the four diatoms was compared in a one-factorial analysis of variance (ANOVA) with the Fisher's least significant difference (LSD) post-hoc test and a significance level of P < 0.05. Furthermore, to detect differences between the growth rates of the four diatoms in combination with the factor treatments a two-factorial ANOVA with the LSD post-hoc test (significance level of P < 0.05) was performed. Additionally, the pigment concentrations in the stationary phase of the four diatoms were compared with the factor treatments in an ANOVA with the Fisher's LSD post-hoc test (significance level of P < 0.05). Correlations between the abundance and the in situ fluorescence were calculated with the Spearman rank correlation coefficient. All statistical analysis for the growth experiments was performed with STATISTICA (STATISTICA 7.1, StatSoft Inc., USA).
RESULTS
Physicochemical properties of the HA extract
UV-VISIBLE SPECTROSCOPY
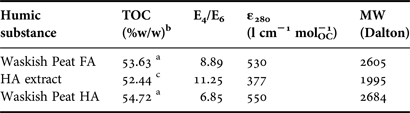
The molar absorption coefficient at 280 nm (ε 280) was obtained from the C content of the HA extract (52.4%), as determined by TOC analysis (Table 1). The weight-averaged molecular weight of 1995 Da can be estimated from the linear correlation with ε 280 (Chin et al., Reference Chin, Aiken and O'Loughlin1994). The low value determined here is in line with the lower molecular weights observed for marine humic and fulvic acids from the euphotic zone compared to the corresponding terrestrial HS (Carder et al., Reference Carder, Steward, Harvey and Ortner1989).
Characterization of the humic acids extracted from the marine sediment, Helgoland, North Sea in comparison with reference humic substances from IHSS.

a, from IHSS http://www.humicsubstances.org/elements.html/; b, total organic carbon in %(w/w) of a dry, ash-free sample; c, the ash content measured as recommended by Ghabbour & Davies, Reference Ghabbour and Davies2005 is 2.89%(w/w).
The spectral slope coefficient (S) is a parameter that expresses light absorption efficiency as a function of wavelength and is related to the nature of the chromophore (Del Vecchio & Blough, Reference Del Vecchio and Blough2002). The value of S calculated as explained in Del Vecchio & Blough (Reference Del Vecchio and Blough2002) for the marine sediment (0.01611 ± 0.00004) is very similar to that obtained for dissolved organic matter from Delaware Bay water (0.0166; (Del Vecchio & Blough, Reference Del Vecchio and Blough2002)).
Despite of the lack of absorption maxima in the HS UV-visible spectra, the absorbance ratio at 465 and 665 nm (namely E 4/E 6 ratio) has been widely used for the characterization of HS, being normally larger for fulvic than for humic acids (Chen et al., Reference Chen, Senesi and Schnitzer1977; Mignone et al., Reference Mignone, Martin, Morán Vieyra, Palazzi, López de Mishima, Mártire and Borsarelli2012). Also the increase of the molecular condensation of the HS was expected to decrease the E 4/E 6, due to the higher absorption at the red region of the visible spectrum (Lguirati et al., Reference Lguirati, Ait Baddi, El Mousadik, Gilard, Revel and Hafidi2005). As far as we know, there are no reported values of this ratio for marine sediment. However, the value obtained here (11.25) is in agreement with the low molecular weight of the sample and similar to that obtained for a phenolic-rich fraction of aquatic samples (Chen et al., Reference Chen, Gu, Leboeuf, Pan and Dai2002).
FLUORESCENCE EXCITATION–EMISSION MATRICES (EEM)
Sierra et al. analysed the EEM of a series of HS of different origin. The EEM show at least four excitation/emission (Ex/Em) pairs related to the α′, α, β and γ (or δ) fluorescence previously found in natural waters. They found that the α′ and α peaks, which identify typical humic-like components, are present in all samples independently of their origin. The Ex/Em pairs corresponding to the α′ and α peaks are located at ca 260–265 nm/460–525 nm and ~310–360 nm/440–520 nm, respectively. The β fluorescence (Ex/Em ca 320 nm/430 nm) is present only in a few marine and estuarine samples. It emerges as a shoulder on the α peak and its detection depends on the emission intensity of the α peak (Sierra et al., Reference Sierra, Giovanela, Parlanti and Soriano-Sierra2005). The γ (or δ) peak is observed at Ex/Em. 270 nm/330 nm (Parlanti et al., Reference Parlanti, Morin and Vache2002) and is also characteristic of marine samples. It was attributed to organic materials freshly released by algae and/or marine organisms to the dissolved organic matter pool as a result of biological activity. Higher intensities of the γ peak relative to the β one are observed when the samples are collected during the first stages of degradation of freshly produced biological material. Thus, the ratio of these peaks can be used as a marker to estimate the biological activity in coastal zones and the different stages of the biological production (Parlanti et al., Reference Parlanti, Morin and Vache2002).
The EEM of aqueous solutions of the HA extract (Figure 1) shows the presence of a major α′ peak at Ex/Em = 350 nm/460 nm characteristic of FA components, an α peak typical for HA components at Ex/Em = 365 nm/520 nm and a β peak at Ex/Em 310 nm/440 nm. The absence of the γ (or δ) peak indicates an advanced stage of degradation.
Fluorescence excitation–emission matrices and the corresponding three-dimensional projections for the humic acids extract.
The α and α′ peak relative intensities has been employed to distinguish between fluorescent organic matter from terrestrial and marine environments with the highest values being measured in open-sea waters due to the reduced contribution of the α fluorescence in these environments (Sierra et al., Reference Sierra, Donard, Lamotte, Belin and Ewald1994, Reference Sierra, Donard and Lamotte1997; Coble, Reference Coble1996). A high value for the α′/α ratio (2.12) is obtained for our sample, in agreement with a high contribution of the HA with respect to the FA components, as expected from the procedure employed for the extraction.
GENERAL FEATURES OF THE FTIR SPECTRA
Figure 2 shows the FTIR absorption spectra of the HA extract and reference humic substances from IHSS. The highest absorption band of the samples was at around 3420 cm−1 due to the O–H stretching of carboxylic acids, phenols and alcohols. The bands at 2920–2850 cm−1 (Song et al., Reference Song, Chouparova, Jones, Feng and Marinkovic2001; Andjelkovic et al., Reference Andjelkovic, Perovic, Purenovic, Бlagojevic, Nikolic, Andjelkovic and Bojic2006) were characteristics of the aliphatic C–H stretching. The absorption at 1720 cm−1 was assigned to the C = O stretching from COOH. The band at 1600–1650 cm−1 was due to the C = O stretching of COO–, ketonic C = O and aromatic C = C conjugated with COO–. The peak at 1400 cm−1 was assigned to aliphatic CH bending and COO– asymmetric stretching. There is a good agreement between the FTIR spectrum of the HA extract and those of WPFA and WPHA. The broad band at 1100–1000 cm−1 present only in the extract is characteristic of Si–O of silicates (Amir et al., Reference Amir, Hafidi, Bailly and Revel2003).
FTIR absorption spectrum of the humic acids extract from the marine sediment and reference humic substances from IHSS. Humic substance abbreviations: WPHA, Waskish Peat humic acid; WPFA, Waskish Peat fulvic acid.
DETERMINATION OF TOTAL ACIDITY, CARBOXYLIC GROUPS AND PHENOLIC GROUPS
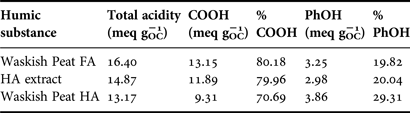
Values of total acidity and carboxyl groups for the HA extract were shown in Table 2. It has been also suggested that the 300–350 nm region in the excitation spectra was dominated by chromophores with high carboxylic groups content, while structures containing phenolic groups act between 350 and 400 nm (Silva, Reference Silva1996). Both excitation bands were observed in the EEM of the HA extract, in agreement with the high content of carboxylic as well as the phenolic groups.
Total acidity, carboxyl groups (COOH), phenolic groups (PhOH) (in meq per g of organic carbon) in the humic acids (HA) extract and reference humic substances from IHSS.
The value of the number of carboxylic groups per gram of carbon (meq gOC−1) was higher than those observed for HA of different origin including those extracted from estuarine waters (Zhang et al., Reference Zhang, Du, Zhang, Yu and Zhang2011) and resembled more to the values obtained for FA (IHSS, 2008; Silva, Reference Silva1996), even though a method for the extraction of HA was employed. This result was in agreement with the FA component observed in the EEM and with the low molecular weight of the extract.
Growth of the diatoms
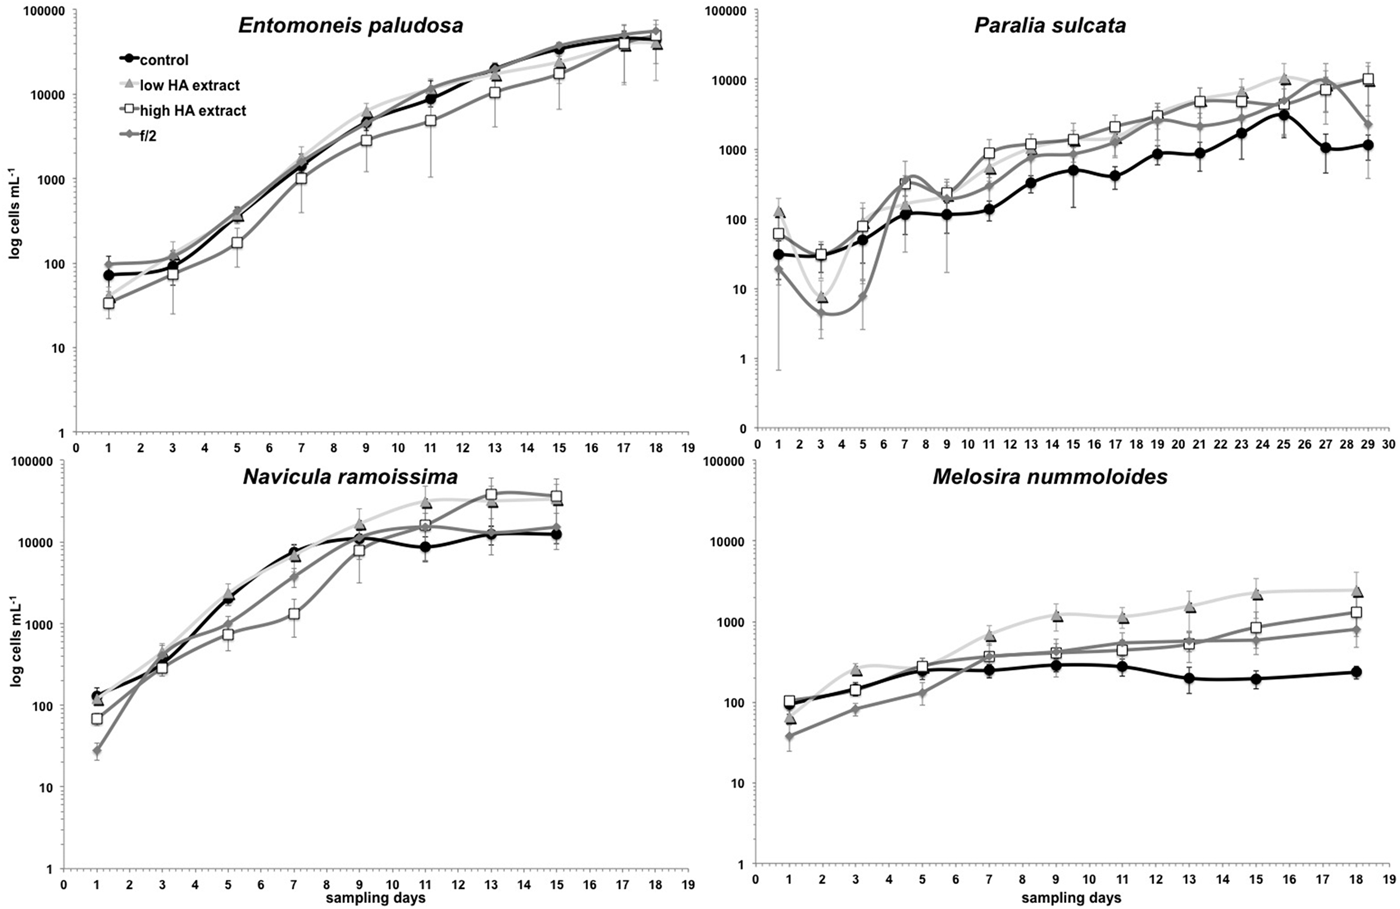
The general growth of diatoms followed a typical sigmoid curve with well defined growth phases in batch cultures: a short lag phase, the exponential or growth phase and the stationary phase with cell death at the end. The growth rate is important for investigations of the ecological success of a species in adapting to its environmental conditions.
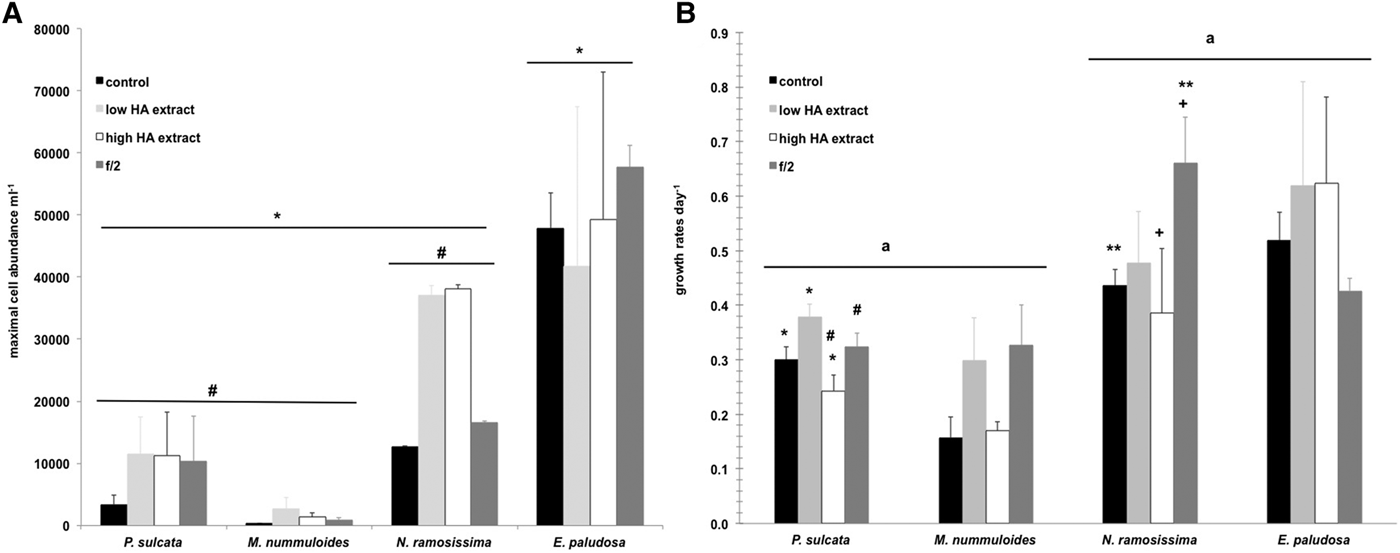
The growth of the four diatoms showed differences in the length of the growth phases. The fastest growth was detected for Navicula ramosissima within 15 d compared to Entomoneis paludosa (18 d), Melosira nummuloides (18 d) and Paralia sulcata (29 d), indicating that especially P. sulcata has a slow growth (Figure 3). Furthermore, P. sulcata took 23–25 d to start the stationary phase, while the stationary phase of all other diatoms began between days 11 and 17. Melosira nummuloides displayed the lowest abundances within all treatments compared to the other three diatoms. The mean maximal cell abundance from all treatments for each diatom was calculated to compare the growth of the diatoms. Significantly the highest maximal abundances were obtained by E. paludosa (ranging from ca 41,800–57,700 cells ml−1 in all treatments) compared to N. ramosissima (12,700–38,100 cells ml−1), P. sulcata (3400–11,500 cells ml−1) and M. nummuloides (300–2700 cells ml−1) (ANOVA, LSD post-hoc test, P < 0.05) (Figure 4A). The higher abundances in N. ramosissima and P. sulcata in both treatments with addition of humic acid extract compared to the control and f/2 medium seemed to indicate a positive influence of the HA on the growth of these diatoms, but this is only a tendency (Figure 4A).
Monitoring of the growth of the four diatoms (cells ml−1) in different treatments. Note the logarithmic scale on y-axis.
(A) Mean maximal cell abundance per ml (±standard error (SE)) of the four diatoms in the treatments. Significant differences in the maximal cell abundance of the diatoms were shown by the line and the same symbol (ANOVA, LSD post-hoc test, P < 0.05). (B) Growth rates per day (±SE) in the exponential phase of the four diatoms in the treatment. Significant differences in the growth rates of the diatoms were shown by the line and the same letter (ANOVA, LSD post-hoc test, P < 0.01) and significant differences in the growth rates of each diatom in between the treatments were shown by the same symbols (ANOVA, LSD post-hoc test, P < 0.05).
In general, the growth rates per day in the exponential phase of P. sulcata and M. nummuloides were significantly lower compared to both pennate diatoms (ANOVA, LSD post-hoc test, P < 0.01) (Figure 4B). A treatment comparison within each diatoms exhibited significant differences in the growth rates of P. sulcata and N. ramosissima. Paralia sulcata displayed significantly higher growth rates in the treatment with low HA extract compared to the control and high HA extract (ANOVA, LSD post-hoc test, P < 0.05). Furthermore, the growth in the treatment with high concentration of HA extract was the lowest (Figure 4B). The growth rates in N. ramosissima showed a slightly different picture compared to the maximal cell abundance. Here, the treatment with high HA extract indicated a significant lower growth compared to the f/2 medium (ANOVA, LSD post-hoc test, P < 0.05) (Figure 4B). The growth with addition of humic acids was strongly dependent on the diatoms. Paralia sulcata (significantly), N. ramosissima and M. nummuloides (only in a tendency) displayed higher growth within the treatment with low concentration of HA extract compared to the treatment with high concentration of HA extract and control, whereas E. paludosa showed a similar growth in both HA treatments (Figure 4B). The higher growth in the f/2 medium could be explained with the higher nutrient concentrations in the media.
Summarizing the data of the abundance and growth rates, the best growth condition for N. ramosissima were both treatments with HA addition and f/2, for P. sulcata and M. nummuloides the treatment with the low concentrations of the HA extract and the f/2 medium. Entomoneis paludosa showed slightly higher growth rates in both HA extract treatments but there were no significantly differences among all treatments.
The chlorophyll-a concentration (µg l−1) measured via the algae analyser showed significant differences in all four diatoms. In P. sulcata the highest concentrations of chlorophyll a were obtained in the treatment with low concentration of HA extract compared to the high concentration of HA extract, control and f/2 media (ANOVA, LSD post-hoc test, P < 0.01). This result is in line with the highest growth rates in this diatom. Furthermore, also significantly different was the amount of chlorophyll a in the high HA extract treatment compared to the low HA extract, control and f/2 medium treatments (ANOVA, LSD post-hoc test, P < 0.05). It is interesting that the higher chlorophyll-a concentration is observed for the high concentration of HA extract in the context of the lowest growth rates. One explanation of the higher amount of chlorophyll-a could be that higher pigment concentrations are needed to absorb the lower light intensities due to the light screening effect of HA. Melosira nummuloides produced the significantly highest amounts of chlorophyll-a in the treatment with low concentration of HA extract compared to that with high concentration of HA extract, control and f/2 (ANOVA, LSD post-hoc test, P < 0.001). For M. nummuloides, despite the same growth rates the amount of chlorophyll-a in the treatment with high concentration of HA extract was significantly higher compared to the control (ANOVA, LSD post-hoc test, P < 0.05). Also N. ramosissima exhibited highest chlorophyll-a concentration in the low HA extract treatment (ANOVA, LSD post-hoc test, P < 0.05). An exception was the chlorophyll-a concentration of E. paludosa which exhibited significantly lower values in the high concentration of HA extract treatment (ANOVA, LSD post-hoc test, P < 0.05). The chlorophyll-a concentration (µg l−1) and the abundances (cells ml−1) were significantly positively correlated for all four diatoms. Thus, the determination of the chlorophyll-a concentration via algae analyser measurement results in a good estimation of the cell abundance. Furthermore, the pennate diatoms revealed higher correlation coefficients (N. ramosissima and E. paludosa: R = 0.97 both, Spearman rank correlation, P < 0.05) due to the single cells, whereas the correlation coefficients of the both centric diatoms (P. sulcata: R = 0.64; M. nummuloides: R = 0.81, Spearman rank correlation, P < 0.05) were lower due to the chain formation.
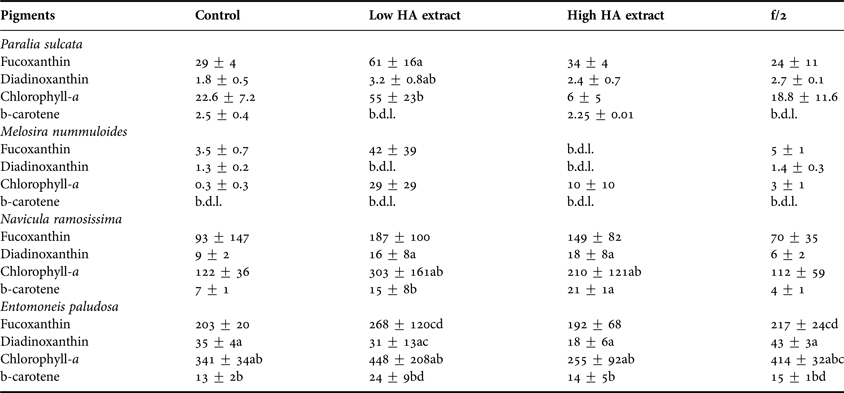
As indicated by the higher growth rates of N. ramosissima and E. paludosa, the concentrations of the pigments (fucoxanthin and chlorophyll-a) were significantly higher for these algae than for P. sulcata and M. nummuloides (ANOVA, LSD post-hoc test, P < 0.001). Furthermore, as shown by the growth rates, the highest concentrations of pigments were achieved in the low HA extract treatment. For P. sulcata the concentrations of chlorophyll-a and fucoxanthin in the low HA extract treatment were significantly higher than that of diadinoxanthin (two-way ANOVA, LSD post-hoc test, P < 0.05) (Table 3). For N. ramosissima and E. paludosa the chlorophyll-a concentration in the low and high HA extract treatments were significantly higher than those of the other pigments (two-way ANOVA, LSD post-hoc test, P < 0.05) (Table 3).
Concentrations of the main pigments (µg l−1) determined via HPLC in the stationary phase of the growth experiment from the four diatoms (mean ± standard error). Statistical comparison was done for each diatom species within the treatments and the letters indicate significant differences, whereas the same letters displayed significant differences within one treatment in comparison of the pigments (two-way ANOVA, P < 0.05). b.d.l., below detection limit.
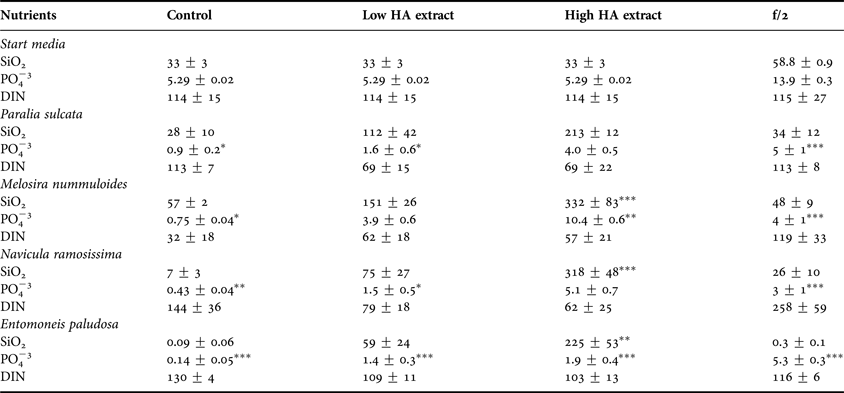
Additionally, the nutrient concentrations differed significantly between the treatments within the four diatoms (Table 4). The phosphate concentrations in all treatments and for all diatoms were lower at the end of the experiment, which could be explained by the uptake rates of phosphate by the diatoms due to the growth. Interestingly, the concentrations of silicate ions increased during the low and high HA extract treatments for all diatoms. Thus, for P. sulcata, the silicate concentration was the highest in the high HA extract treatment (two-way ANOVA, LSD post-hoc test, P < 0.05), whereas the phosphate concentrations were higher in both, the high HA extract and the f/2 treatment (two-way ANOVA, LSD post-hoc test, P < 0.05) and the total inorganic nitrogen concentrations were higher in the control and f/2 treatment (two-way ANOVA, LSD post-hoc test, P < 0.05). Similar results in the nutrient concentrations were shown for M. nummuloides, where the silicate and phosphate concentration were highest in the high HA extract treatment (two-way ANOVA, LSD post-hoc test, P < 0.05), and the total inorganic nitrogen concentrations were highest in the f/2 treatment and differed significantly from the control treatment (two-way ANOVA, LSD post-hoc test, P < 0.05). Both pennate diatoms displayed similar results in the silicate concentration with highest values in the high HA extract treatment which differed significantly from the other treatments (two-way ANOVA, LSD post-hoc test, P < 0.001). The phosphate concentrations was highest in the high HA extract and f/2 treatment for N. ramosissima and highest in the f/2 treatment for E. paludosa. The total inorganic concentration was significantly higher in the f/2 treatment for N. ramosissima (two-way ANOVA, LSD post-hoc test, P < 0.05).
Concentrations of the nutrients (µmol l−1) determined in the start media and at the stationary phase of the growth experiment in the media of the four diatoms (mean ± standard error). The statistical tests are between each diatom, treatment and nutrient concentration in comparison with the start concentration (two-way ANOVA, LSD post-hoc test, *P < 0.05, **P < 0.01, ***P < 0.001).
DISCUSSION
The influence of humic substances (HS) on the organisms in the water column and the sediment are poorly understood. It is known that HS influence the light regime in the water column, which has an effect on the photosynthetic organisms especially living on the sediment. Furthermore, HS affect the surrounding biogeochemical conditions due to the ability to form complexes with high molecular weight compounds and inorganic cations (Bährs & Steinberg, Reference Bährs and Steinberg2012).
The results showed that only in Paralia sulcata was a significantly higher growth rate observed in the low HA extract treatment compared to the control and high HA extract. The same trend of development was shown in Navicula ramosissima and Melosira nummuloides, where the growth rates were slightly higher in the low HA extract compared to the high HA extract and control treatments; however, it was not significant. Despite this, a significant decrease in the growth rates within the high HA extract compared to the f/2 medium was detected for P. sulcata and N. ramosissima. This decrease in the growth rates could be explained by the reduced light conditions due to higher concentrations of HS in the media. Especially for P. sulcata and N. ramosissima, the growth rates in the low HA extract treatment were comparable to the growth rates in the f/2 medium. This fact could be explained by considering that, in spite of the lower nutrient concentration in the low HA extract treatment, the growth of both diatoms was positively enhanced by the addition of the humic acids. These results are in line with the expected reduction of light conditions in the medium (which should be favourable for the growth of these algae) and the supply of nutrients in the experiments performed in the presence of HS. However, the growth response to humic acid addition is strongly dependent on the diatoms, because M. nummuloides and E. paludosa showed no significant differences in growth rates during the experiment. This is an interesting point due to the fact that E. paludosa and N. ramosissima are both pennate benthic diatoms and P. sulcata and M. nummuloides are both tychopelagic long-chain-forming centric diatoms.
Growth rates are one of the most important parameters determining the fitness of the diatoms. Thus, higher growth rates as a response to the low concentration of humic acids in P. sulcata are indicative of adaptation to low light intensity conditions, which can be confirmed for P. sulcata from field sampling data obtained from a daily monitoring programme maintained since 1962 at Helgoland Roads, North Sea (Franke et al., Reference Franke, Bucholz and Wiltshire2004; Wiltshire & Manly, Reference Wiltshire and Manly2004). The concentration value of HS at which an inhibitory effect is observed seems to depend both on the HS and the species employed in the experiments. Paralia sulcata is a cosmopolitan, brackish-to-marine diatom species found in littoral and sublittoral zones in the sediments as well as in the water column, typing this species as tychopelagic (Roelofs, Reference Roelofs1984; Zong, Reference Zong1997; McQuoid & Nordberg, Reference McQuoid and Nordberg2003). It is often associated with sandy habitats and fine-grained sediments rich in organic material (Roelofs, Reference Roelofs1984; McQuoid & Hobson, Reference McQuoid and Hobson1998). Also, M. nummoloides is described as a benthic species occurring mostly in brackish, organically polluted waters (Wilkinson et al., Reference Wilkinson, Henderson and Wilkinson1976). Hellebost & Guillaro (Reference Hellebost and Guillaro1967) showed that M. nummoloides could take up and accumulate amino acids in both light and dark conditions. Thus, P. sulcata and M. nummuloides, as benthic species, are capable of living in close contact with the sediment and can be found in highly turbid waters. They are highly adapted to media rich in organic matter and low light intensity, showing an advantage in organic rich waters with low light penetration (McLean et al., Reference McLean, Corrigan and Webster1981; McQuoid & Hobson, Reference McQuoid and Hobson1998). Under these conditions both algae can present a heterotrophic metabolism (Graham & Wilcox, Reference Graham and Wilcox2000). But the growth response to humic acid addition is different in both diatoms. M. nummuloides shows no significant effects in the different media. In contrast, P. sulcata responds with increasing growth to the low HA concentrations and is well adapted to these reduced light conditions. This behaviour explains the good growth conditions observed here in the presence of low HS concentration. This growth-promoting condition of adding natural HS to the algae cultures can be explained by the increase in the bioavailability of trace metals or other nutrients (Prokhotskaya & Steinberg, Reference Prokhotskaya and Steinberg2007). Furthermore, N. ramosissima as a benthic diatom species plays an important role in the sediment structure and shows highest cell abundances with humic acid addition. In contrast, E. paludosa shows a slightly higher and faster growth rate in the full medium treatment (f/2). Thus, both benthic diatom species are only slightly affected by the addition of HS in the media, which can be explained by their living directly on the sediment. Both benthic diatoms (N. ramosissima and E. paludosa) are highly adapted to live directly on the sediment and, therefore, they are influenced directly by the humic acids and also the lower light conditions near the bottom. Furthermore, N. ramosissima and E. paludosa are more affected by the addition of higher concentrations of nutrients, which can be seen in a higher response in the f/2 media.
Prakash et al. (Reference Prakash, Rashid, Jensen and Subbarao1973) used pelagic diatom species (Skeletonema costatum, Thalassiosira nordenskioeldii and Phaeodactylum tricornutum) and showed the best growth at concentrations of 0.03 g l−1 HS.
Other studies showed that especially cyanobacteria were much more sensitive to the addition of humic substances, which reduce growth due to the formation of complex aquatic HS with iron (Graham & Wilcox, Reference Graham and Wilcox2000) and due to the reduction of Fe availability and intracellular H2O2 development (Bährs & Steinberg, Reference Bährs and Steinberg2012). Imai et al. (Reference Imai, Fukushima and Matsushige1999) showed a significantly lower growth of Microcystis aeruginosa when a similar concentration of fulvic acid (2 mg dry weight l−1) extracted was added to the growth media. They suggested that growth inhibition was due to the iron complexation with the fulvic acids. Thus, the authors concluded that HS in general play an important role in the formation of M. aeruginosa blooms in lakes.
In contrast to these results, the growth of the four diatoms in our experiment was not negatively affected by the addition of humic substances. Furthermore, our results indicate that especially benthic species are better adapted to a higher organic matter content (such as humic substances) in the sediment, and show that especially pelagic species cannot cope very well with increasing HS in the water column.
Highest fucoxanthin and chlorophyll a concentrations were reached in all four diatoms in the highest concentrations of both HS treatments, which is in line with the higher abundances of the marine diatoms in these treatments. Fucoxanthin is an important light harvesting antennae pigment at low light conditions, which is in line with the high concentrations measured here for the four diatom species, especially in the treatments with HS addition. To summarize our findings, we can say that HS slightly promote the growth of these diatom species and the chlorophyll a as well as the fucoxanthin concentrations are increased.
Another effect of the stimulated growth of the diatom species is the increasing bacterial production in the treatments with HS addition. It is possible that bacteria decomposed the high molecules of the HS (Bosio et al., Reference Bosio, David Gara, García Einschlag, Gonzalez, del Panno and Mártire2008) due to the microbial loop leading to a release of nutrients in the media. Thus, the nutrients become more available for these primary producers, which could be reflected in the higher nutrient concentrations, especially in the treatments with HS addition. Especially for P. sulcata we expected very low silicate concentrations at the end of the growth experiment due to the high demand for silicate for the valve formation of this diatom. This was not well correlated with our expectations, because the highest growth rates were shown in the low HA treatment. It might also be possible that the humic acids leach out the silicate from the sand and concentrate these in the media. This fact may also explain the high concentrations of silicate for all other diatoms in the low and high HS treatments.
Because of the input of HS from freshwater run-off into the marine habitat, the influences of HS on marine organisms, especially on phytoplankton, should not be neglected. The reason why better results are obtained in the presence of lower concentrations of HS can be attributed to the greater light absorption in media with higher HS concentration, which results in a diminished photosynthesis process (Prakash & Rashid, Reference Prakash and Rashid1968; Steinberg et al., Reference Steinberg, Kamara, Prokhotskaya, Manusadzianas, Karasyova, Timofeyev, Jie, Paul, Meinelt, Farjalla, Matsuo, Burnison and Menzel2006).
The stimulatory effect observed here in the presence of the extract could be associated with an indirect chelation response or with a direct cell sensitization response. Chen & Wang (Reference Chen and Wang2008) measured Fe uptake by the coastal diatom Thalassiosira pseudonana and the Cyanobacteria Synechococcus sp., using other HA as model ligands. They showed that high bioavailability of HA-bound Fe(III) implies that HS are important not only in controlling Fe geochemical behaviour, but also in providing Fe for marine phytoplankton, especially in estuarine and coastal waters. By separating the uptake media from the phytoplankton, they demonstrated that the organic-bound Fe was first absorbed onto the cell surfaces and exchanged Fe into the specific surface sites before Fe internalization. The high content of carboxylic acid groups found here for the HA extract supports the possibility of this type of mechanism. On the other hand, the low molecular weight obtained here for the HA extract is consistent with the possibility of the penetration of the extract into the plant cell (Rashid, Reference Rashid1971; Nardi et al., Reference Nardi, Pizzeghello, Muscolo and Vianello2002).
CONCLUSION
To summarize our findings, we can say that: (1) spectroscopic analysis of the marine sediment extract obtained here shows the existence of both humic and fulvic components; and (2) the addition of the extract to the medium promotes the growth of Paralia sulcata and slightly promotes the growth of Navicula ramosissima, Entomoneis paludosa and Melosira nummoloides, as evidenced mainly by the increased growth rates as well as concentration of chlorophyll-a and fucoxanthin. The stimulatory effect observed here in the presence of the humic acids extract can be associated with an indirect chelation response, a direct cell sensitization response and increasing bacterial production.
ACKNOWLEDGEMENTS
We are very thankful to our technical assistants: Kristine Carstens for helping by the measuring the nutrients and the analytical procedure during the growth experiments, and Silvia Peters for her assistance and for providing the media for the growth experiment. We are grateful to Nicole Aberle-Malzahn and Katherina Schoo for inspiring discussions. We would like to thank Birte Matthiessen for providing the pennate diatom cultures from the Baltic Sea and to Sonia Ulic for measuring the FTIR spectra.
FINANCIAL SUPPORT
M.V.M. and C.G. thank DAAD for studentships. M.V.M. also thanks CONICET (Consejo Nacional de Investigaciones Científicas y Tecnológicas de la República Argentina) for a graduate studentship. D.O.M. is a research member of Comisión de Investigaciones Científicas de la Provincia de Buenos Aires (CICPBA, Argentina).